Zip Codes with the Highest Percentage of Population Employed in Health Diagnosing & Treating in Salt Lake City, UT
RELATED REPORTS & OPTIONS
Health Diagnosing & Treating
Salt Lake City
Compare Zip Codes
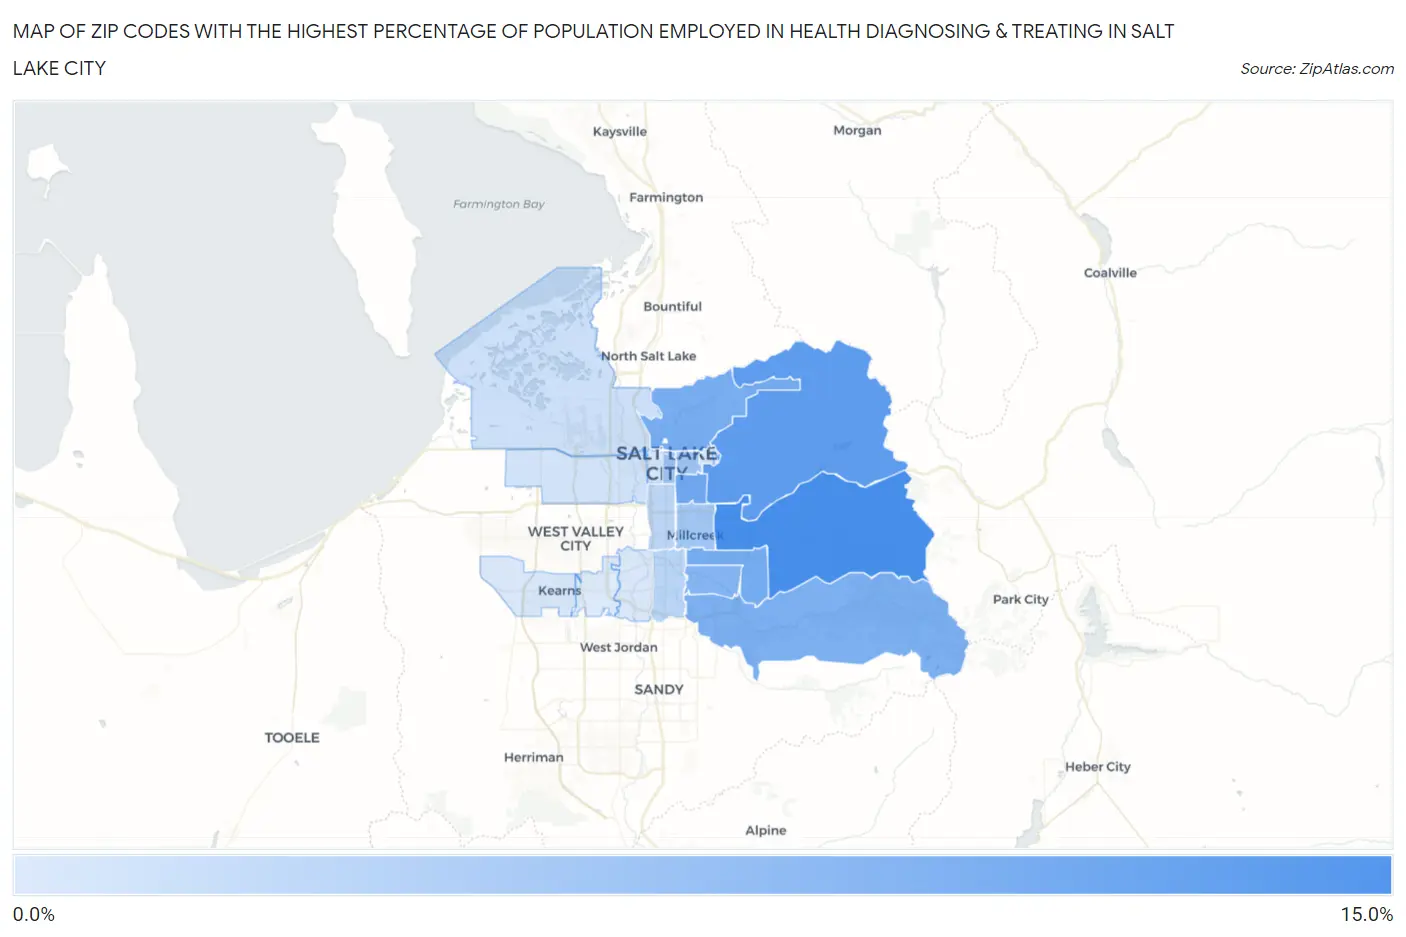
Map of Zip Codes with the Highest Percentage of Population Employed in Health Diagnosing & Treating in Salt Lake City
0.0%
15.0%
Zip Codes with the Highest Percentage of Population Employed in Health Diagnosing & Treating in Salt Lake City, UT
| Zip Code | % Employed | vs State | vs National | |
| 1. | 84109 | 12.6% | 5.1%(+7.51)#10 | 6.2%(+6.39)#1,893 |
| 2. | 84108 | 11.1% | 5.1%(+5.99)#15 | 6.2%(+4.87)#2,794 |
| 3. | 84105 | 9.9% | 5.1%(+4.73)#20 | 6.2%(+3.61)#4,051 |
| 4. | 84124 | 9.5% | 5.1%(+4.39)#24 | 6.2%(+3.27)#4,511 |
| 5. | 84103 | 9.4% | 5.1%(+4.27)#25 | 6.2%(+3.15)#4,701 |
| 6. | 84121 | 9.0% | 5.1%(+3.92)#26 | 6.2%(+2.80)#5,287 |
| 7. | 84117 | 8.5% | 5.1%(+3.34)#36 | 6.2%(+2.22)#6,403 |
| 8. | 84111 | 6.9% | 5.1%(+1.75)#50 | 6.2%(+0.633)#10,755 |
| 9. | 84102 | 6.8% | 5.1%(+1.66)#53 | 6.2%(+0.545)#11,029 |
| 10. | 84106 | 6.7% | 5.1%(+1.53)#60 | 6.2%(+0.405)#11,492 |
| 11. | 84107 | 5.2% | 5.1%(+0.040)#90 | 6.2%(-1.08)#17,057 |
| 12. | 84115 | 4.9% | 5.1%(-0.202)#95 | 6.2%(-1.32)#18,005 |
| 13. | 84116 | 3.9% | 5.1%(-1.22)#141 | 6.2%(-2.34)#21,675 |
| 14. | 84104 | 3.7% | 5.1%(-1.42)#146 | 6.2%(-2.54)#22,296 |
| 15. | 84112 | 3.5% | 5.1%(-1.65)#157 | 6.2%(-2.77)#22,990 |
| 16. | 84101 | 3.4% | 5.1%(-1.68)#158 | 6.2%(-2.80)#23,048 |
| 17. | 84123 | 3.3% | 5.1%(-1.81)#162 | 6.2%(-2.93)#23,439 |
| 18. | 84118 | 3.2% | 5.1%(-1.94)#164 | 6.2%(-3.06)#23,810 |
| 19. | 84129 | 3.0% | 5.1%(-2.16)#175 | 6.2%(-3.28)#24,403 |
1
Common Questions
What are the Top 10 Zip Codes with the Highest Percentage of Population Employed in Health Diagnosing & Treating in Salt Lake City, UT?
Top 10 Zip Codes with the Highest Percentage of Population Employed in Health Diagnosing & Treating in Salt Lake City, UT are:
What zip code has the Highest Percentage of Population Employed in Health Diagnosing & Treating in Salt Lake City, UT?
84109 has the Highest Percentage of Population Employed in Health Diagnosing & Treating in Salt Lake City, UT with 12.6%.
What is the Percentage of Population Employed in Health Diagnosing & Treating in Salt Lake City, UT?
Percentage of Population Employed in Health Diagnosing & Treating in Salt Lake City is 7.1%.
What is the Percentage of Population Employed in Health Diagnosing & Treating in Utah?
Percentage of Population Employed in Health Diagnosing & Treating in Utah is 5.1%.
What is the Percentage of Population Employed in Health Diagnosing & Treating in the United States?
Percentage of Population Employed in Health Diagnosing & Treating in the United States is 6.2%.