Zip Codes with the Highest Percentage of Population Employed in Accommodation & Food Services in Salt Lake City, UT
RELATED REPORTS & OPTIONS
Accommodation & Food Services
Salt Lake City
Compare Zip Codes
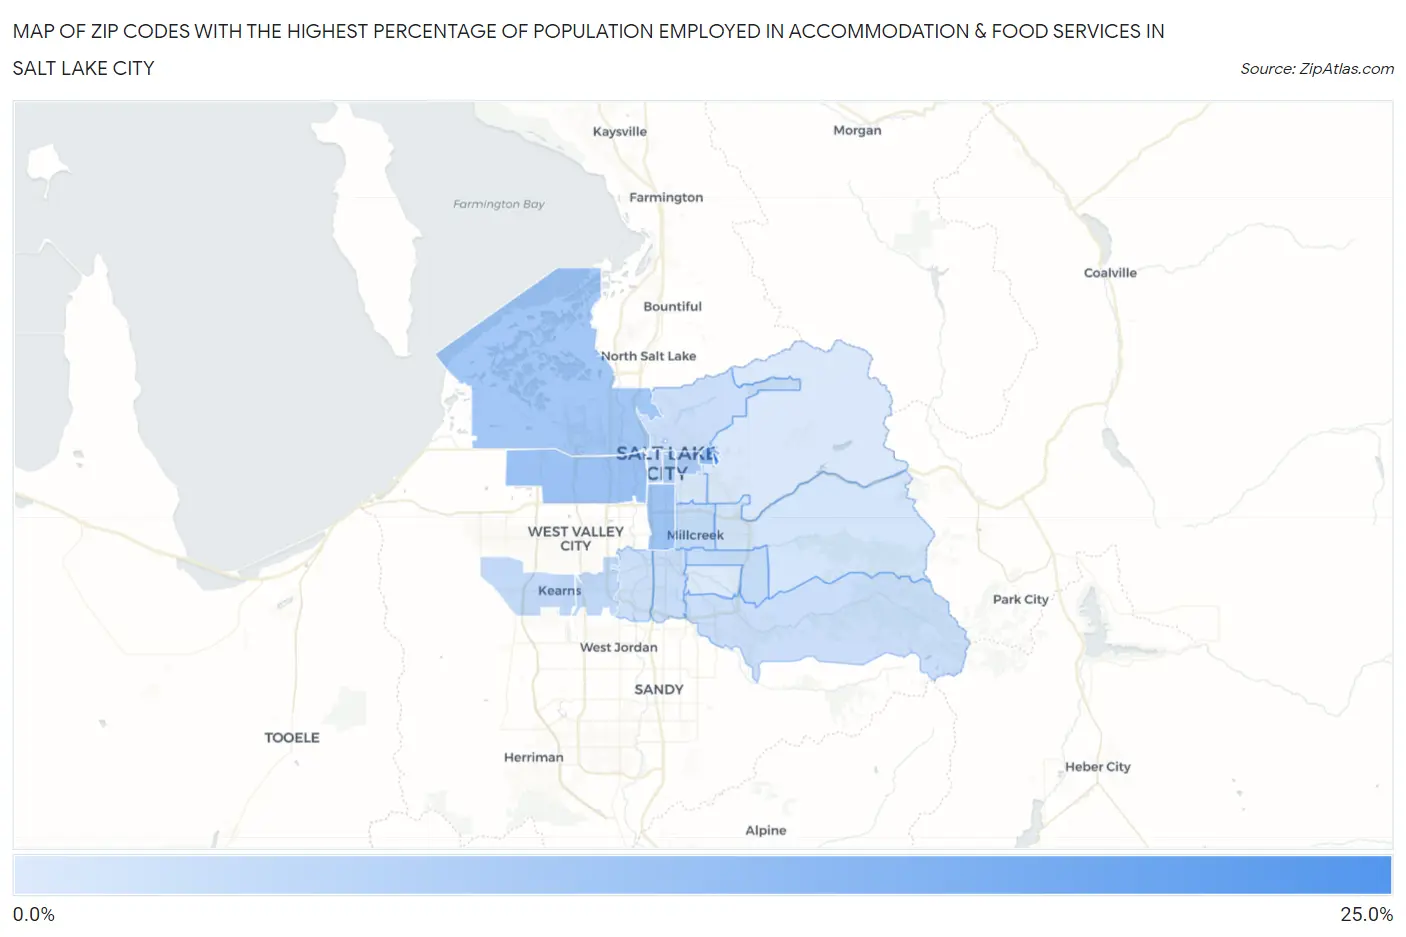
Map of Zip Codes with the Highest Percentage of Population Employed in Accommodation & Food Services in Salt Lake City
0.0%
25.0%
Zip Codes with the Highest Percentage of Population Employed in Accommodation & Food Services in Salt Lake City, UT
| Zip Code | % Employed | vs State | vs National | |
| 1. | 84113 | 21.9% | 6.1%(+15.8)#10 | 6.9%(+15.0)#681 |
| 2. | 84112 | 12.3% | 6.1%(+6.13)#28 | 6.9%(+5.37)#2,686 |
| 3. | 84104 | 10.9% | 6.1%(+4.75)#35 | 6.9%(+3.99)#3,663 |
| 4. | 84115 | 10.7% | 6.1%(+4.56)#36 | 6.9%(+3.80)#3,817 |
| 5. | 84116 | 10.2% | 6.1%(+4.05)#40 | 6.9%(+3.29)#4,338 |
| 6. | 84111 | 9.3% | 6.1%(+3.17)#48 | 6.9%(+2.41)#5,519 |
| 7. | 84102 | 8.8% | 6.1%(+2.67)#58 | 6.9%(+1.91)#6,305 |
| 8. | 84101 | 7.2% | 6.1%(+1.07)#85 | 6.9%(+0.306)#9,841 |
| 9. | 84129 | 6.6% | 6.1%(+0.521)#96 | 6.9%(-0.240)#11,389 |
| 10. | 84118 | 6.4% | 6.1%(+0.321)#105 | 6.9%(-0.441)#12,035 |
| 11. | 84106 | 5.9% | 6.1%(-0.211)#117 | 6.9%(-0.972)#13,746 |
| 12. | 84124 | 5.9% | 6.1%(-0.215)#118 | 6.9%(-0.977)#13,758 |
| 13. | 84107 | 5.6% | 6.1%(-0.531)#126 | 6.9%(-1.29)#14,744 |
| 14. | 84121 | 5.3% | 6.1%(-0.813)#133 | 6.9%(-1.57)#15,756 |
| 15. | 84103 | 5.3% | 6.1%(-0.824)#134 | 6.9%(-1.59)#15,801 |
| 16. | 84123 | 5.1% | 6.1%(-1.05)#143 | 6.9%(-1.81)#16,574 |
| 17. | 84109 | 4.2% | 6.1%(-1.90)#170 | 6.9%(-2.66)#19,436 |
| 18. | 84105 | 3.7% | 6.1%(-2.43)#188 | 6.9%(-3.19)#21,173 |
| 19. | 84108 | 3.6% | 6.1%(-2.54)#191 | 6.9%(-3.31)#21,537 |
| 20. | 84117 | 3.2% | 6.1%(-2.91)#202 | 6.9%(-3.67)#22,669 |
1
Common Questions
What are the Top 10 Zip Codes with the Highest Percentage of Population Employed in Accommodation & Food Services in Salt Lake City, UT?
Top 10 Zip Codes with the Highest Percentage of Population Employed in Accommodation & Food Services in Salt Lake City, UT are:
What zip code has the Highest Percentage of Population Employed in Accommodation & Food Services in Salt Lake City, UT?
84113 has the Highest Percentage of Population Employed in Accommodation & Food Services in Salt Lake City, UT with 21.9%.
What is the Percentage of Population Employed in Accommodation & Food Services in Salt Lake City, UT?
Percentage of Population Employed in Accommodation & Food Services in Salt Lake City is 7.4%.
What is the Percentage of Population Employed in Accommodation & Food Services in Utah?
Percentage of Population Employed in Accommodation & Food Services in Utah is 6.1%.
What is the Percentage of Population Employed in Accommodation & Food Services in the United States?
Percentage of Population Employed in Accommodation & Food Services in the United States is 6.9%.