Zip Codes with the Most Immigrants from Eastern Europe in Salt Lake City, UT

RELATED REPORTS & OPTIONS

Eastern Europe
Population
Families and Households
Female Fertility
Female Fertility (Unmarried)
Race (Community Size)
Race (Percentage)
Ancestry (Community Size)
AfghanAfricanAlbanianAmericanApacheArabArapahoArgentineanArmenianAssyrian / Chaldean / SyriacAustralianAustrianBangladeshiBasqueBelgianBhutaneseBlackfeetBolivianBrazilianBritishBulgarianBurmeseCajunCambodianCanadianCelticCentral AmericanCentral American IndianCherokeeCheyenneChileanChippewaChoctawColombianComancheCosta RicanCreeCroatianCubanCzechCzechoslovakianDanishDominicanDutchEastern EuropeanEcuadorianEgyptianEnglishEstonianEthiopianEuropeanFijianFilipinoFinnishFrenchFrench American IndianFrench CanadianGermanGhanaianGreekGuamanian / ChamorroGuatemalanHaitianHonduranHopiHungarianIcelanderIndian (Asian)IndonesianIranianIraqiIrishIroquoisIsraeliItalianJamaicanJapaneseJordanianKenyanKoreanLaotianLatvianLebaneseLiberianLithuanianLuxembourgerMacedonianMalaysianMalteseMexicanMexican American IndianMongolianMoroccanNative HawaiianNavajoNew ZealanderNicaraguanNigerianNorthern EuropeanNorwegianPaiutePakistaniPalestinianPanamanianPeruvianPolishPortuguesePotawatomiPuebloPuerto RicanRomanianRussianSalvadoranSamoanScandinavianScotch-IrishScottishSerbianShoshoneSiouxSlavicSlovakSloveneSomaliSouth AfricanSouth AmericanSouth American IndianSpaniardSpanishSpanish AmericanSpanish American IndianSri LankanSubsaharan AfricanSudaneseSwedishSwissSyrianThaiTlingit-HaidaTonganTrinidadian and TobagonianTurkishUgandanUkrainianUruguayanUteVenezuelanVietnameseWelshWest IndianYaquiYugoslavianZimbabwean
Ancestry (Percentage)
AfghanAfricanAlbanianAmericanApacheArabArapahoArgentineanArmenianAssyrian / Chaldean / SyriacAustralianAustrianBangladeshiBasqueBelgianBhutaneseBlackfeetBolivianBrazilianBritishBulgarianBurmeseCajunCambodianCanadianCelticCentral AmericanCentral American IndianCherokeeCheyenneChileanChippewaChoctawColombianComancheCosta RicanCreeCroatianCubanCzechCzechoslovakianDanishDominicanDutchEastern EuropeanEcuadorianEgyptianEnglishEstonianEthiopianEuropeanFijianFilipinoFinnishFrenchFrench American IndianFrench CanadianGermanGhanaianGreekGuamanian / ChamorroGuatemalanHaitianHonduranHopiHungarianIcelanderIndian (Asian)IndonesianIranianIraqiIrishIroquoisIsraeliItalianJamaicanJapaneseJordanianKenyanKoreanLaotianLatvianLebaneseLiberianLithuanianLuxembourgerMacedonianMalaysianMalteseMexicanMexican American IndianMongolianMoroccanNative HawaiianNavajoNew ZealanderNicaraguanNigerianNorthern EuropeanNorwegianPaiutePakistaniPalestinianPanamanianPeruvianPolishPortuguesePotawatomiPuebloPuerto RicanRomanianRussianSalvadoranSamoanScandinavianScotch-IrishScottishSerbianShoshoneSiouxSlavicSlovakSloveneSomaliSouth AfricanSouth AmericanSouth American IndianSpaniardSpanishSpanish AmericanSpanish American IndianSri LankanSubsaharan AfricanSudaneseSwedishSwissSyrianThaiTlingit-HaidaTonganTrinidadian and TobagonianTurkishUgandanUkrainianUruguayanUteVenezuelanVietnameseWelshWest IndianYaquiYugoslavianZimbabwean
Immigrant Origin (Total)
AfghanistanAfricaArgentinaArmeniaAsiaAustraliaAustriaBangladeshBelarusBelgiumBoliviaBosnia and HerzegovinaBrazilBulgariaBurma / MyanmarCambodiaCanadaCaribbeanCentral AmericaChileChinaColombiaCongoCosta RicaCroatiaCubaCzechoslovakiaDenmarkDominican RepublicEastern AfricaEastern AsiaEastern EuropeEcuadorEgyptEl SalvadorEnglandEthiopiaEuropeFijiFranceGermanyGhanaGreeceGuatemalaHaitiHondurasHong KongHungaryIndiaIndonesiaIranIraqIrelandIsraelItalyJamaicaJapanJordanKazakhstanKenyaKoreaKuwaitLaosLatin AmericaLebanonLiberiaMalaysiaMexicoMicronesiaMiddle AfricaMoldovaMoroccoNepalNetherlandsNicaraguaNigeriaNorthern AfricaNorthern EuropeNorwayOceaniaPakistanPeruPhilippinesPolandPortugalRomaniaRussiaSaudi ArabiaScotlandSerbiaSierra LeoneSingaporeSomaliaSouth AfricaSouth AmericaSouth Central AsiaSouth Eastern AsiaSouthern EuropeSpainSri LankaSudanSwedenSwitzerlandSyriaTaiwanThailandTurkeyUgandaUkraineUruguayVenezuelaVietnamWestern AfricaWestern AsiaWestern EuropeZaireZimbabwe
Immigrant Origin (Percentage)
AfghanistanAfricaArgentinaArmeniaAsiaAustraliaAustriaBangladeshBelarusBelgiumBoliviaBosnia and HerzegovinaBrazilBulgariaBurma / MyanmarCambodiaCanadaCaribbeanCentral AmericaChileChinaColombiaCongoCosta RicaCroatiaCubaCzechoslovakiaDenmarkDominican RepublicEastern AfricaEastern AsiaEastern EuropeEcuadorEgyptEl SalvadorEnglandEthiopiaEuropeFijiFranceGermanyGhanaGreeceGuatemalaHaitiHondurasHong KongHungaryIndiaIndonesiaIranIraqIrelandIsraelItalyJamaicaJapanJordanKazakhstanKenyaKoreaKuwaitLaosLatin AmericaLebanonLiberiaMalaysiaMexicoMicronesiaMiddle AfricaMoldovaMoroccoNepalNetherlandsNicaraguaNigeriaNorthern AfricaNorthern EuropeNorwayOceaniaPakistanPeruPhilippinesPolandPortugalRomaniaRussiaSaudi ArabiaScotlandSerbiaSierra LeoneSingaporeSomaliaSouth AfricaSouth AmericaSouth Central AsiaSouth Eastern AsiaSouthern EuropeSpainSri LankaSudanSwedenSwitzerlandSyriaTaiwanThailandTurkeyUgandaUkraineUruguayVenezuelaVietnamWestern AfricaWestern AsiaWestern EuropeZaireZimbabwe
Income
Income (Families)
Income (Households)
Poverty
Poverty (Families)
Unemployment
Employment Occupations
Employment Industries
Employer Class
Commute Time
Commute Means
School Enrollment
Education by Degree Field
Occupancy
Finances
Physical Characteristics
Salt Lake City
Compare Zip Codes
Comparison Subject

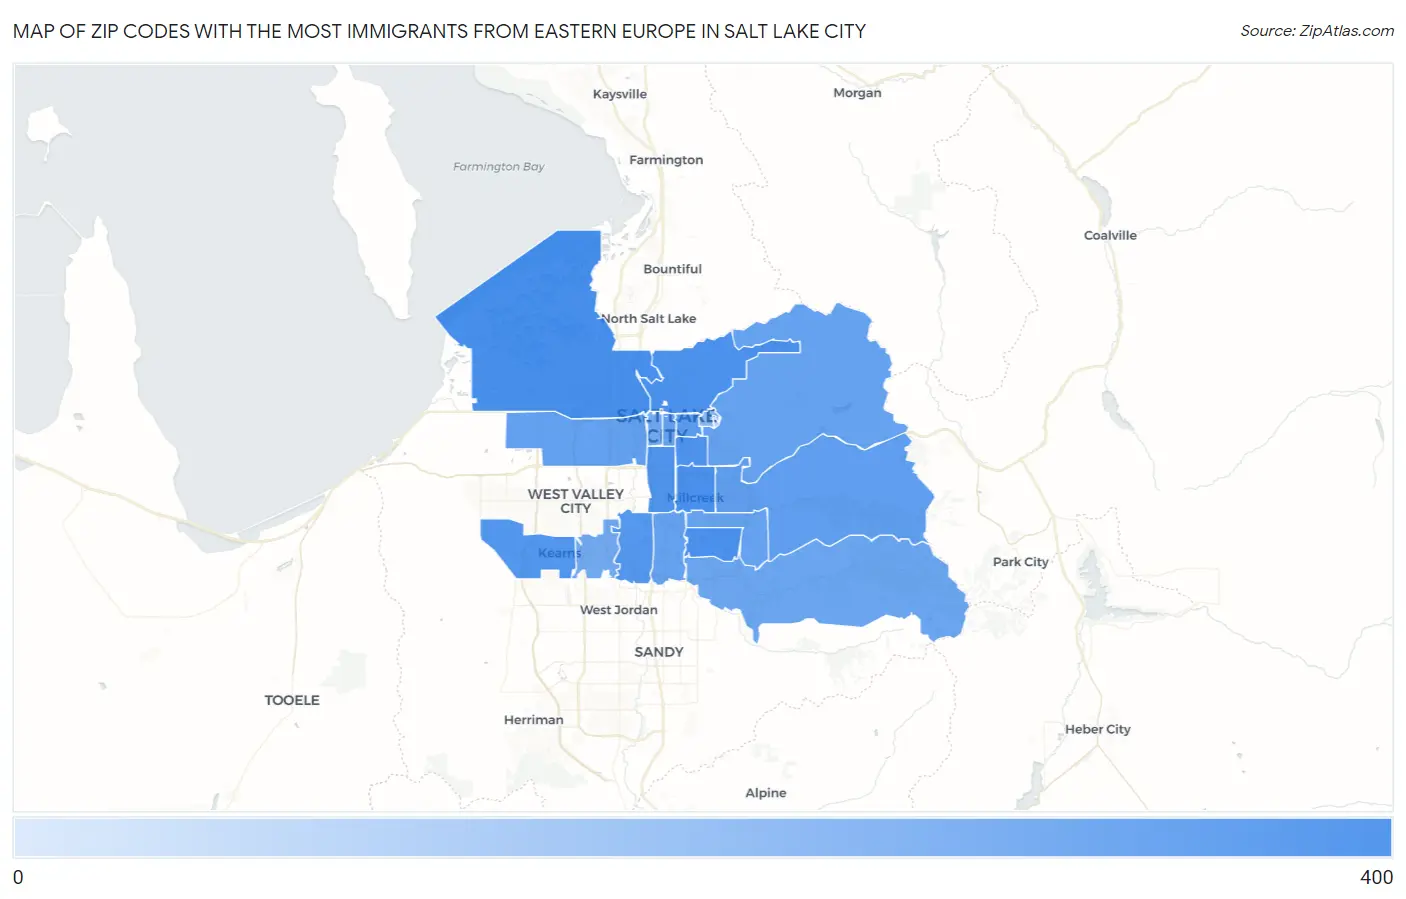
Map of Zip Codes with the Most Immigrants from Eastern Europe in Salt Lake City

0
400
Zip Codes with the Most Immigrants from Eastern Europe in Salt Lake City Map

Zip Codes with the Most Immigrants from Eastern Europe in Salt Lake City, UT

Zip Code Eastern Europe vs State vs National
1.841163099,003(3.43%)#52,208,794(0.01%)#1,774
2.841062889,003(3.20%)#62,208,794(0.01%)#1,902
3.841172769,003(3.07%)#82,208,794(0.01%)#1,996
4.841032619,003(2.90%)#92,208,794(0.01%)#2,114
5.841052309,003(2.55%)#112,208,794(0.01%)#2,361
6.841152159,003(2.39%)#132,208,794(0.01%)#2,521
7.841181959,003(2.17%)#162,208,794(0.01%)#2,746
8.841231779,003(1.97%)#192,208,794(0.01%)#2,972
9.841021549,003(1.71%)#212,208,794(0.01%)#3,333
10.841091219,003(1.34%)#282,208,794(0.01%)#3,944
11.841041029,003(1.13%)#302,208,794(0.00%)#4,397
12.84108979,003(1.08%)#322,208,794(0.00%)#4,521
13.84111969,003(1.07%)#332,208,794(0.00%)#4,561
14.84107949,003(1.04%)#342,208,794(0.00%)#4,599
15.84124949,003(1.04%)#352,208,794(0.00%)#4,607
16.84121749,003(0.82%)#402,208,794(0.00%)#5,218
17.84101659,003(0.72%)#452,208,794(0.00%)#5,563
18.84129569,003(0.62%)#482,208,794(0.00%)#5,937
19.84112249,003(0.27%)#642,208,794(0.00%)#8,131
20.8411359,003(0.06%)#922,208,794(0.00%)#11,646

Common Questions

What are the Top 10 Zip Codes with the Most Immigrants from Eastern Europe in Salt Lake City, UT?
Top 10 Zip Codes with the Most Immigrants from Eastern Europe in Salt Lake City, UT are:
#1
309
#2
288
#3
276
#4
261
#5
230
#6
215
#7
195
#8
177
#9
154
#10
121
What zip code has the Most Immigrants from Eastern Europe in Salt Lake City, UT?
84116 has the Most Immigrants from Eastern Europe in Salt Lake City, UT with 309.
What is the Total Immigrants from Eastern Europe in Salt Lake City, UT?
Total Immigrants from Eastern Europe in Salt Lake City is 1,638.
What is the Total Immigrants from Eastern Europe in Utah?
Total Immigrants from Eastern Europe in Utah is 9,003.
What is the Total Immigrants from Eastern Europe in the United States?
Total Immigrants from Eastern Europe in the United States is 2,208,794.