Zip Codes with the Highest Percentage of Population Employed in Food Preparation & Serving in Logan, UT
RELATED REPORTS & OPTIONS
Food Preparation & Serving
Logan
Compare Zip Codes
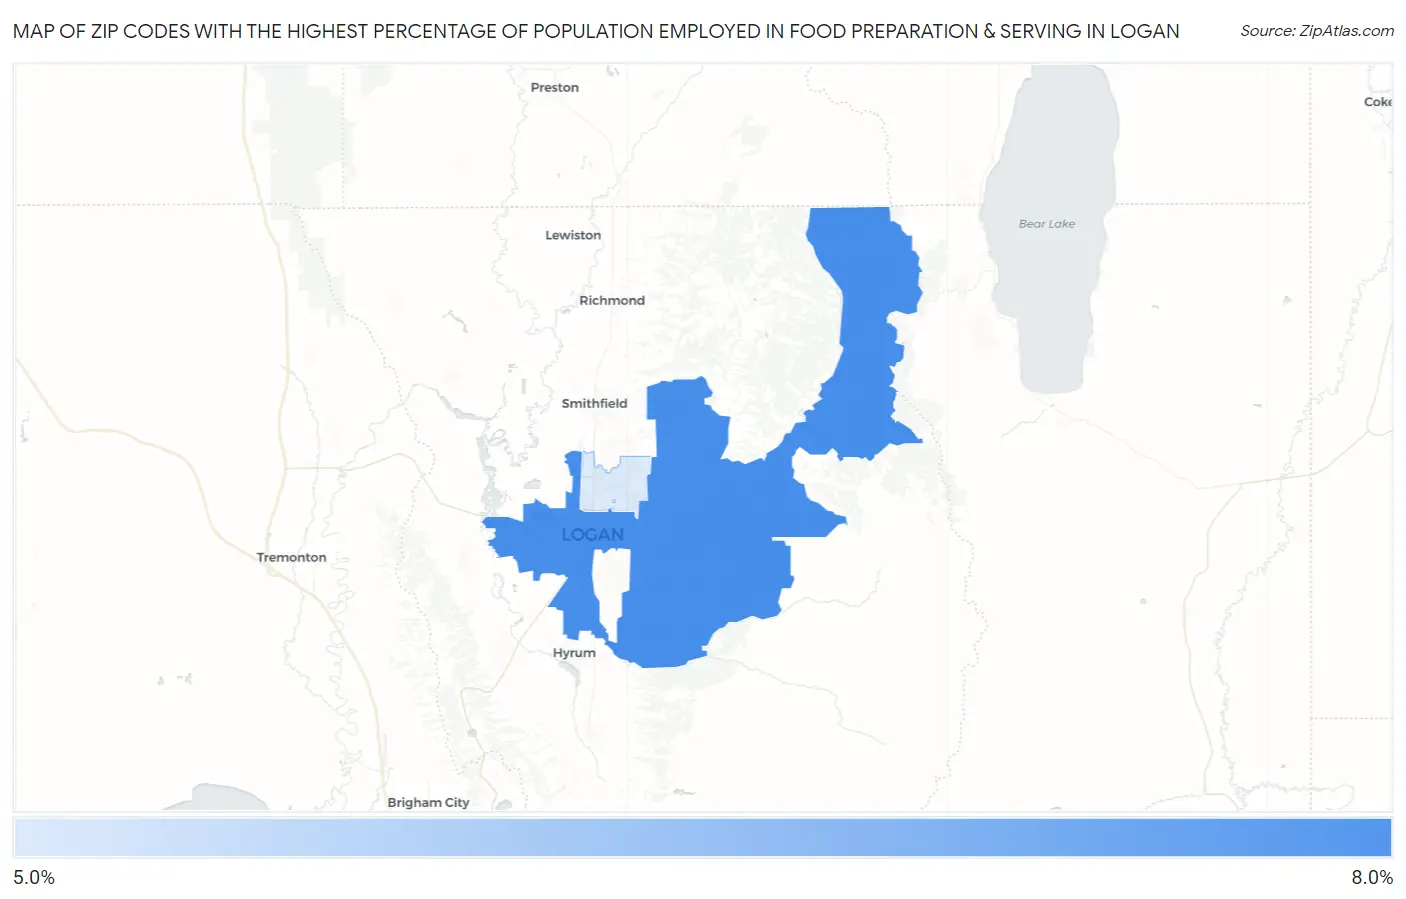
Map of Zip Codes with the Highest Percentage of Population Employed in Food Preparation & Serving in Logan
0.0%
8.0%
Zip Codes with the Highest Percentage of Population Employed in Food Preparation & Serving in Logan, UT
| Zip Code | % Employed | vs State | vs National | |
| 1. | 84321 | 6.9% | 4.5%(+2.40)#47 | 5.3%(+1.65)#6,718 |
| 2. | 84341 | 5.3% | 4.5%(+0.793)#76 | 5.3%(+0.045)#11,650 |
1
Common Questions
What are the Top Zip Codes with the Highest Percentage of Population Employed in Food Preparation & Serving in Logan, UT?
Top Zip Codes with the Highest Percentage of Population Employed in Food Preparation & Serving in Logan, UT are:
What zip code has the Highest Percentage of Population Employed in Food Preparation & Serving in Logan, UT?
84321 has the Highest Percentage of Population Employed in Food Preparation & Serving in Logan, UT with 6.9%.
What is the Percentage of Population Employed in Food Preparation & Serving in Logan, UT?
Percentage of Population Employed in Food Preparation & Serving in Logan is 7.0%.
What is the Percentage of Population Employed in Food Preparation & Serving in Utah?
Percentage of Population Employed in Food Preparation & Serving in Utah is 4.5%.
What is the Percentage of Population Employed in Food Preparation & Serving in the United States?
Percentage of Population Employed in Food Preparation & Serving in the United States is 5.3%.