Puget Sound Salish vs Spanish American Unemployment Among Women with Children Ages 6 to 17 years

COMPARE

Puget Sound Salish
Race
Ancestry
AfghanAfricanAlaska NativeAlaskan AthabascanAlbanianAleutAlsatianAmericanApacheArabArapahoArgentineanArmenianAssyrian/Chaldean/SyriacAustralianAustrianBahamianBangladeshiBarbadianBasqueBelgianBelizeanBermudanBhutaneseBlackfeetBolivianBrazilianBritishBritish West IndianBulgarianBurmeseCajunCambodianCanadianCape VerdeanCarpatho RusynCelticCentral AmericanCentral American IndianCherokeeCheyenneChickasawChileanChineseChippewaChoctawColombianColvilleComancheCosta RicanCreeCreekCroatianCrowCubanCypriotCzechCzechoslovakianDanishDelawareDominicanDutchDutch West IndianEastern EuropeanEcuadorianEgyptianEnglishEstonianEthiopianEuropeanFijianFilipinoFinnishFrenchFrench American IndianFrench CanadianGermanGerman RussianGhanaianGreekGuamanian/ChamorroGuatemalanGuyaneseHaitianHmongHonduranHopiHoumaHungarianIcelanderIndian (Asian)IndonesianInupiatIranianIraqiIrishIroquoisIsraeliItalianJamaicanJapaneseJordanianKenyanKiowaKoreanLaotianLatvianLebaneseLiberianLithuanianLumbeeLuxembourgerMacedonianMalaysianMalteseMarshalleseMenomineeMexicanMexican American IndianMongolianMoroccanNative HawaiianNavajoNepaleseNew ZealanderNicaraguanNigerianNorthern EuropeanNorwegianOkinawanOsageOttawaPaiutePakistaniPalestinianPanamanianParaguayanPennsylvania GermanPeruvianPimaPolishPortuguesePotawatomiPuebloPuerto RicanPuget Sound SalishRomanianRussianSalvadoranSamoanScandinavianScotch-IrishScottishSeminoleSenegaleseSerbianShoshoneSierra LeoneanSiouxSlavicSlovakSloveneSomaliSouth AfricanSouth AmericanSouth American IndianSoviet UnionSpaniardSpanishSpanish American IndianSri LankanSubsaharan AfricanSudaneseSwedishSwissSyrianTaiwaneseThaiTlingit-HaidaTohono O'OdhamTonganTrinidadian and TobagonianTsimshianTurkishU.S. Virgin IslanderUgandanUkrainianUruguayanUteVenezuelanVietnameseWelshWest IndianYakamaYaquiYugoslavianYumanYup'ikZimbabwean
Immigration
NonimmigrantsImmigrantsAfghanistanAfricaAlbaniaArgentinaArmeniaAsiaAustraliaAustriaBahamasBangladeshBarbadosBelarusBelgiumBelizeBoliviaBosnia and HerzegovinaBrazilBulgariaBurma/MyanmarCabo VerdeCambodiaCameroonCanadaCaribbeanCentral AmericaChileChinaColombiaCongoCosta RicaCroatiaCubaCzechoslovakiaDenmarkDominicaDominican RepublicEastern AfricaEastern AsiaEastern EuropeEcuadorEgyptEl SalvadorEnglandEritreaEthiopiaEuropeFijiFranceGermanyGhanaGreeceGrenadaGuatemalaGuyanaHaitiHondurasHong KongHungaryIndiaIndonesiaIranIraqIrelandIsraelItalyJamaicaJapanJordanKazakhstanKenyaKoreaKuwaitLaosLatin AmericaLatviaLebanonLiberiaLithuaniaMalaysiaMexicoMicronesiaMiddle AfricaMoldovaMoroccoNepalNetherlandsNicaraguaNigeriaNorth AmericaNorth MacedoniaNorthern AfricaNorthern EuropeNorwayOceaniaPakistanPanamaPeruPhilippinesPolandPortugalRomaniaRussiaSaudi ArabiaScotlandSenegalSerbiaSierra LeoneSingaporeSomaliaSouth AfricaSouth AmericaSouth Central AsiaSouth Eastern AsiaSouthern EuropeSpainSri LankaSt. Vincent and the GrenadinesSudanSwedenSwitzerlandSyriaTaiwanThailandTrinidad and TobagoTurkeyUgandaUkraineUruguayUzbekistanVenezuelaVietnamWest IndiesWestern AfricaWestern AsiaWestern EuropeYemenZaireZimbabweAzores
Spanish American
Race
Ancestry
AfghanAfricanAlaska NativeAlaskan AthabascanAlbanianAleutAlsatianAmericanApacheArabArapahoArgentineanArmenianAssyrian/Chaldean/SyriacAustralianAustrianBahamianBangladeshiBarbadianBasqueBelgianBelizeanBermudanBhutaneseBlackfeetBolivianBrazilianBritishBritish West IndianBulgarianBurmeseCajunCambodianCanadianCape VerdeanCarpatho RusynCelticCentral AmericanCentral American IndianCherokeeCheyenneChickasawChileanChineseChippewaChoctawColombianColvilleComancheCosta RicanCreeCreekCroatianCrowCubanCypriotCzechCzechoslovakianDanishDelawareDominicanDutchDutch West IndianEastern EuropeanEcuadorianEgyptianEnglishEstonianEthiopianEuropeanFijianFilipinoFinnishFrenchFrench American IndianFrench CanadianGermanGerman RussianGhanaianGreekGuamanian/ChamorroGuatemalanGuyaneseHaitianHmongHonduranHopiHoumaHungarianIcelanderIndian (Asian)IndonesianInupiatIranianIraqiIrishIroquoisIsraeliItalianJamaicanJapaneseJordanianKenyanKiowaKoreanLaotianLatvianLebaneseLiberianLithuanianLumbeeLuxembourgerMacedonianMalaysianMalteseMarshalleseMenomineeMexicanMexican American IndianMongolianMoroccanNative HawaiianNavajoNepaleseNew ZealanderNicaraguanNigerianNorthern EuropeanNorwegianOkinawanOsageOttawaPaiutePakistaniPalestinianPanamanianParaguayanPennsylvania GermanPeruvianPimaPolishPortuguesePotawatomiPuebloPuerto RicanRomanianRussianSalvadoranSamoanScandinavianScotch-IrishScottishSeminoleSenegaleseSerbianShoshoneSierra LeoneanSiouxSlavicSlovakSloveneSomaliSouth AfricanSouth AmericanSouth American IndianSoviet UnionSpaniardSpanishSpanish AmericanSpanish American IndianSri LankanSubsaharan AfricanSudaneseSwedishSwissSyrianTaiwaneseThaiTlingit-HaidaTohono O'OdhamTonganTrinidadian and TobagonianTsimshianTurkishU.S. Virgin IslanderUgandanUkrainianUruguayanUteVenezuelanVietnameseWelshWest IndianYakamaYaquiYugoslavianYumanYup'ikZimbabwean
Immigration
NonimmigrantsImmigrantsAfghanistanAfricaAlbaniaArgentinaArmeniaAsiaAustraliaAustriaBahamasBangladeshBarbadosBelarusBelgiumBelizeBoliviaBosnia and HerzegovinaBrazilBulgariaBurma/MyanmarCabo VerdeCambodiaCameroonCanadaCaribbeanCentral AmericaChileChinaColombiaCongoCosta RicaCroatiaCubaCzechoslovakiaDenmarkDominicaDominican RepublicEastern AfricaEastern AsiaEastern EuropeEcuadorEgyptEl SalvadorEnglandEritreaEthiopiaEuropeFijiFranceGermanyGhanaGreeceGrenadaGuatemalaGuyanaHaitiHondurasHong KongHungaryIndiaIndonesiaIranIraqIrelandIsraelItalyJamaicaJapanJordanKazakhstanKenyaKoreaKuwaitLaosLatin AmericaLatviaLebanonLiberiaLithuaniaMalaysiaMexicoMicronesiaMiddle AfricaMoldovaMoroccoNepalNetherlandsNicaraguaNigeriaNorth AmericaNorth MacedoniaNorthern AfricaNorthern EuropeNorwayOceaniaPakistanPanamaPeruPhilippinesPolandPortugalRomaniaRussiaSaudi ArabiaScotlandSenegalSerbiaSierra LeoneSingaporeSomaliaSouth AfricaSouth AmericaSouth Central AsiaSouth Eastern AsiaSouthern EuropeSpainSri LankaSt. Vincent and the GrenadinesSudanSwedenSwitzerlandSyriaTaiwanThailandTrinidad and TobagoTurkeyUgandaUkraineUruguayUzbekistanVenezuelaVietnamWest IndiesWestern AfricaWestern AsiaWestern EuropeYemenZaireZimbabweAzores
Unemployment Among Women with Children Ages 6 to 17 years
Income
Poverty
Unemployment
Labor Participation
Family Structure
Vehicle Availability
Education Level
Disability

Unemployment Among Women with Children Ages 6 to 17 years Comparison

Puget Sound Salish

Spanish Americans

Exceptional
Exceptional
7.5%
UNEMPLOYMENT AMONG WOMEN WITH CHILDREN AGES 6 TO 17 YEARS
100.0/ 100
METRIC RATING
15th/ 347
METRIC RANK
8.4%
UNEMPLOYMENT AMONG WOMEN WITH CHILDREN AGES 6 TO 17 YEARS
99.8/ 100
METRIC RATING
73rd/ 347
METRIC RANK

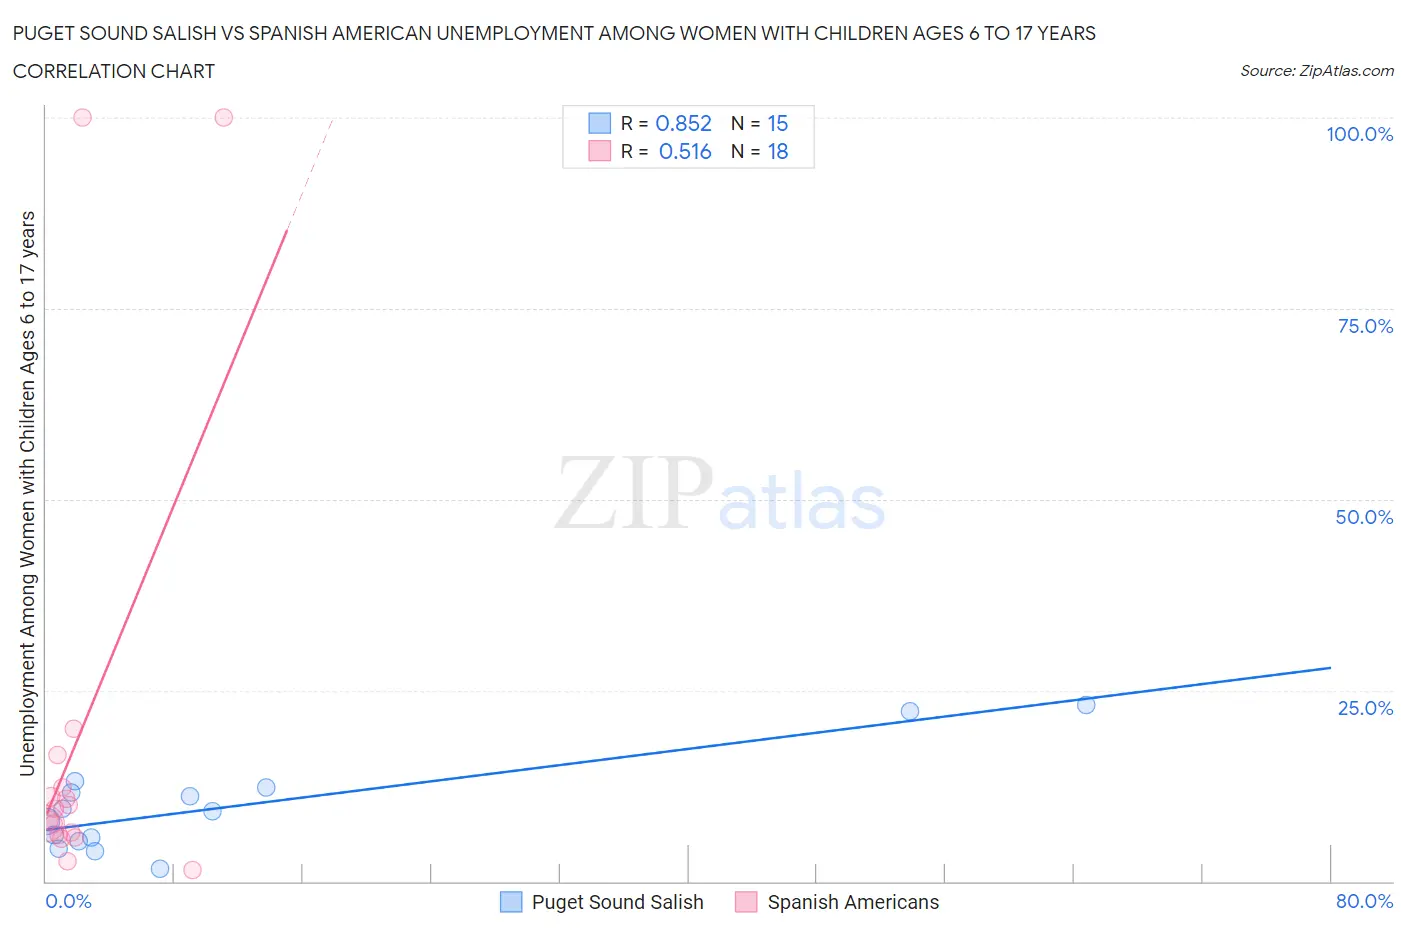
Puget Sound Salish vs Spanish American Unemployment Among Women with Children Ages 6 to 17 years Correlation Chart

The statistical analysis conducted on geographies consisting of 40,323,487 people shows a very strong positive correlation between the proportion of Puget Sound Salish and unemployment rate among women with children between the ages 6 and 17 in the United States with a correlation coefficient (R) of 0.852 and weighted average of 7.5%. Similarly, the statistical analysis conducted on geographies consisting of 92,309,003 people shows a substantial positive correlation between the proportion of Spanish Americans and unemployment rate among women with children between the ages 6 and 17 in the United States with a correlation coefficient (R) of 0.516 and weighted average of 8.4%, a difference of 11.6%.
Puget Sound Salish vs Spanish American Unemployment Among Women with Children Ages 6 to 17 years

Unemployment Among Women with Children Ages 6 to 17 years Correlation Summary

MeasurementPuget Sound SalishSpanish American
Minimum1.7%1.4%
Maximum23.1%100.0%
Range21.4%98.6%
Mean9.8%18.9%
Median9.1%8.7%
Interquartile 25% (IQ1)5.2%6.0%
Interquartile 75% (IQ3)12.2%12.2%
Interquartile Range (IQR)7.0%6.2%
Standard Deviation (Sample)6.2%29.8%
Standard Deviation (Population)6.0%29.0%

Similar Demographics by Unemployment Among Women with Children Ages 6 to 17 years

Demographics Similar to Puget Sound Salish by Unemployment Among Women with Children Ages 6 to 17 years

In terms of unemployment among women with children ages 6 to 17 years, the demographic groups most similar to Puget Sound Salish are Immigrants from Burma/Myanmar (7.5%, a difference of 0.36%), Cambodian (7.5%, a difference of 0.54%), Sudanese (7.4%, a difference of 1.1%), Indonesian (7.4%, a difference of 1.1%), and Afghan (7.6%, a difference of 1.2%).
DemographicsRating | RankUnemployment Among Women with Children Ages 6 to 17 years
Immigrants | Hong Kong
100.0
/100
|
#8
Exceptional
7.2%
Assyrians/Chaldeans/Syriacs
100.0
/100
|
#9
Exceptional
7.2%
Immigrants | Fiji
100.0
/100
|
#10
Exceptional
7.3%
Immigrants | Taiwan
100.0
/100
|
#11
Exceptional
7.3%
Bangladeshis
100.0
/100
|
#12
Exceptional
7.4%
Indonesians
100.0
/100
|
#13
Exceptional
7.4%
Sudanese
100.0
/100
|
#14
Exceptional
7.4%
Puget Sound Salish
100.0
/100
|
#15
Exceptional
7.5%
Immigrants | Burma/Myanmar
100.0
/100
|
#16
Exceptional
7.5%
Cambodians
100.0
/100
|
#17
Exceptional
7.5%
Afghans
100.0
/100
|
#18
Exceptional
7.6%
Filipinos
100.0
/100
|
#19
Exceptional
7.6%
Immigrants | Singapore
100.0
/100
|
#20
Exceptional
7.7%
Immigrants | India
100.0
/100
|
#21
Exceptional
7.7%
Immigrants | China
100.0
/100
|
#22
Exceptional
7.7%

Demographics Similar to Spanish Americans by Unemployment Among Women with Children Ages 6 to 17 years

In terms of unemployment among women with children ages 6 to 17 years, the demographic groups most similar to Spanish Americans are Samoan (8.4%, a difference of 0.35%), Immigrants from Nepal (8.3%, a difference of 0.38%), Immigrants from Australia (8.3%, a difference of 0.41%), Immigrants from Sri Lanka (8.4%, a difference of 0.43%), and Immigrants from Moldova (8.4%, a difference of 0.46%).
DemographicsRating | RankUnemployment Among Women with Children Ages 6 to 17 years
Luxembourgers
99.9
/100
|
#66
Exceptional
8.3%
Armenians
99.9
/100
|
#67
Exceptional
8.3%
Marshallese
99.9
/100
|
#68
Exceptional
8.3%
Immigrants | Thailand
99.9
/100
|
#69
Exceptional
8.3%
Norwegians
99.9
/100
|
#70
Exceptional
8.3%
Immigrants | Australia
99.8
/100
|
#71
Exceptional
8.3%
Immigrants | Nepal
99.8
/100
|
#72
Exceptional
8.3%
Spanish Americans
99.8
/100
|
#73
Exceptional
8.4%
Samoans
99.7
/100
|
#74
Exceptional
8.4%
Immigrants | Sri Lanka
99.7
/100
|
#75
Exceptional
8.4%
Immigrants | Moldova
99.7
/100
|
#76
Exceptional
8.4%
Iraqis
99.7
/100
|
#77
Exceptional
8.4%
Pakistanis
99.6
/100
|
#78
Exceptional
8.4%
Mongolians
99.6
/100
|
#79
Exceptional
8.4%
Immigrants | Belarus
99.6
/100
|
#80
Exceptional
8.4%