Immigrants from Western Europe vs Immigrants from Mexico Unemployment Among Women with Children Ages 6 to 17 years
COMPARE
Immigrants from Western Europe
Immigrants from Mexico
Unemployment Among Women with Children Ages 6 to 17 years
Unemployment Among Women with Children Ages 6 to 17 years Comparison
Immigrants from Western Europe
Immigrants from Mexico
9.1%
UNEMPLOYMENT AMONG WOMEN WITH CHILDREN AGES 6 TO 17 YEARS
14.1/ 100
METRIC RATING
205th/ 347
METRIC RANK
9.5%
UNEMPLOYMENT AMONG WOMEN WITH CHILDREN AGES 6 TO 17 YEARS
0.7/ 100
METRIC RATING
258th/ 347
METRIC RANK
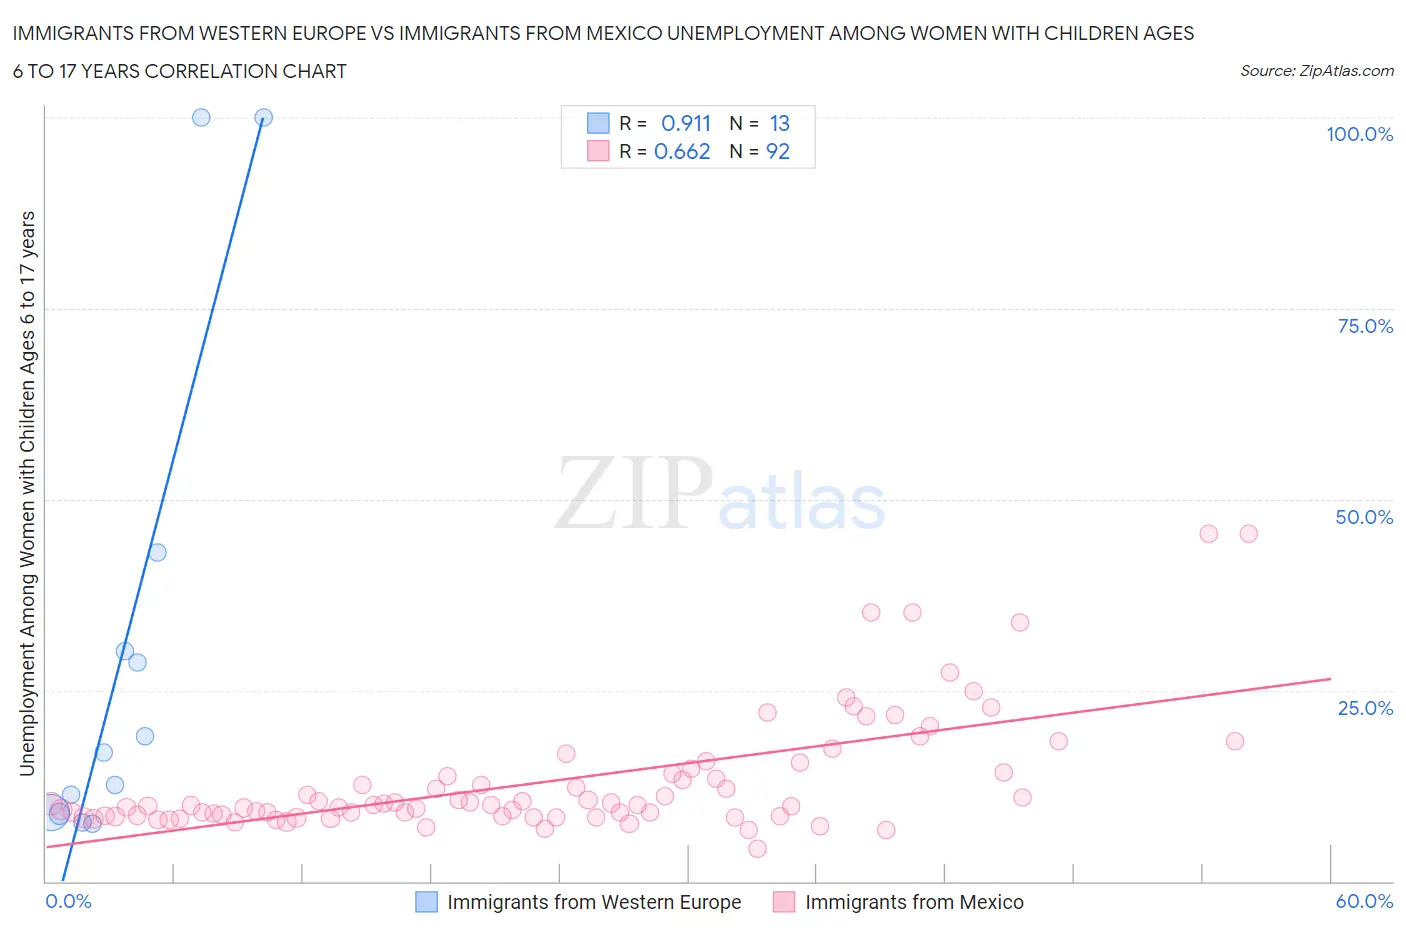
Immigrants from Western Europe vs Immigrants from Mexico Unemployment Among Women with Children Ages 6 to 17 years Correlation Chart
The statistical analysis conducted on geographies consisting of 331,705,739 people shows a near-perfect positive correlation between the proportion of Immigrants from Western Europe and unemployment rate among women with children between the ages 6 and 17 in the United States with a correlation coefficient (R) of 0.911 and weighted average of 9.1%. Similarly, the statistical analysis conducted on geographies consisting of 342,553,343 people shows a significant positive correlation between the proportion of Immigrants from Mexico and unemployment rate among women with children between the ages 6 and 17 in the United States with a correlation coefficient (R) of 0.662 and weighted average of 9.5%, a difference of 3.4%.
Unemployment Among Women with Children Ages 6 to 17 years Correlation Summary
| Measurement | Immigrants from Western Europe | Immigrants from Mexico |
| Minimum | 7.5% | 4.2% |
| Maximum | 100.0% | 45.5% |
| Range | 92.5% | 41.3% |
| Mean | 30.4% | 13.1% |
| Median | 16.8% | 10.0% |
| Interquartile 25% (IQ1) | 8.9% | 8.5% |
| Interquartile 75% (IQ3) | 36.5% | 14.2% |
| Interquartile Range (IQR) | 27.6% | 5.7% |
| Standard Deviation (Sample) | 32.7% | 7.9% |
| Standard Deviation (Population) | 31.4% | 7.9% |
Similar Demographics by Unemployment Among Women with Children Ages 6 to 17 years
Demographics Similar to Immigrants from Western Europe by Unemployment Among Women with Children Ages 6 to 17 years
In terms of unemployment among women with children ages 6 to 17 years, the demographic groups most similar to Immigrants from Western Europe are Immigrants from Canada (9.1%, a difference of 0.10%), Maltese (9.1%, a difference of 0.11%), Immigrants from Middle Africa (9.1%, a difference of 0.13%), Immigrants from North America (9.2%, a difference of 0.13%), and Immigrants from Trinidad and Tobago (9.1%, a difference of 0.22%).
| Demographics | Rating | Rank | Unemployment Among Women with Children Ages 6 to 17 years |
| Guyanese | 21.8 /100 | #198 | Fair 9.1% |
| Czechoslovakians | 20.8 /100 | #199 | Fair 9.1% |
| Trinidadians and Tobagonians | 18.2 /100 | #200 | Poor 9.1% |
| Immigrants | Trinidad and Tobago | 16.7 /100 | #201 | Poor 9.1% |
| Immigrants | Middle Africa | 15.6 /100 | #202 | Poor 9.1% |
| Maltese | 15.3 /100 | #203 | Poor 9.1% |
| Immigrants | Canada | 15.3 /100 | #204 | Poor 9.1% |
| Immigrants | Western Europe | 14.1 /100 | #205 | Poor 9.1% |
| Immigrants | North America | 12.7 /100 | #206 | Poor 9.2% |
| Cubans | 10.9 /100 | #207 | Poor 9.2% |
| Immigrants | Peru | 10.8 /100 | #208 | Poor 9.2% |
| Salvadorans | 10.7 /100 | #209 | Poor 9.2% |
| Finns | 10.0 /100 | #210 | Tragic 9.2% |
| Immigrants | Cuba | 9.6 /100 | #211 | Tragic 9.2% |
| Peruvians | 9.0 /100 | #212 | Tragic 9.2% |
Demographics Similar to Immigrants from Mexico by Unemployment Among Women with Children Ages 6 to 17 years
In terms of unemployment among women with children ages 6 to 17 years, the demographic groups most similar to Immigrants from Mexico are Celtic (9.5%, a difference of 0.090%), Immigrants from Central America (9.5%, a difference of 0.090%), Canadian (9.4%, a difference of 0.11%), Italian (9.5%, a difference of 0.21%), and Lithuanian (9.4%, a difference of 0.28%).
| Demographics | Rating | Rank | Unemployment Among Women with Children Ages 6 to 17 years |
| Central Americans | 1.3 /100 | #251 | Tragic 9.4% |
| Creek | 1.2 /100 | #252 | Tragic 9.4% |
| Portuguese | 1.1 /100 | #253 | Tragic 9.4% |
| Nicaraguans | 1.0 /100 | #254 | Tragic 9.4% |
| Lithuanians | 0.9 /100 | #255 | Tragic 9.4% |
| Canadians | 0.8 /100 | #256 | Tragic 9.4% |
| Celtics | 0.7 /100 | #257 | Tragic 9.5% |
| Immigrants | Mexico | 0.7 /100 | #258 | Tragic 9.5% |
| Immigrants | Central America | 0.6 /100 | #259 | Tragic 9.5% |
| Italians | 0.6 /100 | #260 | Tragic 9.5% |
| South Americans | 0.5 /100 | #261 | Tragic 9.5% |
| Senegalese | 0.5 /100 | #262 | Tragic 9.5% |
| Lebanese | 0.5 /100 | #263 | Tragic 9.5% |
| Immigrants | Ghana | 0.4 /100 | #264 | Tragic 9.5% |
| West Indians | 0.4 /100 | #265 | Tragic 9.5% |