Immigrants from Nigeria vs Pennsylvania German Unemployment Among Women with Children Ages 6 to 17 years
COMPARE
Immigrants from Nigeria
Pennsylvania German
Unemployment Among Women with Children Ages 6 to 17 years
Unemployment Among Women with Children Ages 6 to 17 years Comparison
Immigrants from Nigeria
Pennsylvania Germans
10.2%
UNEMPLOYMENT AMONG WOMEN WITH CHILDREN AGES 6 TO 17 YEARS
0.0/ 100
METRIC RATING
305th/ 347
METRIC RANK
11.0%
UNEMPLOYMENT AMONG WOMEN WITH CHILDREN AGES 6 TO 17 YEARS
0.0/ 100
METRIC RATING
329th/ 347
METRIC RANK
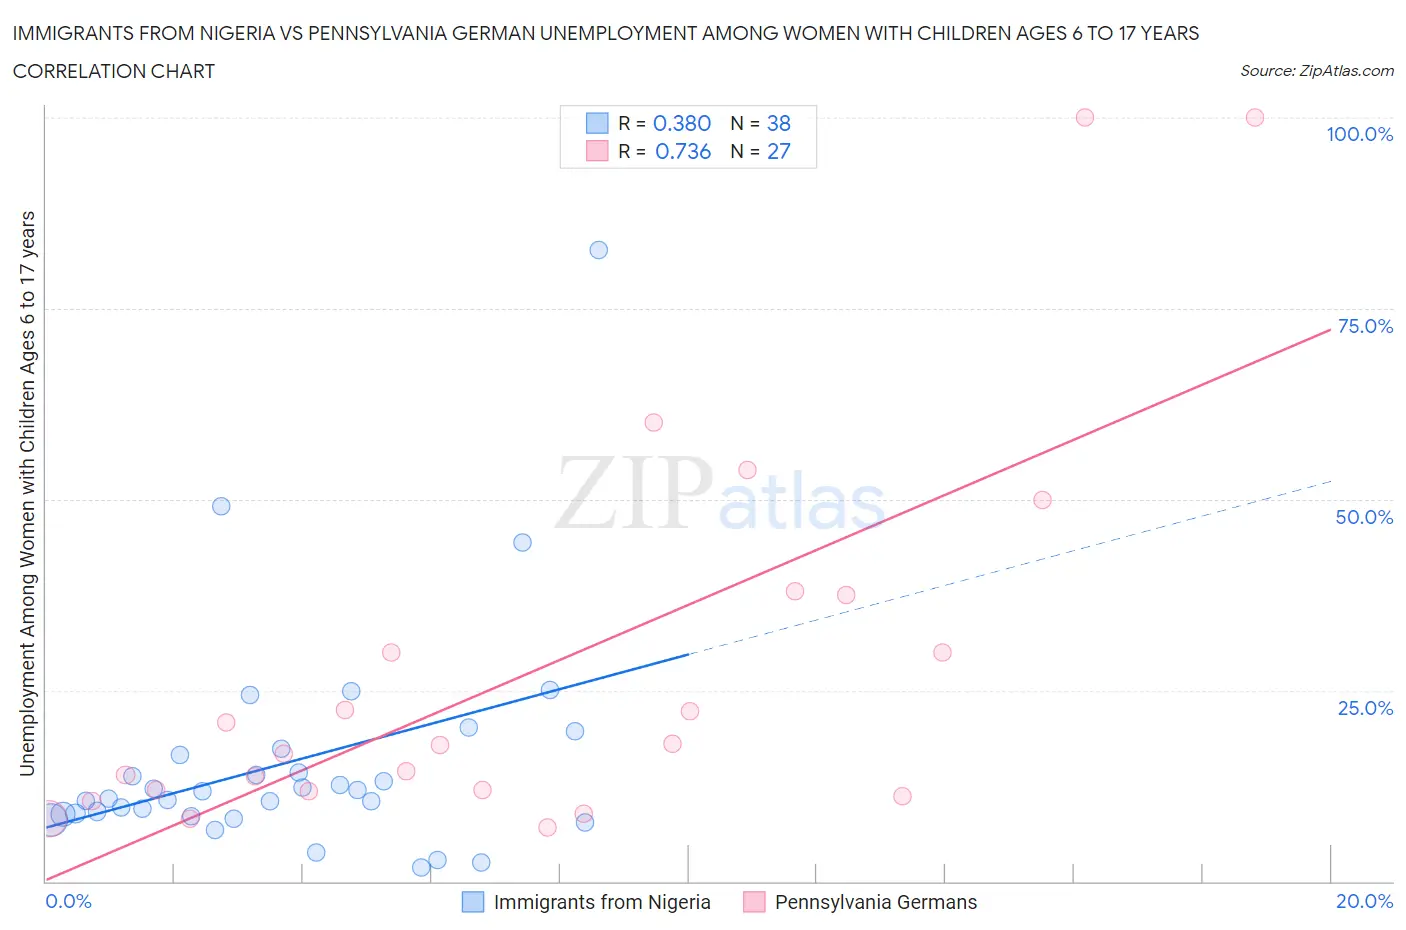
Immigrants from Nigeria vs Pennsylvania German Unemployment Among Women with Children Ages 6 to 17 years Correlation Chart
The statistical analysis conducted on geographies consisting of 224,793,064 people shows a mild positive correlation between the proportion of Immigrants from Nigeria and unemployment rate among women with children between the ages 6 and 17 in the United States with a correlation coefficient (R) of 0.380 and weighted average of 10.2%. Similarly, the statistical analysis conducted on geographies consisting of 176,093,273 people shows a strong positive correlation between the proportion of Pennsylvania Germans and unemployment rate among women with children between the ages 6 and 17 in the United States with a correlation coefficient (R) of 0.736 and weighted average of 11.0%, a difference of 8.2%.
Unemployment Among Women with Children Ages 6 to 17 years Correlation Summary
| Measurement | Immigrants from Nigeria | Pennsylvania German |
| Minimum | 1.8% | 7.1% |
| Maximum | 82.6% | 100.0% |
| Range | 80.8% | 92.9% |
| Mean | 15.5% | 27.7% |
| Median | 11.3% | 17.9% |
| Interquartile 25% (IQ1) | 8.8% | 11.7% |
| Interquartile 75% (IQ3) | 16.5% | 37.5% |
| Interquartile Range (IQR) | 7.7% | 25.8% |
| Standard Deviation (Sample) | 14.8% | 25.4% |
| Standard Deviation (Population) | 14.6% | 24.9% |
Similar Demographics by Unemployment Among Women with Children Ages 6 to 17 years
Demographics Similar to Immigrants from Nigeria by Unemployment Among Women with Children Ages 6 to 17 years
In terms of unemployment among women with children ages 6 to 17 years, the demographic groups most similar to Immigrants from Nigeria are Immigrants from Venezuela (10.2%, a difference of 0.060%), Immigrants from Ecuador (10.2%, a difference of 0.15%), Paraguayan (10.2%, a difference of 0.29%), Venezuelan (10.2%, a difference of 0.32%), and Immigrants from Senegal (10.2%, a difference of 0.52%).
| Demographics | Rating | Rank | Unemployment Among Women with Children Ages 6 to 17 years |
| Immigrants | Haiti | 0.0 /100 | #298 | Tragic 10.1% |
| Immigrants | Honduras | 0.0 /100 | #299 | Tragic 10.1% |
| Nigerians | 0.0 /100 | #300 | Tragic 10.1% |
| Immigrants | Bahamas | 0.0 /100 | #301 | Tragic 10.1% |
| Venezuelans | 0.0 /100 | #302 | Tragic 10.2% |
| Immigrants | Ecuador | 0.0 /100 | #303 | Tragic 10.2% |
| Immigrants | Venezuela | 0.0 /100 | #304 | Tragic 10.2% |
| Immigrants | Nigeria | 0.0 /100 | #305 | Tragic 10.2% |
| Paraguayans | 0.0 /100 | #306 | Tragic 10.2% |
| Immigrants | Senegal | 0.0 /100 | #307 | Tragic 10.2% |
| Dutch West Indians | 0.0 /100 | #308 | Tragic 10.2% |
| French Canadians | 0.0 /100 | #309 | Tragic 10.3% |
| Alaska Natives | 0.0 /100 | #310 | Tragic 10.3% |
| Immigrants | Liberia | 0.0 /100 | #311 | Tragic 10.3% |
| Africans | 0.0 /100 | #312 | Tragic 10.4% |
Demographics Similar to Pennsylvania Germans by Unemployment Among Women with Children Ages 6 to 17 years
In terms of unemployment among women with children ages 6 to 17 years, the demographic groups most similar to Pennsylvania Germans are Chippewa (11.1%, a difference of 0.48%), Ottawa (10.9%, a difference of 1.5%), Cape Verdean (10.9%, a difference of 1.6%), Liberian (10.8%, a difference of 1.7%), and Cajun (10.8%, a difference of 1.8%).
| Demographics | Rating | Rank | Unemployment Among Women with Children Ages 6 to 17 years |
| Cree | 0.0 /100 | #322 | Tragic 10.8% |
| Dominicans | 0.0 /100 | #323 | Tragic 10.8% |
| Immigrants | Dominican Republic | 0.0 /100 | #324 | Tragic 10.8% |
| Cajuns | 0.0 /100 | #325 | Tragic 10.8% |
| Liberians | 0.0 /100 | #326 | Tragic 10.8% |
| Cape Verdeans | 0.0 /100 | #327 | Tragic 10.9% |
| Ottawa | 0.0 /100 | #328 | Tragic 10.9% |
| Pennsylvania Germans | 0.0 /100 | #329 | Tragic 11.0% |
| Chippewa | 0.0 /100 | #330 | Tragic 11.1% |
| Blacks/African Americans | 0.0 /100 | #331 | Tragic 11.4% |
| Tsimshian | 0.0 /100 | #332 | Tragic 11.4% |
| Natives/Alaskans | 0.0 /100 | #333 | Tragic 11.5% |
| Ugandans | 0.0 /100 | #334 | Tragic 12.0% |
| Colville | 0.0 /100 | #335 | Tragic 12.3% |
| Houma | 0.0 /100 | #336 | Tragic 12.5% |