Immigrants from Mexico vs Delaware Unemployment Among Women with Children Ages 6 to 17 years
COMPARE
Immigrants from Mexico
Delaware
Unemployment Among Women with Children Ages 6 to 17 years
Unemployment Among Women with Children Ages 6 to 17 years Comparison
Immigrants from Mexico
Delaware
9.5%
UNEMPLOYMENT AMONG WOMEN WITH CHILDREN AGES 6 TO 17 YEARS
0.7/ 100
METRIC RATING
258th/ 347
METRIC RANK
10.5%
UNEMPLOYMENT AMONG WOMEN WITH CHILDREN AGES 6 TO 17 YEARS
0.0/ 100
METRIC RATING
318th/ 347
METRIC RANK
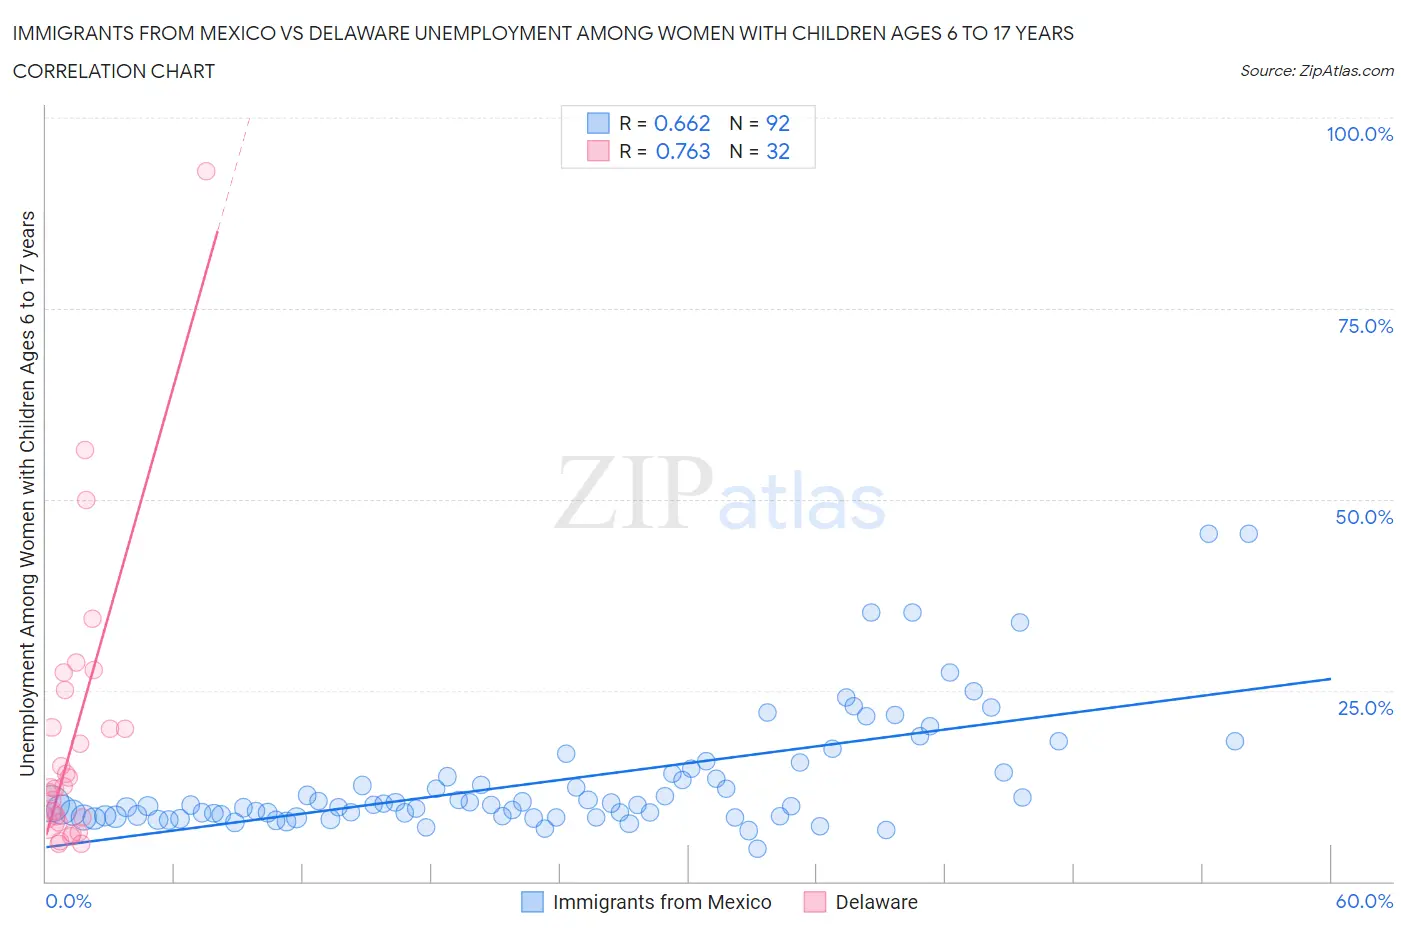
Immigrants from Mexico vs Delaware Unemployment Among Women with Children Ages 6 to 17 years Correlation Chart
The statistical analysis conducted on geographies consisting of 342,553,343 people shows a significant positive correlation between the proportion of Immigrants from Mexico and unemployment rate among women with children between the ages 6 and 17 in the United States with a correlation coefficient (R) of 0.662 and weighted average of 9.5%. Similarly, the statistical analysis conducted on geographies consisting of 82,551,003 people shows a strong positive correlation between the proportion of Delaware and unemployment rate among women with children between the ages 6 and 17 in the United States with a correlation coefficient (R) of 0.763 and weighted average of 10.5%, a difference of 11.2%.
Unemployment Among Women with Children Ages 6 to 17 years Correlation Summary
| Measurement | Immigrants from Mexico | Delaware |
| Minimum | 4.2% | 4.9% |
| Maximum | 45.5% | 93.0% |
| Range | 41.3% | 88.1% |
| Mean | 13.1% | 18.9% |
| Median | 10.0% | 12.4% |
| Interquartile 25% (IQ1) | 8.5% | 8.1% |
| Interquartile 75% (IQ3) | 14.2% | 22.6% |
| Interquartile Range (IQR) | 5.7% | 14.5% |
| Standard Deviation (Sample) | 7.9% | 18.4% |
| Standard Deviation (Population) | 7.9% | 18.1% |
Similar Demographics by Unemployment Among Women with Children Ages 6 to 17 years
Demographics Similar to Immigrants from Mexico by Unemployment Among Women with Children Ages 6 to 17 years
In terms of unemployment among women with children ages 6 to 17 years, the demographic groups most similar to Immigrants from Mexico are Celtic (9.5%, a difference of 0.090%), Immigrants from Central America (9.5%, a difference of 0.090%), Canadian (9.4%, a difference of 0.11%), Italian (9.5%, a difference of 0.21%), and Lithuanian (9.4%, a difference of 0.28%).
| Demographics | Rating | Rank | Unemployment Among Women with Children Ages 6 to 17 years |
| Central Americans | 1.3 /100 | #251 | Tragic 9.4% |
| Creek | 1.2 /100 | #252 | Tragic 9.4% |
| Portuguese | 1.1 /100 | #253 | Tragic 9.4% |
| Nicaraguans | 1.0 /100 | #254 | Tragic 9.4% |
| Lithuanians | 0.9 /100 | #255 | Tragic 9.4% |
| Canadians | 0.8 /100 | #256 | Tragic 9.4% |
| Celtics | 0.7 /100 | #257 | Tragic 9.5% |
| Immigrants | Mexico | 0.7 /100 | #258 | Tragic 9.5% |
| Immigrants | Central America | 0.6 /100 | #259 | Tragic 9.5% |
| Italians | 0.6 /100 | #260 | Tragic 9.5% |
| South Americans | 0.5 /100 | #261 | Tragic 9.5% |
| Senegalese | 0.5 /100 | #262 | Tragic 9.5% |
| Lebanese | 0.5 /100 | #263 | Tragic 9.5% |
| Immigrants | Ghana | 0.4 /100 | #264 | Tragic 9.5% |
| West Indians | 0.4 /100 | #265 | Tragic 9.5% |
Demographics Similar to Delaware by Unemployment Among Women with Children Ages 6 to 17 years
In terms of unemployment among women with children ages 6 to 17 years, the demographic groups most similar to Delaware are Bermudan (10.5%, a difference of 0.020%), Immigrants from Dominica (10.5%, a difference of 0.13%), Bahamian (10.4%, a difference of 0.88%), Immigrants from Cabo Verde (10.4%, a difference of 0.91%), and American (10.4%, a difference of 0.96%).
| Demographics | Rating | Rank | Unemployment Among Women with Children Ages 6 to 17 years |
| Immigrants | Liberia | 0.0 /100 | #311 | Tragic 10.3% |
| Africans | 0.0 /100 | #312 | Tragic 10.4% |
| Americans | 0.0 /100 | #313 | Tragic 10.4% |
| Immigrants | Cabo Verde | 0.0 /100 | #314 | Tragic 10.4% |
| Bahamians | 0.0 /100 | #315 | Tragic 10.4% |
| Immigrants | Dominica | 0.0 /100 | #316 | Tragic 10.5% |
| Bermudans | 0.0 /100 | #317 | Tragic 10.5% |
| Delaware | 0.0 /100 | #318 | Tragic 10.5% |
| Immigrants | Uganda | 0.0 /100 | #319 | Tragic 10.7% |
| Apache | 0.0 /100 | #320 | Tragic 10.7% |
| Tohono O'odham | 0.0 /100 | #321 | Tragic 10.7% |
| Cree | 0.0 /100 | #322 | Tragic 10.8% |
| Dominicans | 0.0 /100 | #323 | Tragic 10.8% |
| Immigrants | Dominican Republic | 0.0 /100 | #324 | Tragic 10.8% |
| Cajuns | 0.0 /100 | #325 | Tragic 10.8% |