Blackfeet vs Immigrants from Uganda Unemployment Among Women with Children Ages 6 to 17 years

COMPARE

Blackfeet
Race
Ancestry
AfghanAfricanAlaska NativeAlaskan AthabascanAlbanianAleutAlsatianAmericanApacheArabArapahoArgentineanArmenianAssyrian/Chaldean/SyriacAustralianAustrianBahamianBangladeshiBarbadianBasqueBelgianBelizeanBermudanBhutaneseBlackfeetBolivianBrazilianBritishBritish West IndianBulgarianBurmeseCajunCambodianCanadianCape VerdeanCarpatho RusynCelticCentral AmericanCentral American IndianCherokeeCheyenneChickasawChileanChineseChippewaChoctawColombianColvilleComancheCosta RicanCreeCreekCroatianCrowCubanCypriotCzechCzechoslovakianDanishDelawareDominicanDutchDutch West IndianEastern EuropeanEcuadorianEgyptianEnglishEstonianEthiopianEuropeanFijianFilipinoFinnishFrenchFrench American IndianFrench CanadianGermanGerman RussianGhanaianGreekGuamanian/ChamorroGuatemalanGuyaneseHaitianHmongHonduranHopiHoumaHungarianIcelanderIndian (Asian)IndonesianInupiatIranianIraqiIrishIroquoisIsraeliItalianJamaicanJapaneseJordanianKenyanKiowaKoreanLaotianLatvianLebaneseLiberianLithuanianLumbeeLuxembourgerMacedonianMalaysianMalteseMarshalleseMenomineeMexicanMexican American IndianMongolianMoroccanNative HawaiianNavajoNepaleseNew ZealanderNicaraguanNigerianNorthern EuropeanNorwegianOkinawanOsageOttawaPaiutePakistaniPalestinianPanamanianParaguayanPennsylvania GermanPeruvianPimaPolishPortuguesePotawatomiPuebloPuerto RicanPuget Sound SalishRomanianRussianSalvadoranSamoanScandinavianScotch-IrishScottishSeminoleSenegaleseSerbianShoshoneSierra LeoneanSiouxSlavicSlovakSloveneSomaliSouth AfricanSouth AmericanSouth American IndianSoviet UnionSpaniardSpanishSpanish AmericanSpanish American IndianSri LankanSubsaharan AfricanSudaneseSwedishSwissSyrianTaiwaneseThaiTlingit-HaidaTohono O'OdhamTonganTrinidadian and TobagonianTsimshianTurkishU.S. Virgin IslanderUgandanUkrainianUruguayanUteVenezuelanVietnameseWelshWest IndianYakamaYaquiYugoslavianYumanYup'ikZimbabwean
Immigration
NonimmigrantsImmigrantsAfghanistanAfricaAlbaniaArgentinaArmeniaAsiaAustraliaAustriaBahamasBangladeshBarbadosBelarusBelgiumBelizeBoliviaBosnia and HerzegovinaBrazilBulgariaBurma/MyanmarCabo VerdeCambodiaCameroonCanadaCaribbeanCentral AmericaChileChinaColombiaCongoCosta RicaCroatiaCubaCzechoslovakiaDenmarkDominicaDominican RepublicEastern AfricaEastern AsiaEastern EuropeEcuadorEgyptEl SalvadorEnglandEritreaEthiopiaEuropeFijiFranceGermanyGhanaGreeceGrenadaGuatemalaGuyanaHaitiHondurasHong KongHungaryIndiaIndonesiaIranIraqIrelandIsraelItalyJamaicaJapanJordanKazakhstanKenyaKoreaKuwaitLaosLatin AmericaLatviaLebanonLiberiaLithuaniaMalaysiaMexicoMicronesiaMiddle AfricaMoldovaMoroccoNepalNetherlandsNicaraguaNigeriaNorth AmericaNorth MacedoniaNorthern AfricaNorthern EuropeNorwayOceaniaPakistanPanamaPeruPhilippinesPolandPortugalRomaniaRussiaSaudi ArabiaScotlandSenegalSerbiaSierra LeoneSingaporeSomaliaSouth AfricaSouth AmericaSouth Central AsiaSouth Eastern AsiaSouthern EuropeSpainSri LankaSt. Vincent and the GrenadinesSudanSwedenSwitzerlandSyriaTaiwanThailandTrinidad and TobagoTurkeyUkraineUruguayUzbekistanVenezuelaVietnamWest IndiesWestern AfricaWestern AsiaWestern EuropeYemenZaireZimbabweAzores
Immigrants from Uganda
Race
Ancestry
AfghanAfricanAlaska NativeAlaskan AthabascanAlbanianAleutAlsatianAmericanApacheArabArapahoArgentineanArmenianAssyrian/Chaldean/SyriacAustralianAustrianBahamianBangladeshiBarbadianBasqueBelgianBelizeanBermudanBhutaneseBolivianBrazilianBritishBritish West IndianBulgarianBurmeseCajunCambodianCanadianCape VerdeanCarpatho RusynCelticCentral AmericanCentral American IndianCherokeeCheyenneChickasawChileanChineseChippewaChoctawColombianColvilleComancheCosta RicanCreeCreekCroatianCrowCubanCypriotCzechCzechoslovakianDanishDelawareDominicanDutchDutch West IndianEastern EuropeanEcuadorianEgyptianEnglishEstonianEthiopianEuropeanFijianFilipinoFinnishFrenchFrench American IndianFrench CanadianGermanGerman RussianGhanaianGreekGuamanian/ChamorroGuatemalanGuyaneseHaitianHmongHonduranHopiHoumaHungarianIcelanderIndian (Asian)IndonesianInupiatIranianIraqiIrishIroquoisIsraeliItalianJamaicanJapaneseJordanianKenyanKiowaKoreanLaotianLatvianLebaneseLiberianLithuanianLumbeeLuxembourgerMacedonianMalaysianMalteseMarshalleseMenomineeMexicanMexican American IndianMongolianMoroccanNative HawaiianNavajoNepaleseNew ZealanderNicaraguanNigerianNorthern EuropeanNorwegianOkinawanOsageOttawaPaiutePakistaniPalestinianPanamanianParaguayanPennsylvania GermanPeruvianPimaPolishPortuguesePotawatomiPuebloPuerto RicanPuget Sound SalishRomanianRussianSalvadoranSamoanScandinavianScotch-IrishScottishSeminoleSenegaleseSerbianShoshoneSierra LeoneanSiouxSlavicSlovakSloveneSomaliSouth AfricanSouth AmericanSouth American IndianSoviet UnionSpaniardSpanishSpanish AmericanSpanish American IndianSri LankanSubsaharan AfricanSudaneseSwedishSwissSyrianTaiwaneseThaiTlingit-HaidaTohono O'OdhamTonganTrinidadian and TobagonianTsimshianTurkishU.S. Virgin IslanderUgandanUkrainianUruguayanUteVenezuelanVietnameseWelshWest IndianYakamaYaquiYugoslavianYumanYup'ikZimbabwean
Immigration
NonimmigrantsImmigrantsAfghanistanAfricaAlbaniaArgentinaArmeniaAsiaAustraliaAustriaBahamasBangladeshBarbadosBelarusBelgiumBelizeBoliviaBosnia and HerzegovinaBrazilBulgariaBurma/MyanmarCabo VerdeCambodiaCameroonCanadaCaribbeanCentral AmericaChileChinaColombiaCongoCosta RicaCroatiaCubaCzechoslovakiaDenmarkDominicaDominican RepublicEastern AfricaEastern AsiaEastern EuropeEcuadorEgyptEl SalvadorEnglandEritreaEthiopiaEuropeFijiFranceGermanyGhanaGreeceGrenadaGuatemalaGuyanaHaitiHondurasHong KongHungaryIndiaIndonesiaIranIraqIrelandIsraelItalyJamaicaJapanJordanKazakhstanKenyaKoreaKuwaitLaosLatin AmericaLatviaLebanonLiberiaLithuaniaMalaysiaMexicoMicronesiaMiddle AfricaMoldovaMoroccoNepalNetherlandsNicaraguaNigeriaNorth AmericaNorth MacedoniaNorthern AfricaNorthern EuropeNorwayOceaniaPakistanPanamaPeruPhilippinesPolandPortugalRomaniaRussiaSaudi ArabiaScotlandSenegalSerbiaSierra LeoneSingaporeSomaliaSouth AfricaSouth AmericaSouth Central AsiaSouth Eastern AsiaSouthern EuropeSpainSri LankaSt. Vincent and the GrenadinesSudanSwedenSwitzerlandSyriaTaiwanThailandTrinidad and TobagoTurkeyUgandaUkraineUruguayUzbekistanVenezuelaVietnamWest IndiesWestern AfricaWestern AsiaWestern EuropeYemenZaireZimbabweAzores
Unemployment Among Women with Children Ages 6 to 17 years
Income
Poverty
Unemployment
Labor Participation
Family Structure
Vehicle Availability
Education Level
Disability

Unemployment Among Women with Children Ages 6 to 17 years Comparison

Blackfeet

Immigrants from Uganda

Tragic
Tragic
9.6%
UNEMPLOYMENT AMONG WOMEN WITH CHILDREN AGES 6 TO 17 YEARS
0.2/ 100
METRIC RATING
269th/ 347
METRIC RANK
10.7%
UNEMPLOYMENT AMONG WOMEN WITH CHILDREN AGES 6 TO 17 YEARS
0.0/ 100
METRIC RATING
319th/ 347
METRIC RANK

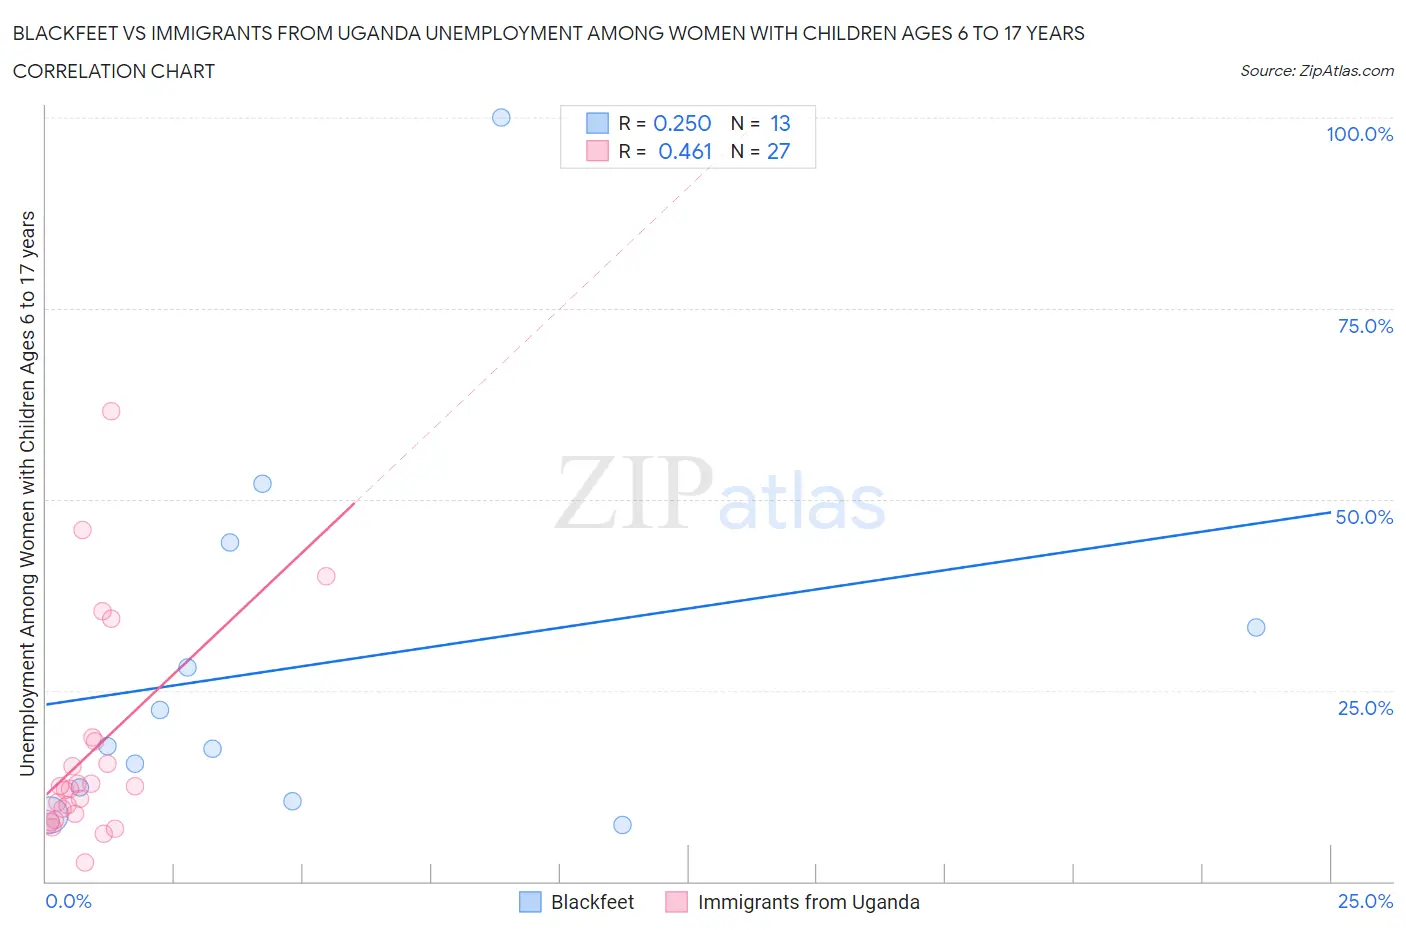
Blackfeet vs Immigrants from Uganda Unemployment Among Women with Children Ages 6 to 17 years Correlation Chart

The statistical analysis conducted on geographies consisting of 237,122,541 people shows a weak positive correlation between the proportion of Blackfeet and unemployment rate among women with children between the ages 6 and 17 in the United States with a correlation coefficient (R) of 0.250 and weighted average of 9.6%. Similarly, the statistical analysis conducted on geographies consisting of 110,485,148 people shows a moderate positive correlation between the proportion of Immigrants from Uganda and unemployment rate among women with children between the ages 6 and 17 in the United States with a correlation coefficient (R) of 0.461 and weighted average of 10.7%, a difference of 11.2%.
Blackfeet vs Immigrants from Uganda Unemployment Among Women with Children Ages 6 to 17 years

Unemployment Among Women with Children Ages 6 to 17 years Correlation Summary

MeasurementBlackfeetImmigrants from Uganda
Minimum7.4%2.5%
Maximum100.0%61.5%
Range92.6%59.0%
Mean28.4%16.9%
Median17.6%12.1%
Interquartile 25% (IQ1)11.4%8.1%
Interquartile 75% (IQ3)38.8%18.3%
Interquartile Range (IQR)27.5%10.2%
Standard Deviation (Sample)25.5%14.1%
Standard Deviation (Population)24.5%13.8%

Similar Demographics by Unemployment Among Women with Children Ages 6 to 17 years

Demographics Similar to Blackfeet by Unemployment Among Women with Children Ages 6 to 17 years

In terms of unemployment among women with children ages 6 to 17 years, the demographic groups most similar to Blackfeet are Ghanaian (9.6%, a difference of 0.080%), Immigrants from Nicaragua (9.6%, a difference of 0.10%), Irish (9.5%, a difference of 0.47%), Immigrants from Jamaica (9.5%, a difference of 0.49%), and Immigrants from Latin America (9.6%, a difference of 0.50%).
DemographicsRating | RankUnemployment Among Women with Children Ages 6 to 17 years
Senegalese
0.5
/100
|
#262
Tragic
9.5%
Lebanese
0.5
/100
|
#263
Tragic
9.5%
Immigrants | Ghana
0.4
/100
|
#264
Tragic
9.5%
West Indians
0.4
/100
|
#265
Tragic
9.5%
Immigrants | Jamaica
0.3
/100
|
#266
Tragic
9.5%
Irish
0.3
/100
|
#267
Tragic
9.5%
Ghanaians
0.2
/100
|
#268
Tragic
9.6%
Blackfeet
0.2
/100
|
#269
Tragic
9.6%
Immigrants | Nicaragua
0.2
/100
|
#270
Tragic
9.6%
Immigrants | Latin America
0.1
/100
|
#271
Tragic
9.6%
Kiowa
0.1
/100
|
#272
Tragic
9.6%
Whites/Caucasians
0.1
/100
|
#273
Tragic
9.6%
Aleuts
0.1
/100
|
#274
Tragic
9.6%
U.S. Virgin Islanders
0.1
/100
|
#275
Tragic
9.7%
Immigrants | Portugal
0.1
/100
|
#276
Tragic
9.7%

Demographics Similar to Immigrants from Uganda by Unemployment Among Women with Children Ages 6 to 17 years

In terms of unemployment among women with children ages 6 to 17 years, the demographic groups most similar to Immigrants from Uganda are Apache (10.7%, a difference of 0.020%), Tohono O'odham (10.7%, a difference of 0.19%), Delaware (10.5%, a difference of 1.3%), Bermudan (10.5%, a difference of 1.3%), and Immigrants from Dominica (10.5%, a difference of 1.4%).
DemographicsRating | RankUnemployment Among Women with Children Ages 6 to 17 years
Africans
0.0
/100
|
#312
Tragic
10.4%
Americans
0.0
/100
|
#313
Tragic
10.4%
Immigrants | Cabo Verde
0.0
/100
|
#314
Tragic
10.4%
Bahamians
0.0
/100
|
#315
Tragic
10.4%
Immigrants | Dominica
0.0
/100
|
#316
Tragic
10.5%
Bermudans
0.0
/100
|
#317
Tragic
10.5%
Delaware
0.0
/100
|
#318
Tragic
10.5%
Immigrants | Uganda
0.0
/100
|
#319
Tragic
10.7%
Apache
0.0
/100
|
#320
Tragic
10.7%
Tohono O'odham
0.0
/100
|
#321
Tragic
10.7%
Cree
0.0
/100
|
#322
Tragic
10.8%
Dominicans
0.0
/100
|
#323
Tragic
10.8%
Immigrants | Dominican Republic
0.0
/100
|
#324
Tragic
10.8%
Cajuns
0.0
/100
|
#325
Tragic
10.8%
Liberians
0.0
/100
|
#326
Tragic
10.8%