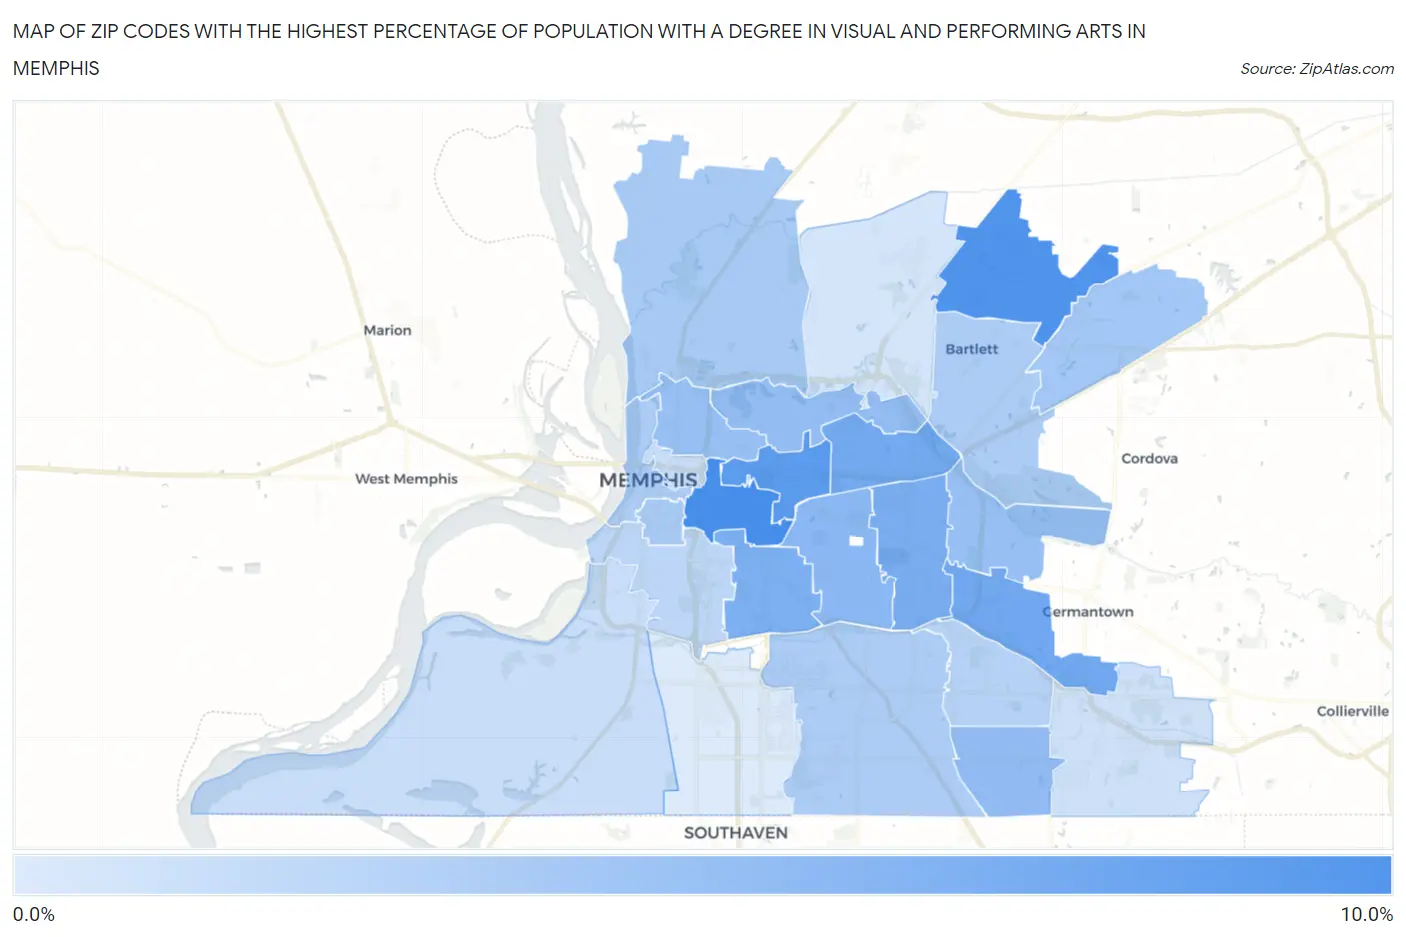
Zip Codes with the Highest Percentage of Population with a Degree in Visual and Performing Arts in Memphis, TN
RELATED REPORTS & OPTIONS
Visual and Performing Arts
Memphis
Compare Zip Codes
Map of Zip Codes with the Highest Percentage of Population with a Degree in Visual and Performing Arts in Memphis
0.0%
10.0%
Zip Codes with the Highest Percentage of Population with a Degree in Visual and Performing Arts in Memphis, TN
| Zip Code | % Graduates | vs State | vs National | |
| 1. | 38104 | 8.4% | 4.1%(+4.30)#47 | 4.3%(+4.11)#2,619 |
| 2. | 38135 | 7.9% | 4.1%(+3.83)#52 | 4.3%(+3.64)#2,928 |
| 3. | 38112 | 7.3% | 4.1%(+3.27)#64 | 4.3%(+3.08)#3,348 |
| 4. | 38119 | 6.1% | 4.1%(+2.08)#90 | 4.3%(+1.90)#4,679 |
| 5. | 38122 | 6.0% | 4.1%(+1.92)#97 | 4.3%(+1.73)#4,900 |
| 6. | 38117 | 5.6% | 4.1%(+1.57)#108 | 4.3%(+1.38)#5,449 |
| 7. | 38114 | 5.4% | 4.1%(+1.38)#118 | 4.3%(+1.19)#5,771 |
| 8. | 38111 | 4.8% | 4.1%(+0.699)#149 | 4.3%(+0.512)#7,143 |
| 9. | 38141 | 4.4% | 4.1%(+0.324)#168 | 4.3%(+0.137)#8,120 |
| 10. | 38108 | 4.2% | 4.1%(+0.177)#175 | 4.3%(-0.010)#8,506 |
| 11. | 38107 | 4.0% | 4.1%(-0.016)#183 | 4.3%(-0.203)#9,092 |
| 12. | 38120 | 3.9% | 4.1%(-0.129)#191 | 4.3%(-0.316)#9,459 |
| 13. | 38133 | 3.3% | 4.1%(-0.719)#214 | 4.3%(-0.907)#11,435 |
| 14. | 38126 | 3.2% | 4.1%(-0.862)#226 | 4.3%(-1.05)#11,979 |
| 15. | 38127 | 3.1% | 4.1%(-0.928)#229 | 4.3%(-1.12)#12,209 |
| 16. | 38103 | 2.9% | 4.1%(-1.12)#236 | 4.3%(-1.31)#12,935 |
| 17. | 38134 | 2.9% | 4.1%(-1.17)#239 | 4.3%(-1.36)#13,125 |
| 18. | 38118 | 2.9% | 4.1%(-1.21)#240 | 4.3%(-1.40)#13,284 |
| 19. | 38115 | 2.4% | 4.1%(-1.62)#267 | 4.3%(-1.80)#14,792 |
| 20. | 38106 | 2.0% | 4.1%(-2.02)#294 | 4.3%(-2.21)#16,285 |
| 21. | 38105 | 1.5% | 4.1%(-2.60)#337 | 4.3%(-2.79)#18,279 |
| 22. | 38109 | 1.4% | 4.1%(-2.62)#338 | 4.3%(-2.81)#18,332 |
| 23. | 38125 | 1.1% | 4.1%(-2.98)#359 | 4.3%(-3.17)#19,424 |
| 24. | 38128 | 0.82% | 4.1%(-3.25)#375 | 4.3%(-3.44)#20,109 |
| 25. | 38116 | 0.39% | 4.1%(-3.67)#399 | 4.3%(-3.86)#20,967 |
1
Common Questions
What are the Top 10 Zip Codes with the Highest Percentage of Population with a Degree in Visual and Performing Arts in Memphis, TN?
Top 10 Zip Codes with the Highest Percentage of Population with a Degree in Visual and Performing Arts in Memphis, TN are:
What zip code has the Highest Percentage of Population with a Degree in Visual and Performing Arts in Memphis, TN?
38104 has the Highest Percentage of Population with a Degree in Visual and Performing Arts in Memphis, TN with 8.4%.
What is the Percentage of Population with a Degree in Visual and Performing Arts in Memphis, TN?
Percentage of Population with a Degree in Visual and Performing Arts in Memphis is 4.4%.
What is the Percentage of Population with a Degree in Visual and Performing Arts in Tennessee?
Percentage of Population with a Degree in Visual and Performing Arts in Tennessee is 4.1%.
What is the Percentage of Population with a Degree in Visual and Performing Arts in the United States?
Percentage of Population with a Degree in Visual and Performing Arts in the United States is 4.3%.