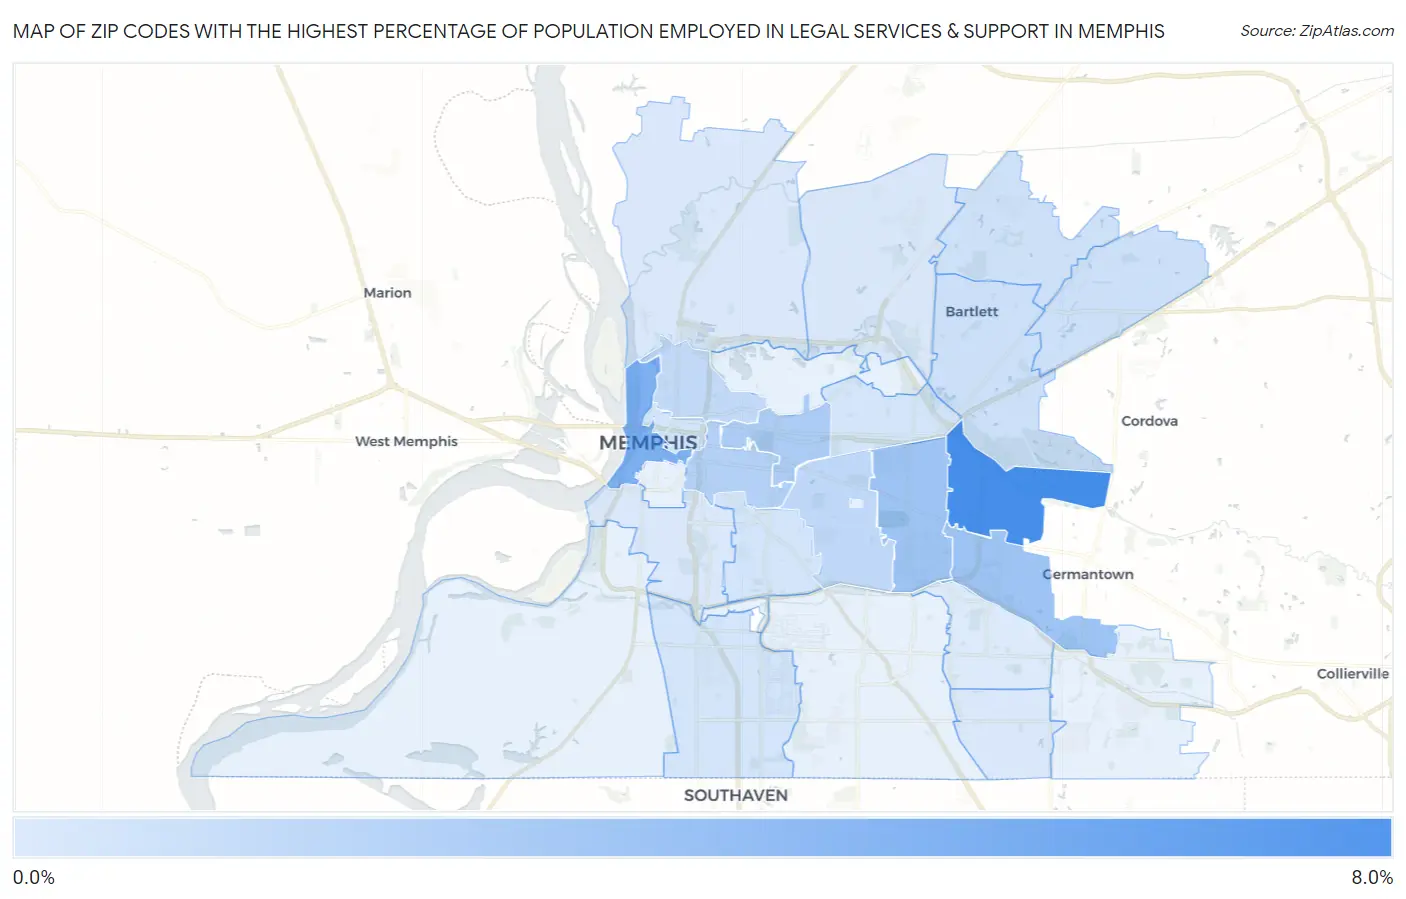
Zip Codes with the Highest Percentage of Population Employed in Legal Services & Support in Memphis, TN
RELATED REPORTS & OPTIONS
Legal Services & Support
Memphis
Compare Zip Codes
Map of Zip Codes with the Highest Percentage of Population Employed in Legal Services & Support in Memphis
0.0%
8.0%
Zip Codes with the Highest Percentage of Population Employed in Legal Services & Support in Memphis, TN
| Zip Code | % Employed | vs State | vs National | |
| 1. | 38120 | 6.8% | 0.90%(+5.88)#5 | 1.2%(+5.59)#371 |
| 2. | 38103 | 4.2% | 0.90%(+3.32)#12 | 1.2%(+3.03)#1,014 |
| 3. | 38119 | 2.8% | 0.90%(+1.91)#33 | 1.2%(+1.62)#2,078 |
| 4. | 38117 | 2.8% | 0.90%(+1.88)#34 | 1.2%(+1.59)#2,110 |
| 5. | 38112 | 2.2% | 0.90%(+1.27)#52 | 1.2%(+0.980)#3,108 |
| 6. | 38104 | 1.9% | 0.90%(+1.01)#62 | 1.2%(+0.724)#3,712 |
| 7. | 38111 | 1.3% | 0.90%(+0.426)#87 | 1.2%(+0.140)#5,814 |
| 8. | 38107 | 1.3% | 0.90%(+0.356)#91 | 1.2%(+0.070)#6,185 |
| 9. | 38133 | 0.78% | 0.90%(-0.119)#156 | 1.2%(-0.405)#9,649 |
| 10. | 38134 | 0.72% | 0.90%(-0.183)#169 | 1.2%(-0.468)#10,258 |
| 11. | 38135 | 0.62% | 0.90%(-0.282)#191 | 1.2%(-0.568)#11,299 |
| 12. | 38116 | 0.48% | 0.90%(-0.418)#222 | 1.2%(-0.704)#12,888 |
| 13. | 38122 | 0.46% | 0.90%(-0.442)#227 | 1.2%(-0.728)#13,192 |
| 14. | 38114 | 0.43% | 0.90%(-0.472)#232 | 1.2%(-0.758)#13,544 |
| 15. | 38105 | 0.41% | 0.90%(-0.492)#239 | 1.2%(-0.778)#13,783 |
| 16. | 38128 | 0.27% | 0.90%(-0.629)#271 | 1.2%(-0.915)#15,399 |
| 17. | 38141 | 0.14% | 0.90%(-0.755)#306 | 1.2%(-1.04)#16,756 |
| 18. | 38106 | 0.12% | 0.90%(-0.779)#312 | 1.2%(-1.06)#16,976 |
| 19. | 38127 | 0.11% | 0.90%(-0.791)#315 | 1.2%(-1.08)#17,058 |
| 20. | 38115 | 0.049% | 0.90%(-0.849)#322 | 1.2%(-1.14)#17,431 |
1
Common Questions
What are the Top 10 Zip Codes with the Highest Percentage of Population Employed in Legal Services & Support in Memphis, TN?
Top 10 Zip Codes with the Highest Percentage of Population Employed in Legal Services & Support in Memphis, TN are:
What zip code has the Highest Percentage of Population Employed in Legal Services & Support in Memphis, TN?
38120 has the Highest Percentage of Population Employed in Legal Services & Support in Memphis, TN with 6.8%.
What is the Percentage of Population Employed in Legal Services & Support in Memphis, TN?
Percentage of Population Employed in Legal Services & Support in Memphis is 1.1%.
What is the Percentage of Population Employed in Legal Services & Support in Tennessee?
Percentage of Population Employed in Legal Services & Support in Tennessee is 0.90%.
What is the Percentage of Population Employed in Legal Services & Support in the United States?
Percentage of Population Employed in Legal Services & Support in the United States is 1.2%.