Zip Codes with the Highest Percentage of Families with Income Below $10,000 in Memphis, TN
RELATED REPORTS & OPTIONS
Family Income | $0-10k
Memphis
Compare Zip Codes
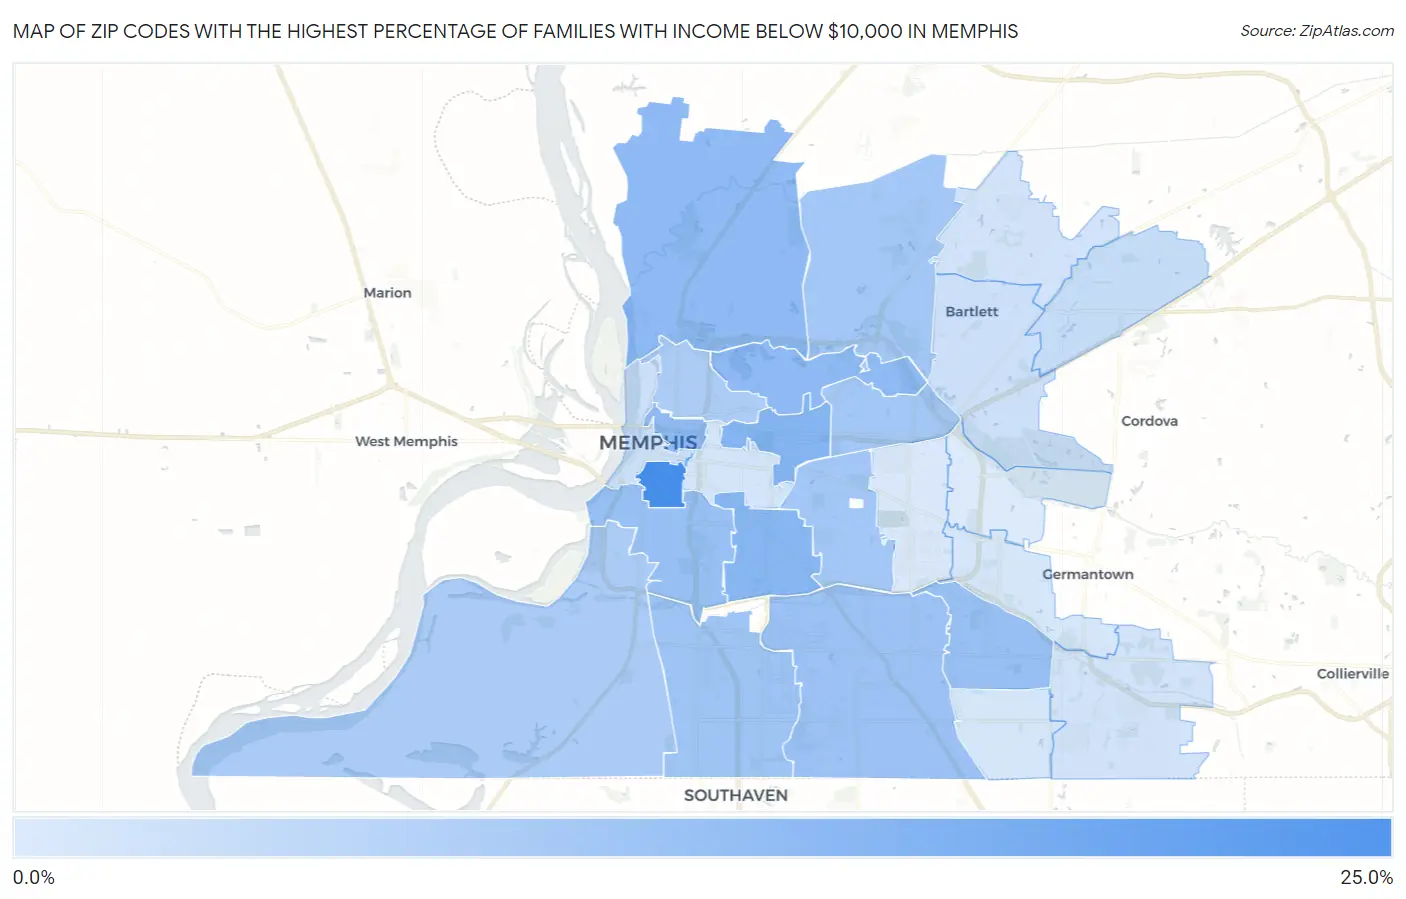
Map of Zip Codes with the Highest Percentage of Families with Income Below $10,000 in Memphis
0.0%
25.0%
Zip Codes with the Highest Percentage of Families with Income Below $10,000 in Memphis, TN
| Zip Code | Families with Income < $10k | vs State | vs National | |
| 1. | 38126 | 23.1% | 3.5%(+19.6)#4 | 3.1%(+20.0)#367 |
| 2. | 38112 | 13.2% | 3.5%(+9.70)#15 | 3.1%(+10.1)#1,088 |
| 3. | 38114 | 12.9% | 3.5%(+9.40)#16 | 3.1%(+9.80)#1,133 |
| 4. | 38108 | 11.8% | 3.5%(+8.30)#21 | 3.1%(+8.70)#1,370 |
| 5. | 38127 | 11.7% | 3.5%(+8.20)#22 | 3.1%(+8.60)#1,390 |
| 6. | 38105 | 11.6% | 3.5%(+8.10)#25 | 3.1%(+8.50)#1,418 |
| 7. | 38115 | 10.4% | 3.5%(+6.90)#33 | 3.1%(+7.30)#1,774 |
| 8. | 38106 | 10.2% | 3.5%(+6.70)#34 | 3.1%(+7.10)#1,831 |
| 9. | 38118 | 9.7% | 3.5%(+6.20)#43 | 3.1%(+6.60)#2,029 |
| 10. | 38116 | 9.2% | 3.5%(+5.70)#48 | 3.1%(+6.10)#2,242 |
| 11. | 38128 | 8.7% | 3.5%(+5.20)#54 | 3.1%(+5.60)#2,502 |
| 12. | 38111 | 8.7% | 3.5%(+5.20)#55 | 3.1%(+5.60)#2,503 |
| 13. | 38122 | 8.5% | 3.5%(+5.00)#59 | 3.1%(+5.40)#2,631 |
| 14. | 38109 | 7.6% | 3.5%(+4.10)#79 | 3.1%(+4.50)#3,194 |
| 15. | 38107 | 7.4% | 3.5%(+3.90)#85 | 3.1%(+4.30)#3,348 |
| 16. | 38133 | 3.5% | 3.5%(=0.000)#233 | 3.1%(+0.400)#9,538 |
| 17. | 38134 | 2.7% | 3.5%(-0.800)#294 | 3.1%(-0.400)#12,224 |
| 18. | 38103 | 2.7% | 3.5%(-0.800)#299 | 3.1%(-0.400)#12,365 |
| 19. | 38125 | 1.9% | 3.5%(-1.60)#373 | 3.1%(-1.20)#15,757 |
| 20. | 38135 | 1.9% | 3.5%(-1.60)#374 | 3.1%(-1.20)#15,796 |
| 21. | 38104 | 1.7% | 3.5%(-1.80)#396 | 3.1%(-1.40)#16,803 |
| 22. | 38119 | 1.5% | 3.5%(-2.00)#407 | 3.1%(-1.60)#17,782 |
| 23. | 38141 | 1.3% | 3.5%(-2.20)#425 | 3.1%(-1.80)#18,786 |
| 24. | 38117 | 0.60% | 3.5%(-2.90)#484 | 3.1%(-2.50)#22,193 |
| 25. | 38120 | 0.40% | 3.5%(-3.10)#494 | 3.1%(-2.70)#23,090 |
1
Common Questions
What are the Top 10 Zip Codes with the Highest Percentage of Families with Income Below $10,000 in Memphis, TN?
Top 10 Zip Codes with the Highest Percentage of Families with Income Below $10,000 in Memphis, TN are:
What zip code has the Highest Percentage of Families with Income Below $10,000 in Memphis, TN?
38126 has the Highest Percentage of Families with Income Below $10,000 in Memphis, TN with 23.1%.
What is the Percentage of Families with Income Below $10,000 in Memphis, TN?
Percentage of Families with Income Below $10,000 in Memphis is 7.1%.
What is the Percentage of Families with Income Below $10,000 in Tennessee?
Percentage of Families with Income Below $10,000 in Tennessee is 3.5%.
What is the Percentage of Families with Income Below $10,000 in the United States?
Percentage of Families with Income Below $10,000 in the United States is 3.1%.