Zip Codes with the Highest Percentage of Population Employed in Health Diagnosing & Treating in Memphis, TN
RELATED REPORTS & OPTIONS
Health Diagnosing & Treating
Memphis
Compare Zip Codes
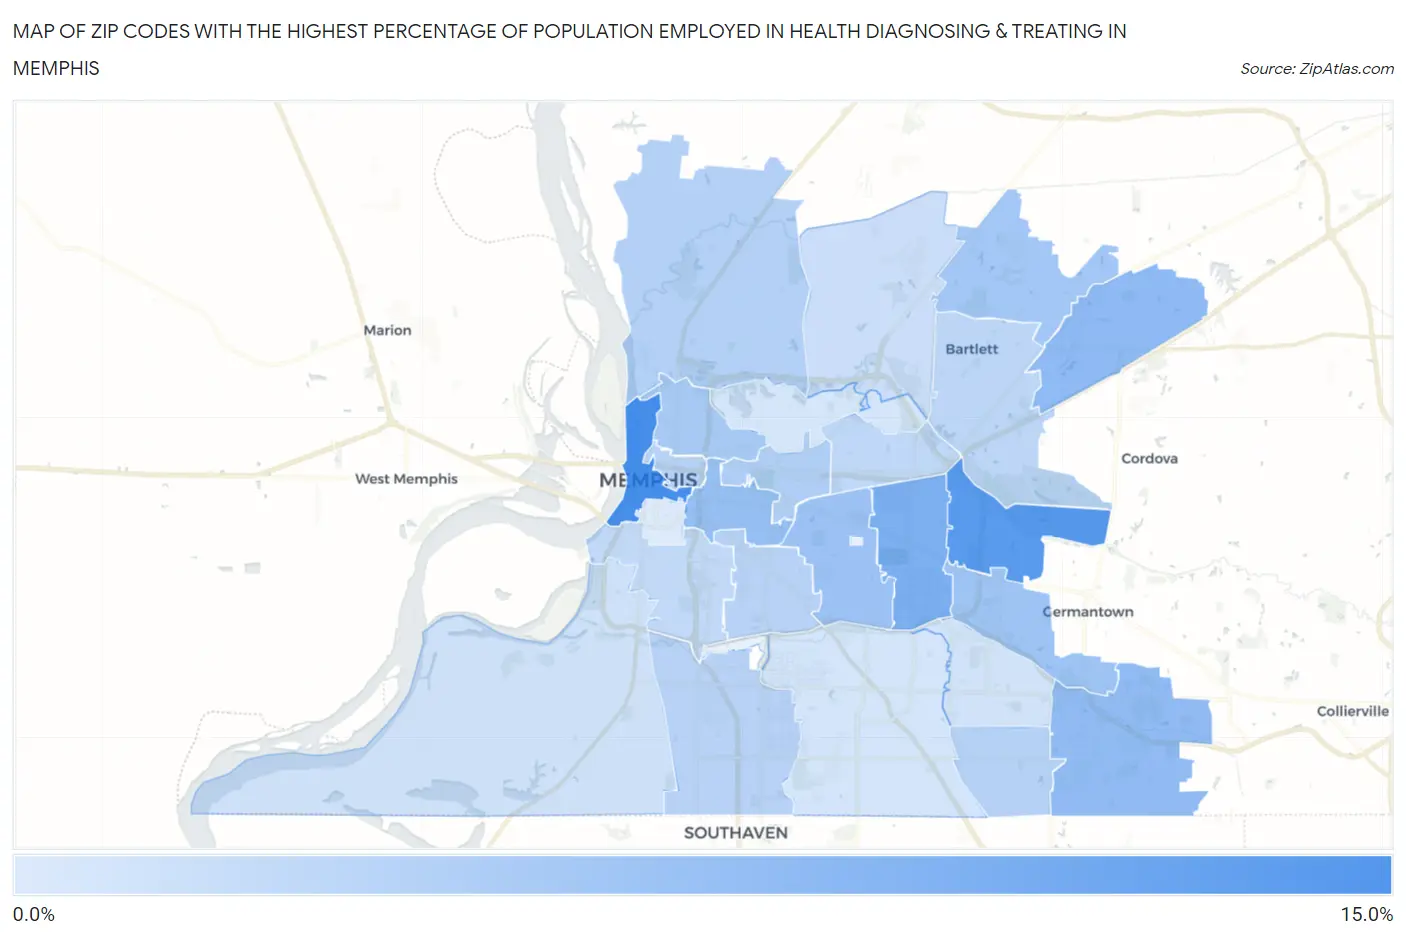
Map of Zip Codes with the Highest Percentage of Population Employed in Health Diagnosing & Treating in Memphis
0.0%
15.0%
Zip Codes with the Highest Percentage of Population Employed in Health Diagnosing & Treating in Memphis, TN
| Zip Code | % Employed | vs State | vs National | |
| 1. | 38103 | 14.9% | 6.9%(+8.07)#15 | 6.2%(+8.69)#1,171 |
| 2. | 38120 | 13.4% | 6.9%(+6.50)#28 | 6.2%(+7.11)#1,621 |
| 3. | 38117 | 10.1% | 6.9%(+3.22)#82 | 6.2%(+3.84)#3,790 |
| 4. | 38133 | 8.5% | 6.9%(+1.59)#153 | 6.2%(+2.21)#6,429 |
| 5. | 38125 | 8.1% | 6.9%(+1.20)#177 | 6.2%(+1.82)#7,346 |
| 6. | 38104 | 7.8% | 6.9%(+0.957)#193 | 6.2%(+1.57)#7,948 |
| 7. | 38111 | 7.3% | 6.9%(+0.394)#231 | 6.2%(+1.01)#9,539 |
| 8. | 38119 | 7.0% | 6.9%(+0.145)#251 | 6.2%(+0.761)#10,339 |
| 9. | 38135 | 6.4% | 6.9%(-0.426)#287 | 6.2%(+0.190)#12,258 |
| 10. | 38107 | 6.1% | 6.9%(-0.805)#322 | 6.2%(-0.188)#13,657 |
| 11. | 38112 | 5.4% | 6.9%(-1.48)#373 | 6.2%(-0.862)#16,232 |
| 12. | 38127 | 5.2% | 6.9%(-1.64)#383 | 6.2%(-1.02)#16,850 |
| 13. | 38141 | 4.8% | 6.9%(-2.02)#401 | 6.2%(-1.41)#18,345 |
| 14. | 38116 | 4.7% | 6.9%(-2.15)#410 | 6.2%(-1.53)#18,800 |
| 15. | 38105 | 4.6% | 6.9%(-2.21)#413 | 6.2%(-1.60)#19,069 |
| 16. | 38114 | 4.6% | 6.9%(-2.22)#414 | 6.2%(-1.61)#19,115 |
| 17. | 38134 | 4.4% | 6.9%(-2.47)#433 | 6.2%(-1.85)#20,031 |
| 18. | 38122 | 4.1% | 6.9%(-2.72)#451 | 6.2%(-2.10)#20,903 |
| 19. | 38106 | 4.0% | 6.9%(-2.87)#458 | 6.2%(-2.26)#21,406 |
| 20. | 38128 | 3.2% | 6.9%(-3.67)#503 | 6.2%(-3.05)#23,799 |
| 21. | 38109 | 2.7% | 6.9%(-4.14)#517 | 6.2%(-3.52)#24,987 |
| 22. | 38115 | 2.6% | 6.9%(-4.25)#519 | 6.2%(-3.63)#25,234 |
| 23. | 38118 | 2.4% | 6.9%(-4.49)#525 | 6.2%(-3.87)#25,789 |
| 24. | 38108 | 2.2% | 6.9%(-4.71)#534 | 6.2%(-4.09)#26,197 |
| 25. | 38126 | 1.6% | 6.9%(-5.26)#546 | 6.2%(-4.64)#27,080 |
1
Common Questions
What are the Top 10 Zip Codes with the Highest Percentage of Population Employed in Health Diagnosing & Treating in Memphis, TN?
Top 10 Zip Codes with the Highest Percentage of Population Employed in Health Diagnosing & Treating in Memphis, TN are:
What zip code has the Highest Percentage of Population Employed in Health Diagnosing & Treating in Memphis, TN?
38103 has the Highest Percentage of Population Employed in Health Diagnosing & Treating in Memphis, TN with 14.9%.
What is the Percentage of Population Employed in Health Diagnosing & Treating in Memphis, TN?
Percentage of Population Employed in Health Diagnosing & Treating in Memphis is 5.5%.
What is the Percentage of Population Employed in Health Diagnosing & Treating in Tennessee?
Percentage of Population Employed in Health Diagnosing & Treating in Tennessee is 6.9%.
What is the Percentage of Population Employed in Health Diagnosing & Treating in the United States?
Percentage of Population Employed in Health Diagnosing & Treating in the United States is 6.2%.