Zip Codes with the Highest Percentage of Population Employed in Office & Administration in Memphis, TN
RELATED REPORTS & OPTIONS
Office & Administration
Memphis
Compare Zip Codes
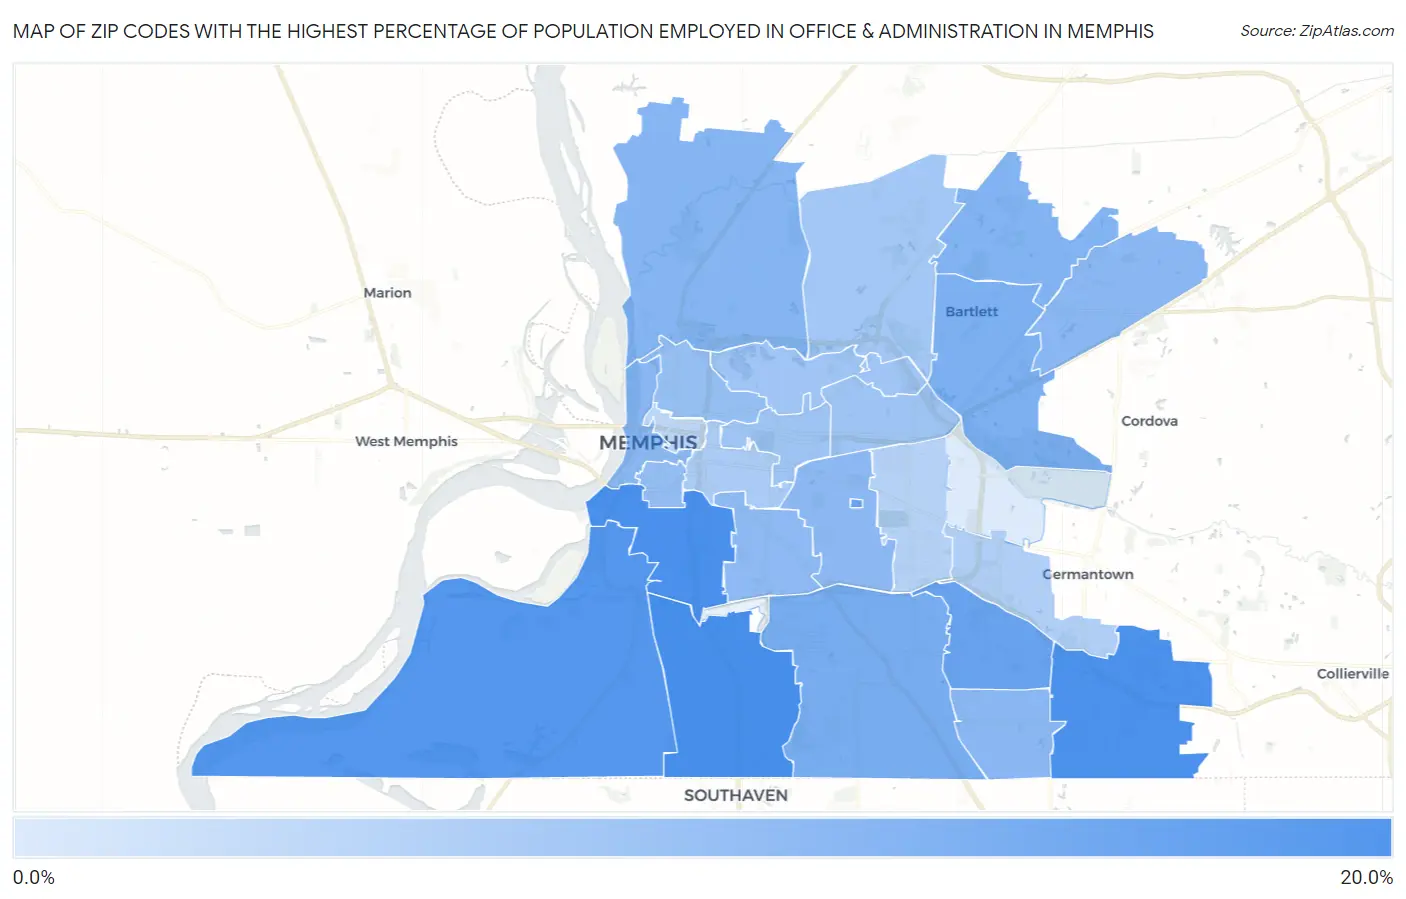
Map of Zip Codes with the Highest Percentage of Population Employed in Office & Administration in Memphis
0.0%
20.0%
Zip Codes with the Highest Percentage of Population Employed in Office & Administration in Memphis, TN
| Zip Code | % Employed | vs State | vs National | |
| 1. | 38116 | 18.8% | 11.3%(+7.44)#29 | 10.9%(+7.90)#2,054 |
| 2. | 38106 | 18.5% | 11.3%(+7.18)#32 | 10.9%(+7.64)#2,143 |
| 3. | 38125 | 18.4% | 11.3%(+7.13)#35 | 10.9%(+7.59)#2,166 |
| 4. | 38109 | 17.5% | 11.3%(+6.18)#45 | 10.9%(+6.64)#2,592 |
| 5. | 38152 | 16.1% | 11.3%(+4.76)#63 | 10.9%(+5.22)#3,501 |
| 6. | 38115 | 16.0% | 11.3%(+4.71)#64 | 10.9%(+5.17)#3,528 |
| 7. | 38118 | 14.7% | 11.3%(+3.39)#88 | 10.9%(+3.85)#4,954 |
| 8. | 38134 | 14.2% | 11.3%(+2.93)#98 | 10.9%(+3.39)#5,649 |
| 9. | 38135 | 14.0% | 11.3%(+2.64)#106 | 10.9%(+3.10)#6,092 |
| 10. | 38127 | 13.5% | 11.3%(+2.16)#128 | 10.9%(+2.62)#6,972 |
| 11. | 38141 | 13.2% | 11.3%(+1.84)#141 | 10.9%(+2.30)#7,687 |
| 12. | 38103 | 13.1% | 11.3%(+1.74)#148 | 10.9%(+2.20)#7,939 |
| 13. | 38133 | 13.1% | 11.3%(+1.73)#149 | 10.9%(+2.19)#7,952 |
| 14. | 38111 | 12.8% | 11.3%(+1.53)#157 | 10.9%(+1.99)#8,422 |
| 15. | 38114 | 12.8% | 11.3%(+1.52)#158 | 10.9%(+1.99)#8,437 |
| 16. | 38126 | 12.4% | 11.3%(+1.12)#175 | 10.9%(+1.59)#9,450 |
| 17. | 38107 | 12.1% | 11.3%(+0.812)#194 | 10.9%(+1.27)#10,348 |
| 18. | 38122 | 11.5% | 11.3%(+0.136)#237 | 10.9%(+0.597)#12,372 |
| 19. | 38112 | 11.4% | 11.3%(+0.078)#241 | 10.9%(+0.539)#12,558 |
| 20. | 38108 | 11.3% | 11.3%(+0.025)#249 | 10.9%(+0.487)#12,746 |
| 21. | 38128 | 11.0% | 11.3%(-0.294)#272 | 10.9%(+0.167)#13,756 |
| 22. | 38104 | 10.6% | 11.3%(-0.745)#292 | 10.9%(-0.284)#15,224 |
| 23. | 38119 | 9.9% | 11.3%(-1.41)#337 | 10.9%(-0.950)#17,425 |
| 24. | 38117 | 9.5% | 11.3%(-1.81)#366 | 10.9%(-1.35)#18,726 |
| 25. | 38105 | 9.1% | 11.3%(-2.20)#397 | 10.9%(-1.74)#19,901 |
| 26. | 38120 | 6.5% | 11.3%(-4.80)#513 | 10.9%(-4.34)#26,070 |
1
Common Questions
What are the Top 10 Zip Codes with the Highest Percentage of Population Employed in Office & Administration in Memphis, TN?
Top 10 Zip Codes with the Highest Percentage of Population Employed in Office & Administration in Memphis, TN are:
What zip code has the Highest Percentage of Population Employed in Office & Administration in Memphis, TN?
38116 has the Highest Percentage of Population Employed in Office & Administration in Memphis, TN with 18.8%.
What is the Percentage of Population Employed in Office & Administration in Memphis, TN?
Percentage of Population Employed in Office & Administration in Memphis is 13.4%.
What is the Percentage of Population Employed in Office & Administration in Tennessee?
Percentage of Population Employed in Office & Administration in Tennessee is 11.3%.
What is the Percentage of Population Employed in Office & Administration in the United States?
Percentage of Population Employed in Office & Administration in the United States is 10.9%.