Zip Codes with the Highest Percentage of Population with a Degree in Visual and Performing Arts in Cordova, TN
RELATED REPORTS & OPTIONS
Visual and Performing Arts
Cordova
Compare Zip Codes
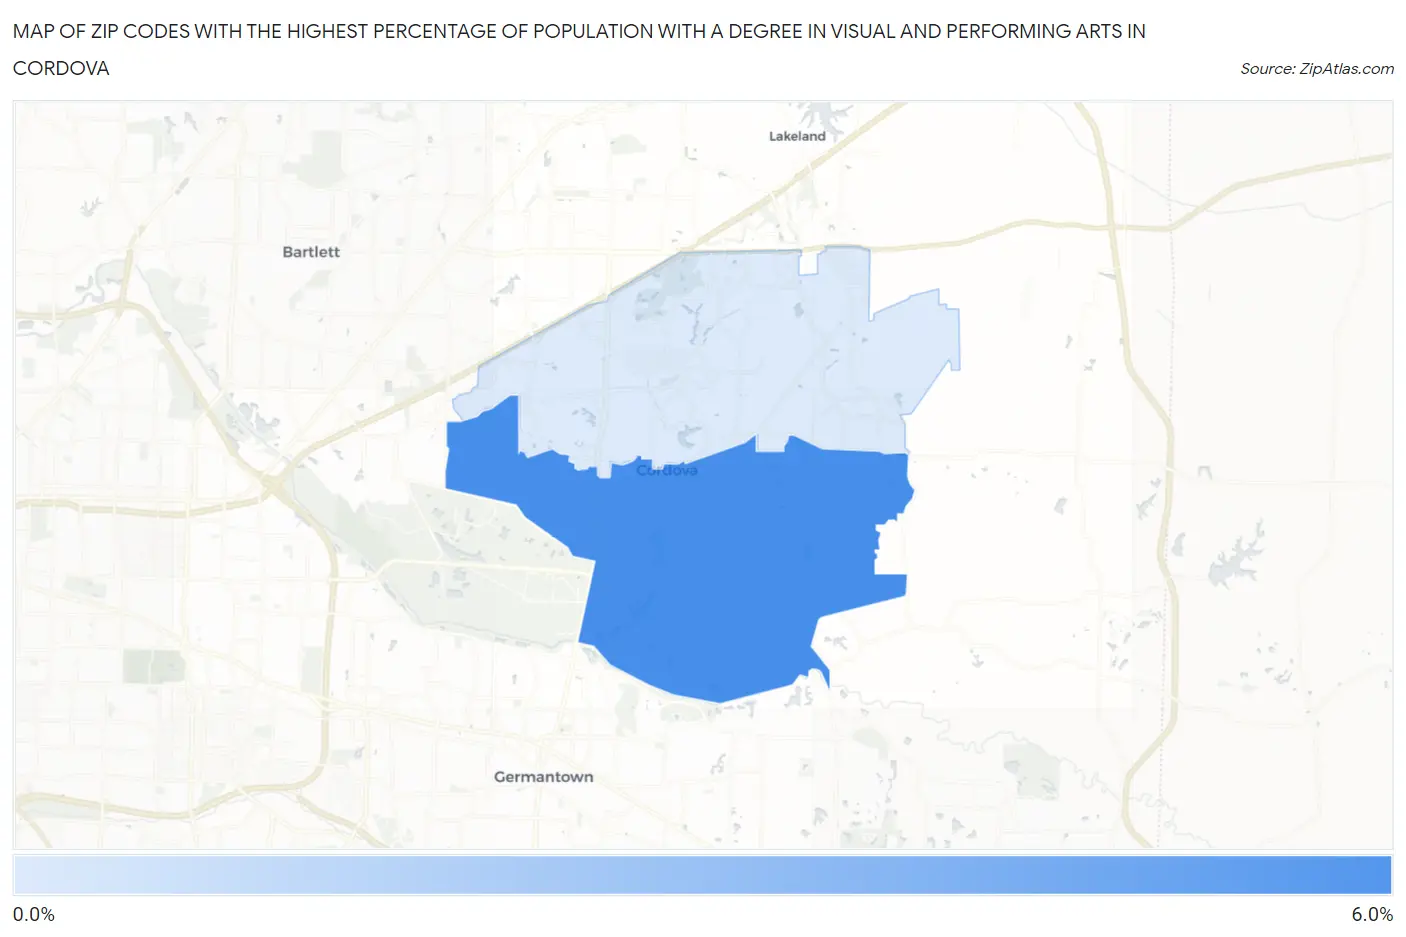
Map of Zip Codes with the Highest Percentage of Population with a Degree in Visual and Performing Arts in Cordova
0.0%
6.0%
Zip Codes with the Highest Percentage of Population with a Degree in Visual and Performing Arts in Cordova, TN
| Zip Code | % Graduates | vs State | vs National | |
| 1. | 38018 | 5.9% | 4.1%(+1.88)#100 | 4.3%(+1.69)#4,946 |
| 2. | 38016 | 1.1% | 4.1%(-2.92)#353 | 4.3%(-3.10)#19,239 |
1
Common Questions
What are the Top Zip Codes with the Highest Percentage of Population with a Degree in Visual and Performing Arts in Cordova, TN?
Top Zip Codes with the Highest Percentage of Population with a Degree in Visual and Performing Arts in Cordova, TN are:
What zip code has the Highest Percentage of Population with a Degree in Visual and Performing Arts in Cordova, TN?
38018 has the Highest Percentage of Population with a Degree in Visual and Performing Arts in Cordova, TN with 5.9%.
What is the Percentage of Population with a Degree in Visual and Performing Arts in Tennessee?
Percentage of Population with a Degree in Visual and Performing Arts in Tennessee is 4.1%.
What is the Percentage of Population with a Degree in Visual and Performing Arts in the United States?
Percentage of Population with a Degree in Visual and Performing Arts in the United States is 4.3%.