Zip Codes with the Highest Percentage of Population Employed in Food Preparation & Serving in Lexington, SC
RELATED REPORTS & OPTIONS
Food Preparation & Serving
Lexington
Compare Zip Codes
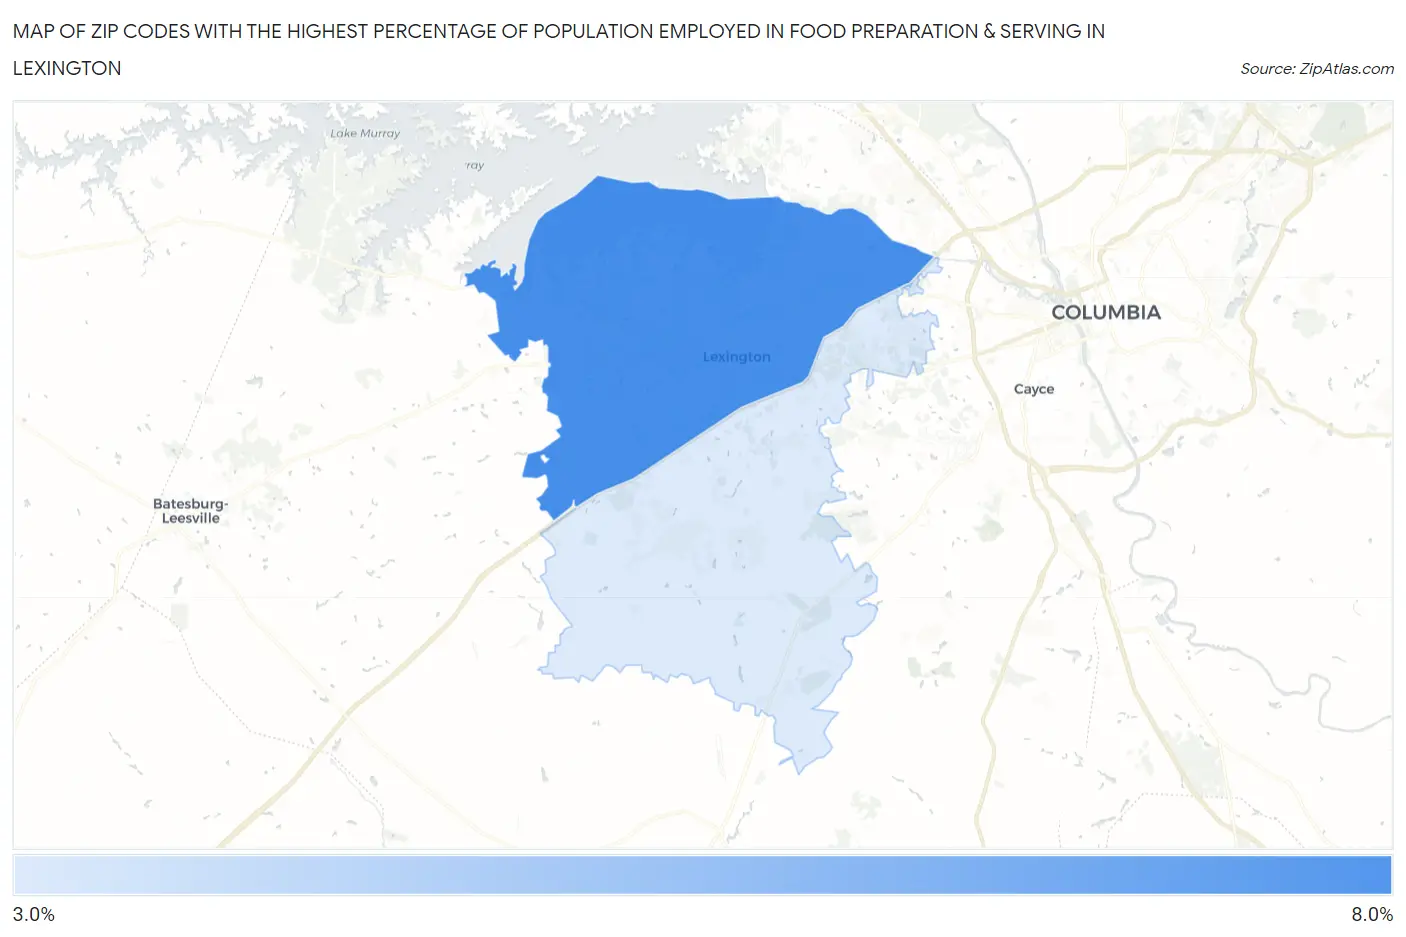
Map of Zip Codes with the Highest Percentage of Population Employed in Food Preparation & Serving in Lexington
0.0%
8.0%
Zip Codes with the Highest Percentage of Population Employed in Food Preparation & Serving in Lexington, SC
| Zip Code | % Employed | vs State | vs National | |
| 1. | 29072 | 6.1% | 5.8%(+0.332)#145 | 5.3%(+0.815)#9,019 |
| 2. | 29073 | 4.0% | 5.8%(-1.81)#250 | 5.3%(-1.33)#17,304 |
1
Common Questions
What are the Top Zip Codes with the Highest Percentage of Population Employed in Food Preparation & Serving in Lexington, SC?
Top Zip Codes with the Highest Percentage of Population Employed in Food Preparation & Serving in Lexington, SC are:
What zip code has the Highest Percentage of Population Employed in Food Preparation & Serving in Lexington, SC?
29072 has the Highest Percentage of Population Employed in Food Preparation & Serving in Lexington, SC with 6.1%.
What is the Percentage of Population Employed in Food Preparation & Serving in Lexington, SC?
Percentage of Population Employed in Food Preparation & Serving in Lexington is 8.1%.
What is the Percentage of Population Employed in Food Preparation & Serving in South Carolina?
Percentage of Population Employed in Food Preparation & Serving in South Carolina is 5.8%.
What is the Percentage of Population Employed in Food Preparation & Serving in the United States?
Percentage of Population Employed in Food Preparation & Serving in the United States is 5.3%.