Zip Codes with the Highest Percentage of Population Employed in Food Preparation & Serving in North Charleston, SC
RELATED REPORTS & OPTIONS
Food Preparation & Serving
North Charleston
Compare Zip Codes
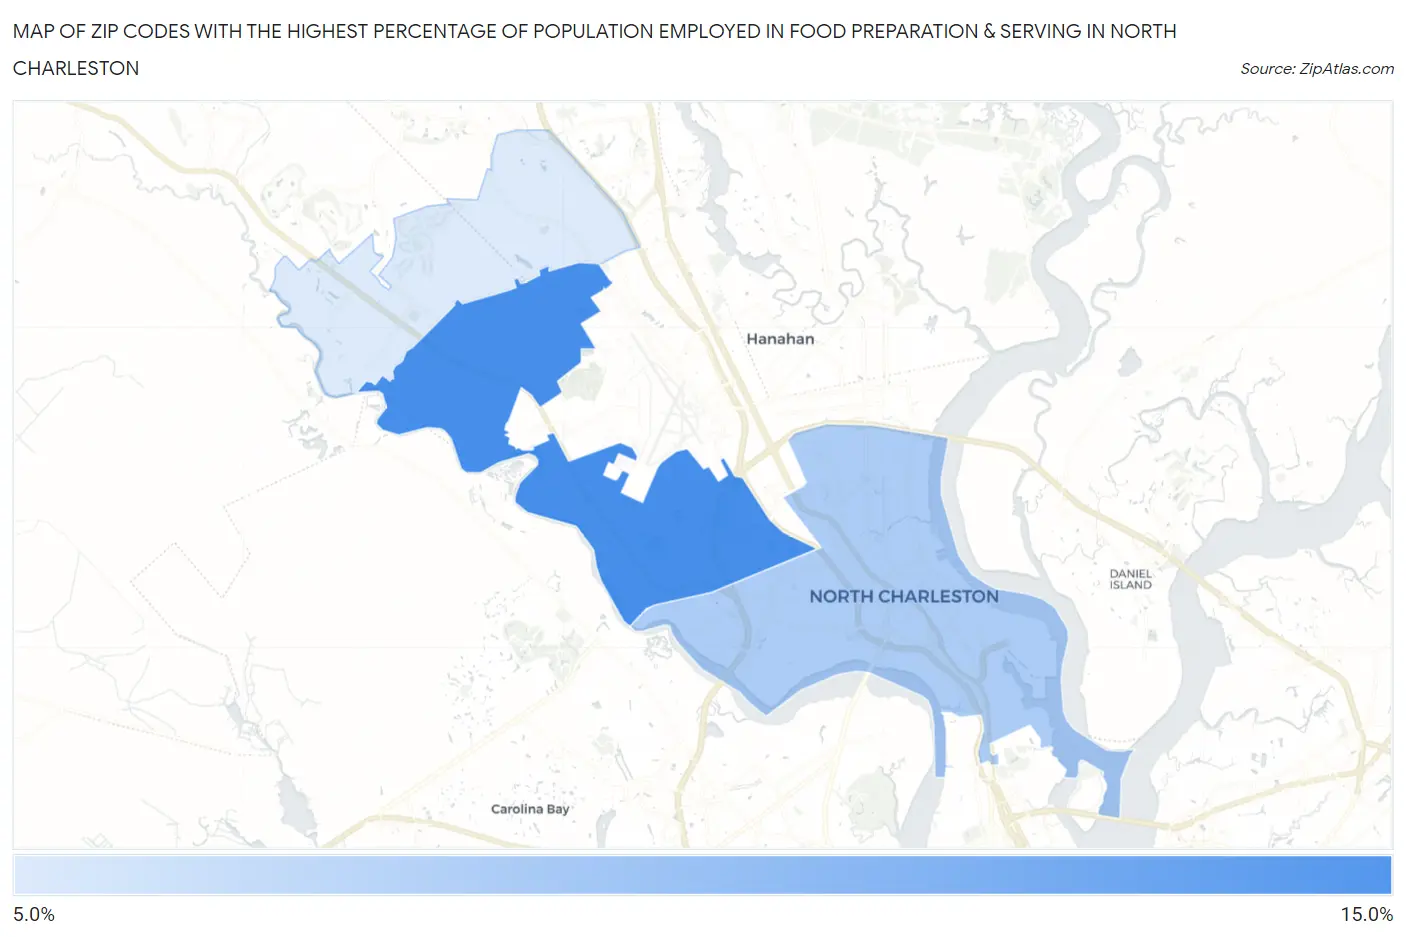
Map of Zip Codes with the Highest Percentage of Population Employed in Food Preparation & Serving in North Charleston
0.0%
15.0%
Zip Codes with the Highest Percentage of Population Employed in Food Preparation & Serving in North Charleston, SC
| Zip Code | % Employed | vs State | vs National | |
| 1. | 29418 | 10.1% | 5.8%(+4.37)#50 | 5.3%(+4.85)#2,531 |
| 2. | 29405 | 7.6% | 5.8%(+1.79)#97 | 5.3%(+2.27)#5,446 |
| 3. | 29420 | 6.3% | 5.8%(+0.540)#135 | 5.3%(+1.02)#8,409 |
1
Common Questions
What are the Top Zip Codes with the Highest Percentage of Population Employed in Food Preparation & Serving in North Charleston, SC?
Top Zip Codes with the Highest Percentage of Population Employed in Food Preparation & Serving in North Charleston, SC are:
What zip code has the Highest Percentage of Population Employed in Food Preparation & Serving in North Charleston, SC?
29418 has the Highest Percentage of Population Employed in Food Preparation & Serving in North Charleston, SC with 10.1%.
What is the Percentage of Population Employed in Food Preparation & Serving in North Charleston, SC?
Percentage of Population Employed in Food Preparation & Serving in North Charleston is 6.7%.
What is the Percentage of Population Employed in Food Preparation & Serving in South Carolina?
Percentage of Population Employed in Food Preparation & Serving in South Carolina is 5.8%.
What is the Percentage of Population Employed in Food Preparation & Serving in the United States?
Percentage of Population Employed in Food Preparation & Serving in the United States is 5.3%.