Zip Codes with the Highest Percentage of Population Employed in Legal Services & Support in Lexington, SC
RELATED REPORTS & OPTIONS
Legal Services & Support
Lexington
Compare Zip Codes
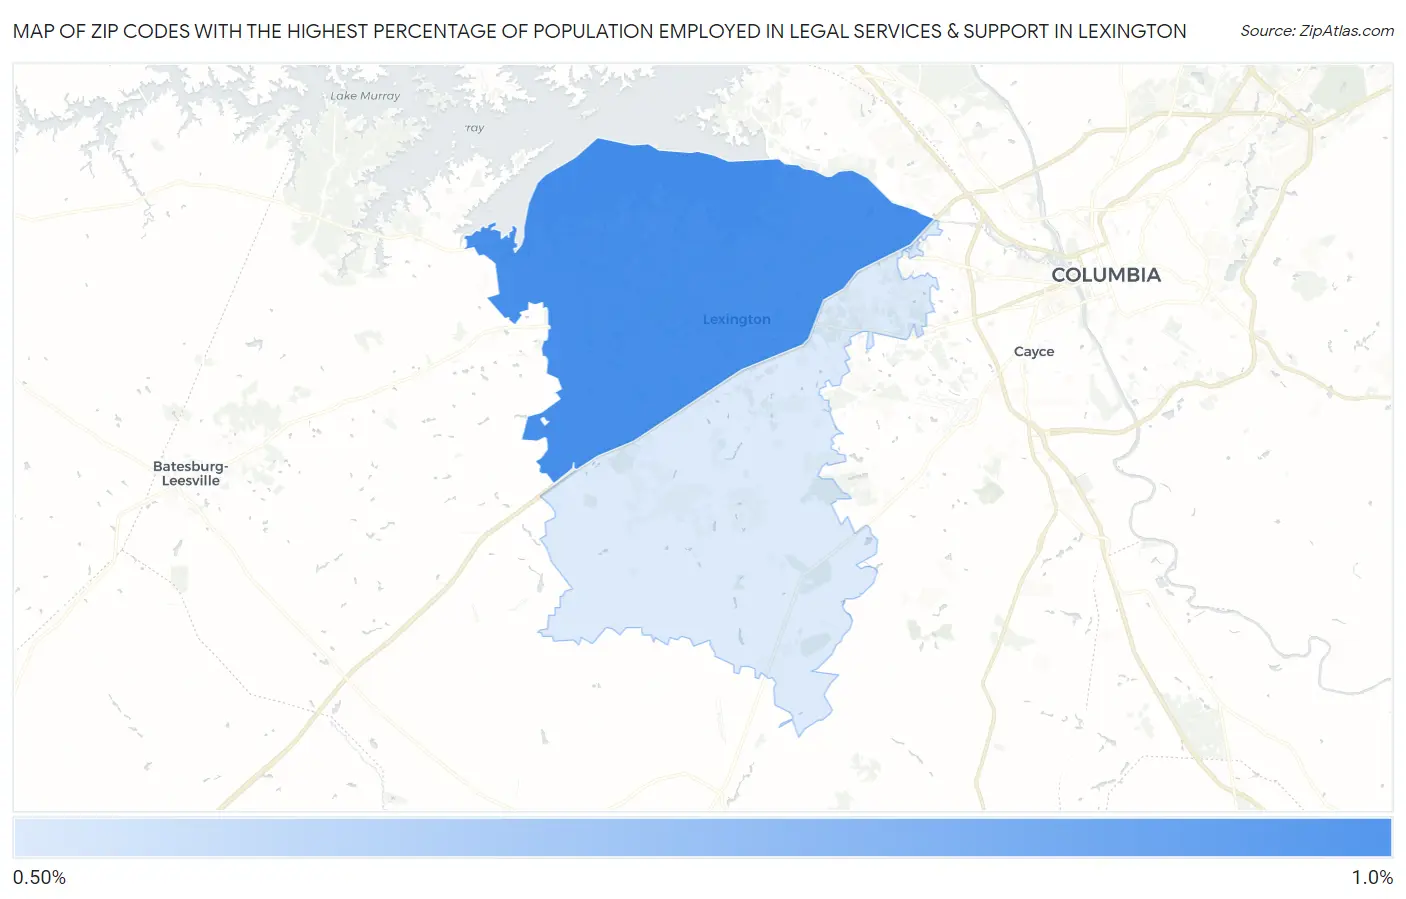
Map of Zip Codes with the Highest Percentage of Population Employed in Legal Services & Support in Lexington
0.0%
1.0%
Zip Codes with the Highest Percentage of Population Employed in Legal Services & Support in Lexington, SC
| Zip Code | % Employed | vs State | vs National | |
| 1. | 29072 | 0.96% | 0.97%(-0.010)#94 | 1.2%(-0.220)#8,090 |
| 2. | 29073 | 0.55% | 0.97%(-0.429)#145 | 1.2%(-0.638)#12,103 |
1
Common Questions
What are the Top Zip Codes with the Highest Percentage of Population Employed in Legal Services & Support in Lexington, SC?
Top Zip Codes with the Highest Percentage of Population Employed in Legal Services & Support in Lexington, SC are:
What zip code has the Highest Percentage of Population Employed in Legal Services & Support in Lexington, SC?
29072 has the Highest Percentage of Population Employed in Legal Services & Support in Lexington, SC with 0.96%.
What is the Percentage of Population Employed in Legal Services & Support in Lexington, SC?
Percentage of Population Employed in Legal Services & Support in Lexington is 1.2%.
What is the Percentage of Population Employed in Legal Services & Support in South Carolina?
Percentage of Population Employed in Legal Services & Support in South Carolina is 0.97%.
What is the Percentage of Population Employed in Legal Services & Support in the United States?
Percentage of Population Employed in Legal Services & Support in the United States is 1.2%.