Zip Codes with the Highest Percentage of Population Employed in Food Preparation & Serving in Aiken, SC
RELATED REPORTS & OPTIONS
Food Preparation & Serving
Aiken
Compare Zip Codes
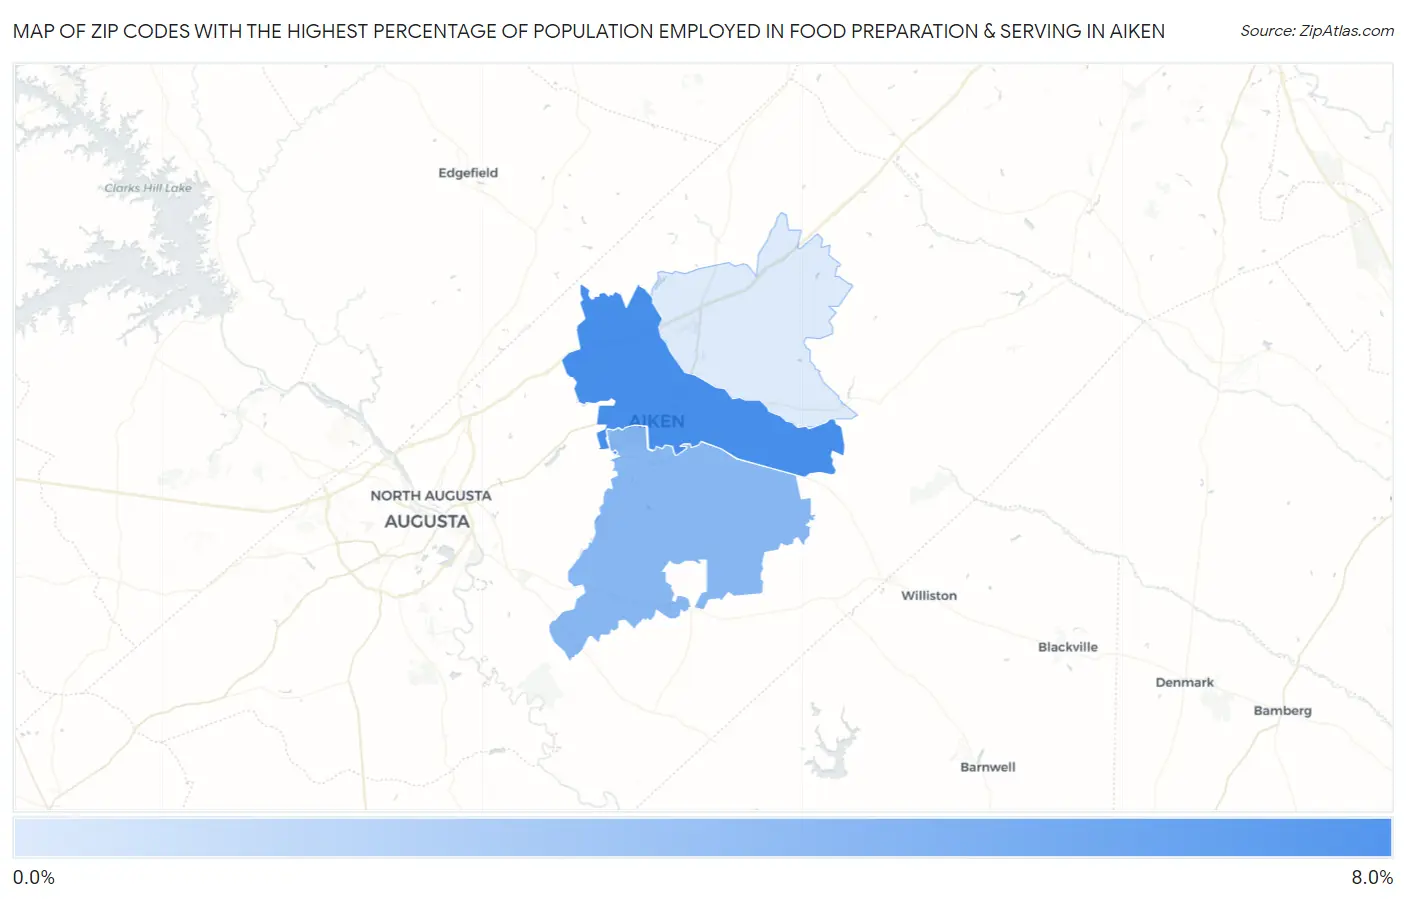
Map of Zip Codes with the Highest Percentage of Population Employed in Food Preparation & Serving in Aiken
0.0%
8.0%
Zip Codes with the Highest Percentage of Population Employed in Food Preparation & Serving in Aiken, SC
| Zip Code | % Employed | vs State | vs National | |
| 1. | 29801 | 7.0% | 5.8%(+1.25)#108 | 5.3%(+1.74)#6,506 |
| 2. | 29803 | 3.9% | 5.8%(-1.86)#253 | 5.3%(-1.37)#17,485 |
| 3. | 29805 | 0.046% | 5.8%(-5.72)#374 | 5.3%(-5.24)#27,940 |
1
Common Questions
What are the Top Zip Codes with the Highest Percentage of Population Employed in Food Preparation & Serving in Aiken, SC?
Top Zip Codes with the Highest Percentage of Population Employed in Food Preparation & Serving in Aiken, SC are:
What zip code has the Highest Percentage of Population Employed in Food Preparation & Serving in Aiken, SC?
29801 has the Highest Percentage of Population Employed in Food Preparation & Serving in Aiken, SC with 7.0%.
What is the Percentage of Population Employed in Food Preparation & Serving in Aiken, SC?
Percentage of Population Employed in Food Preparation & Serving in Aiken is 7.8%.
What is the Percentage of Population Employed in Food Preparation & Serving in South Carolina?
Percentage of Population Employed in Food Preparation & Serving in South Carolina is 5.8%.
What is the Percentage of Population Employed in Food Preparation & Serving in the United States?
Percentage of Population Employed in Food Preparation & Serving in the United States is 5.3%.