Zip Codes with the Highest Percentage of Population with a Degree in Science and Engineering in Lexington, SC
RELATED REPORTS & OPTIONS
Science and Engineering
Lexington
Compare Zip Codes
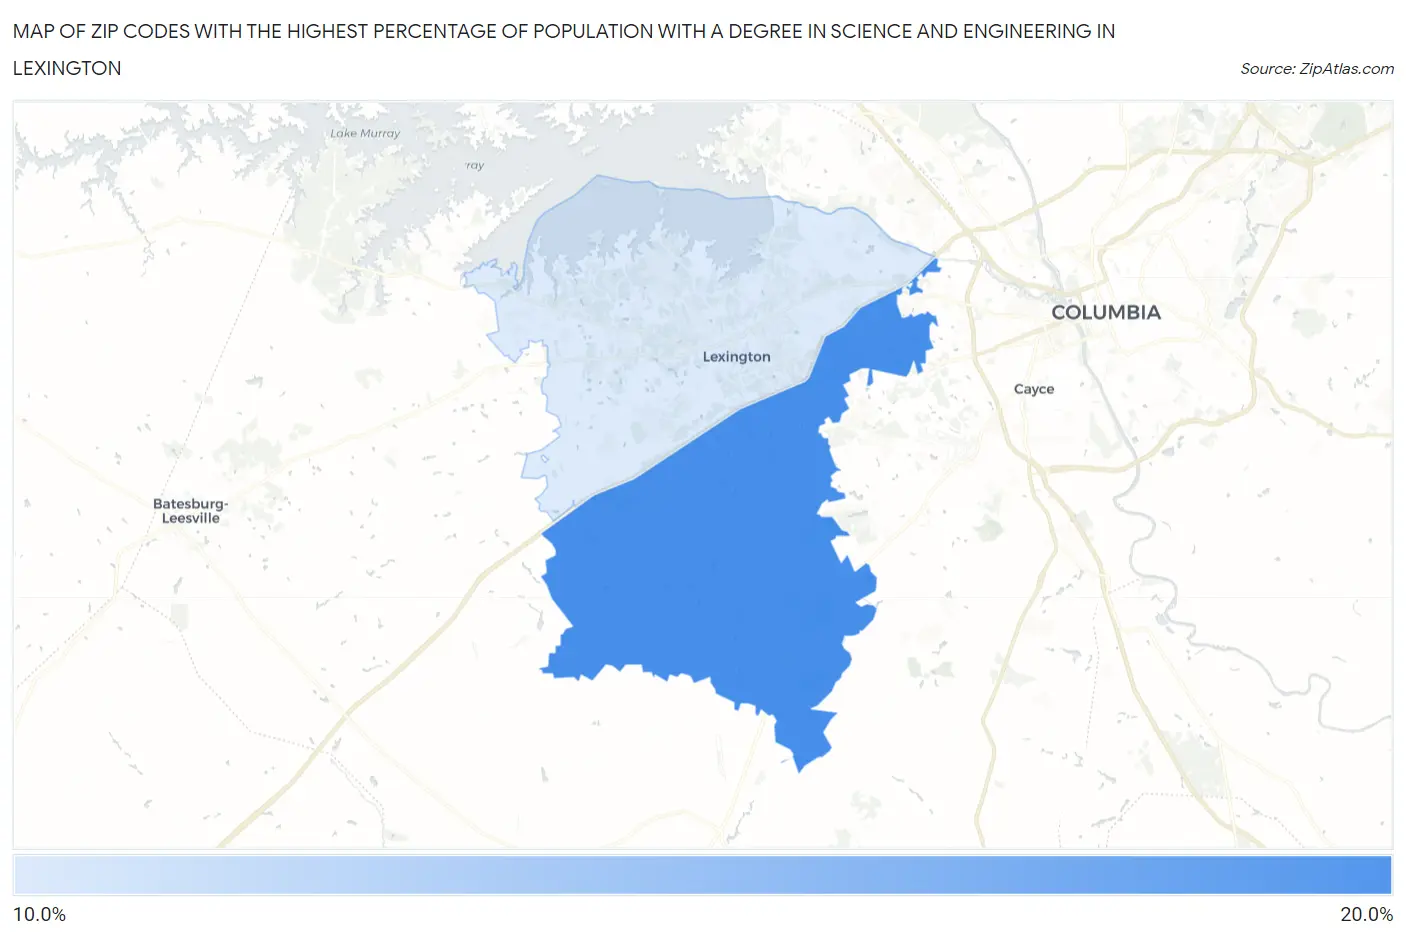
Map of Zip Codes with the Highest Percentage of Population with a Degree in Science and Engineering in Lexington
0.0%
20.0%
Zip Codes with the Highest Percentage of Population with a Degree in Science and Engineering in Lexington, SC
| Zip Code | % Graduates | vs State | vs National | |
| 1. | 29073 | 15.8% | 10.2%(+5.55)#64 | 9.8%(+5.99)#5,923 |
| 2. | 29072 | 11.4% | 10.2%(+1.23)#138 | 9.8%(+1.66)#11,939 |
1
Common Questions
What are the Top Zip Codes with the Highest Percentage of Population with a Degree in Science and Engineering in Lexington, SC?
Top Zip Codes with the Highest Percentage of Population with a Degree in Science and Engineering in Lexington, SC are:
What zip code has the Highest Percentage of Population with a Degree in Science and Engineering in Lexington, SC?
29073 has the Highest Percentage of Population with a Degree in Science and Engineering in Lexington, SC with 15.8%.
What is the Percentage of Population with a Degree in Science and Engineering in Lexington, SC?
Percentage of Population with a Degree in Science and Engineering in Lexington is 10.2%.
What is the Percentage of Population with a Degree in Science and Engineering in South Carolina?
Percentage of Population with a Degree in Science and Engineering in South Carolina is 10.2%.
What is the Percentage of Population with a Degree in Science and Engineering in the United States?
Percentage of Population with a Degree in Science and Engineering in the United States is 9.8%.