Zip Codes with the Highest Percentage of Population Employed in Food Preparation & Serving in Spartanburg, SC
RELATED REPORTS & OPTIONS
Food Preparation & Serving
Spartanburg
Compare Zip Codes
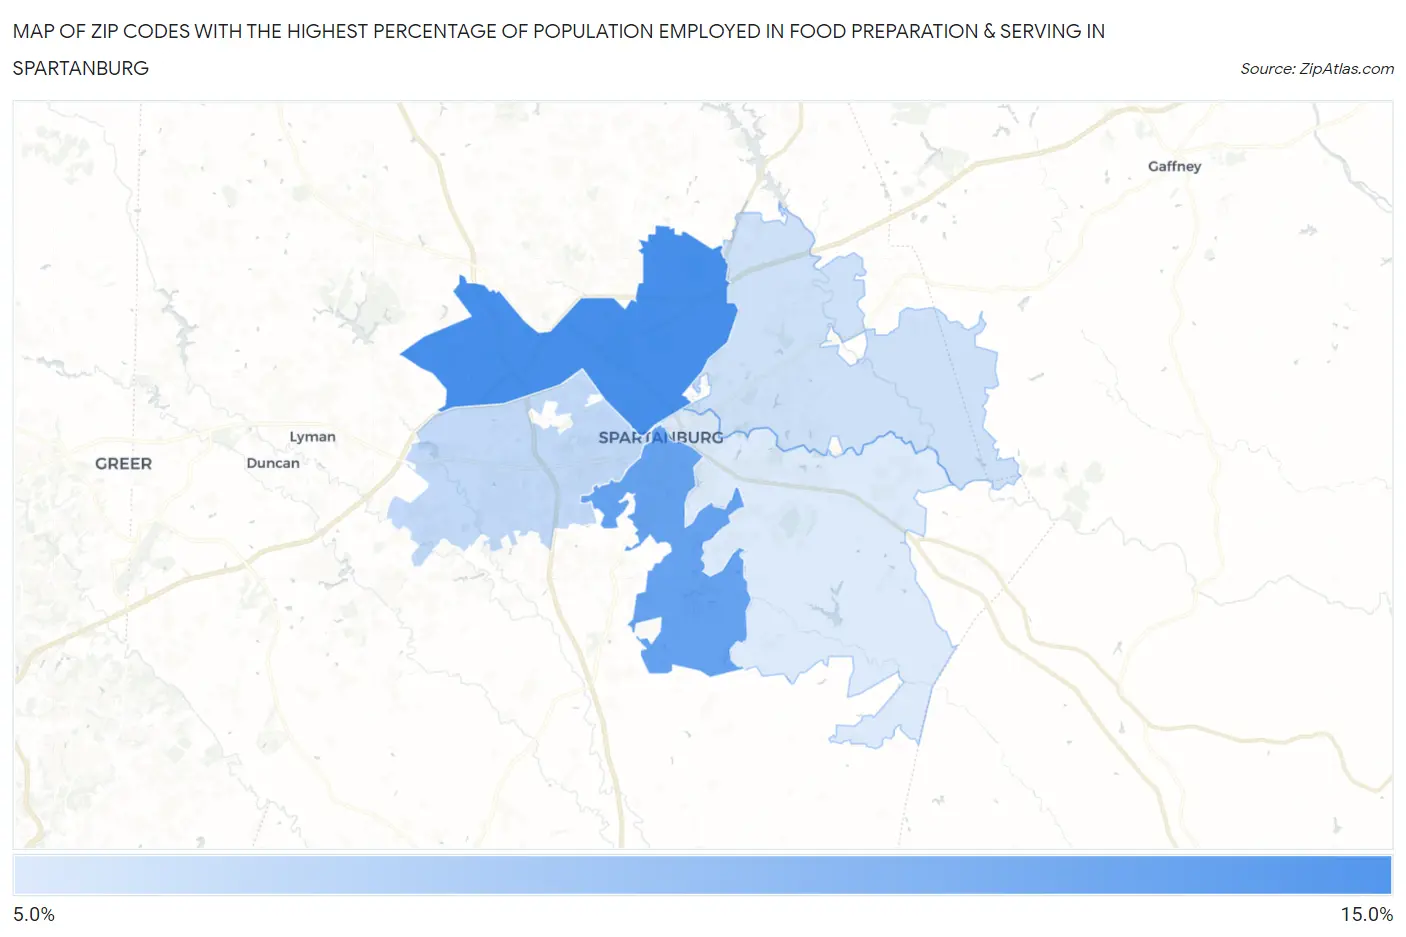
Map of Zip Codes with the Highest Percentage of Population Employed in Food Preparation & Serving in Spartanburg
0.0%
15.0%
Zip Codes with the Highest Percentage of Population Employed in Food Preparation & Serving in Spartanburg, SC
| Zip Code | % Employed | vs State | vs National | |
| 1. | 29303 | 10.9% | 5.8%(+5.10)#40 | 5.3%(+5.58)#2,127 |
| 2. | 29306 | 9.7% | 5.8%(+3.92)#55 | 5.3%(+4.40)#2,894 |
| 3. | 29301 | 6.2% | 5.8%(+0.444)#139 | 5.3%(+0.928)#8,696 |
| 4. | 29307 | 5.7% | 5.8%(-0.101)#167 | 5.3%(+0.382)#10,461 |
| 5. | 29302 | 5.2% | 5.8%(-0.585)#188 | 5.3%(-0.102)#12,222 |
1
Common Questions
What are the Top 3 Zip Codes with the Highest Percentage of Population Employed in Food Preparation & Serving in Spartanburg, SC?
Top 3 Zip Codes with the Highest Percentage of Population Employed in Food Preparation & Serving in Spartanburg, SC are:
What zip code has the Highest Percentage of Population Employed in Food Preparation & Serving in Spartanburg, SC?
29303 has the Highest Percentage of Population Employed in Food Preparation & Serving in Spartanburg, SC with 10.9%.
What is the Percentage of Population Employed in Food Preparation & Serving in Spartanburg, SC?
Percentage of Population Employed in Food Preparation & Serving in Spartanburg is 7.6%.
What is the Percentage of Population Employed in Food Preparation & Serving in South Carolina?
Percentage of Population Employed in Food Preparation & Serving in South Carolina is 5.8%.
What is the Percentage of Population Employed in Food Preparation & Serving in the United States?
Percentage of Population Employed in Food Preparation & Serving in the United States is 5.3%.