Zip Codes with the Highest Percentage of Population Employed in Food Preparation & Serving in Anderson, SC
RELATED REPORTS & OPTIONS
Food Preparation & Serving
Anderson
Compare Zip Codes
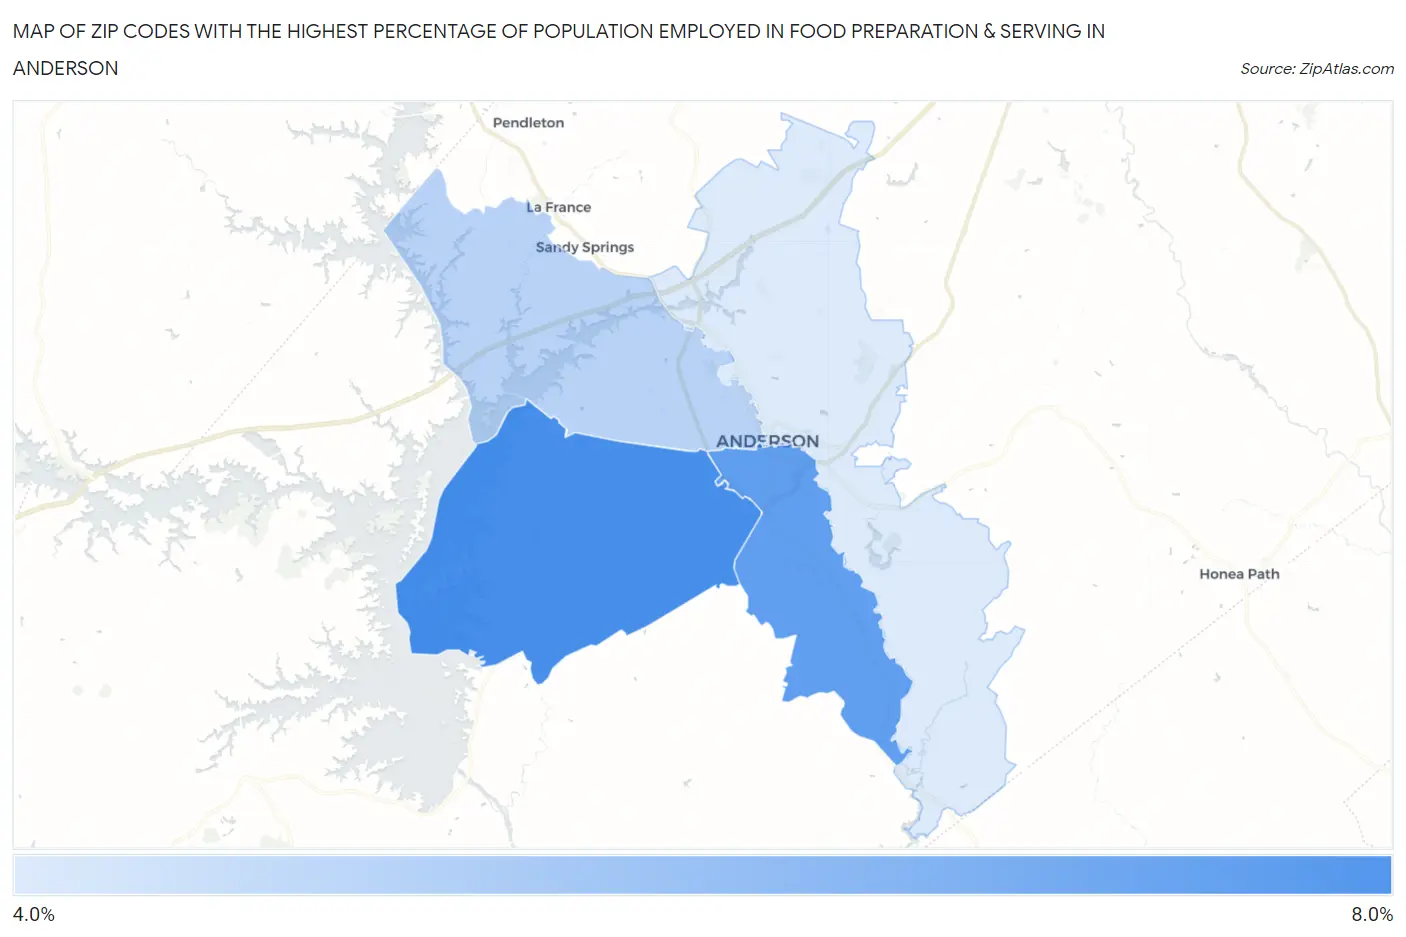
Map of Zip Codes with the Highest Percentage of Population Employed in Food Preparation & Serving in Anderson
0.0%
8.0%
Zip Codes with the Highest Percentage of Population Employed in Food Preparation & Serving in Anderson, SC
| Zip Code | % Employed | vs State | vs National | |
| 1. | 29626 | 7.7% | 5.8%(+1.94)#89 | 5.3%(+2.43)#5,187 |
| 2. | 29624 | 7.2% | 5.8%(+1.43)#104 | 5.3%(+1.91)#6,140 |
| 3. | 29625 | 5.4% | 5.8%(-0.342)#178 | 5.3%(+0.142)#11,313 |
| 4. | 29621 | 4.7% | 5.8%(-1.07)#206 | 5.3%(-0.584)#14,154 |
1
Common Questions
What are the Top 3 Zip Codes with the Highest Percentage of Population Employed in Food Preparation & Serving in Anderson, SC?
Top 3 Zip Codes with the Highest Percentage of Population Employed in Food Preparation & Serving in Anderson, SC are:
What zip code has the Highest Percentage of Population Employed in Food Preparation & Serving in Anderson, SC?
29626 has the Highest Percentage of Population Employed in Food Preparation & Serving in Anderson, SC with 7.7%.
What is the Percentage of Population Employed in Food Preparation & Serving in Anderson, SC?
Percentage of Population Employed in Food Preparation & Serving in Anderson is 7.7%.
What is the Percentage of Population Employed in Food Preparation & Serving in South Carolina?
Percentage of Population Employed in Food Preparation & Serving in South Carolina is 5.8%.
What is the Percentage of Population Employed in Food Preparation & Serving in the United States?
Percentage of Population Employed in Food Preparation & Serving in the United States is 5.3%.