Zip Codes with the Highest Percentage of Population Employed in Food Preparation & Serving in Myrtle Beach, SC
RELATED REPORTS & OPTIONS
Food Preparation & Serving
Myrtle Beach
Compare Zip Codes
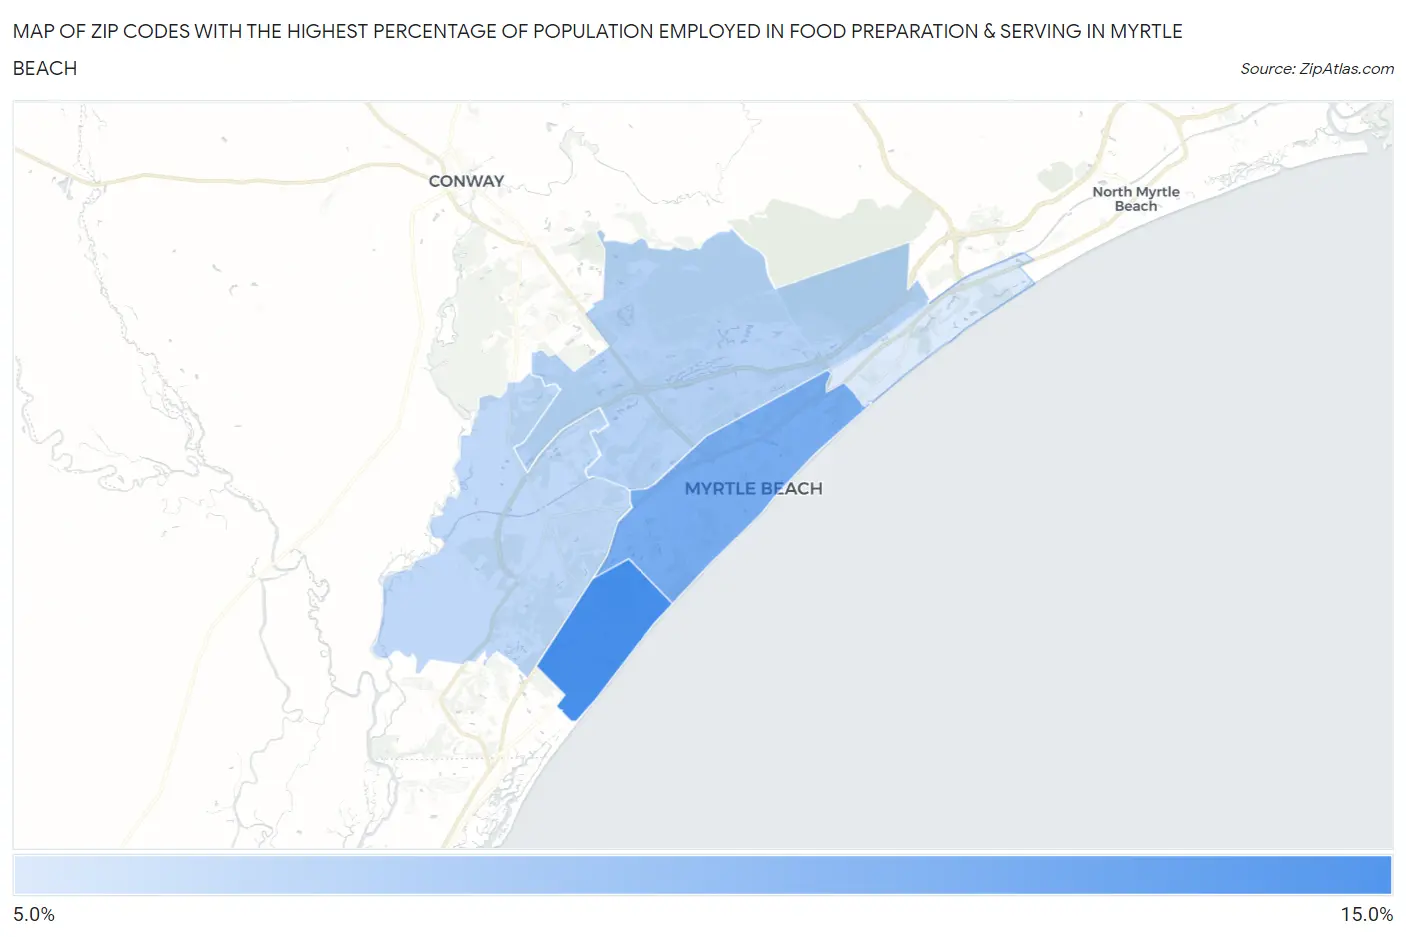
Map of Zip Codes with the Highest Percentage of Population Employed in Food Preparation & Serving in Myrtle Beach
0.0%
15.0%
Zip Codes with the Highest Percentage of Population Employed in Food Preparation & Serving in Myrtle Beach, SC
| Zip Code | % Employed | vs State | vs National | |
| 1. | 29575 | 12.1% | 5.8%(+6.29)#31 | 5.3%(+6.78)#1,641 |
| 2. | 29577 | 10.6% | 5.8%(+4.87)#44 | 5.3%(+5.35)#2,241 |
| 3. | 29579 | 8.8% | 5.8%(+3.03)#69 | 5.3%(+3.51)#3,731 |
| 4. | 29588 | 8.5% | 5.8%(+2.77)#73 | 5.3%(+3.25)#4,034 |
| 5. | 29572 | 7.7% | 5.8%(+1.91)#92 | 5.3%(+2.39)#5,247 |
1
Common Questions
What are the Top 3 Zip Codes with the Highest Percentage of Population Employed in Food Preparation & Serving in Myrtle Beach, SC?
Top 3 Zip Codes with the Highest Percentage of Population Employed in Food Preparation & Serving in Myrtle Beach, SC are:
What zip code has the Highest Percentage of Population Employed in Food Preparation & Serving in Myrtle Beach, SC?
29575 has the Highest Percentage of Population Employed in Food Preparation & Serving in Myrtle Beach, SC with 12.1%.
What is the Percentage of Population Employed in Food Preparation & Serving in Myrtle Beach, SC?
Percentage of Population Employed in Food Preparation & Serving in Myrtle Beach is 10.2%.
What is the Percentage of Population Employed in Food Preparation & Serving in South Carolina?
Percentage of Population Employed in Food Preparation & Serving in South Carolina is 5.8%.
What is the Percentage of Population Employed in Food Preparation & Serving in the United States?
Percentage of Population Employed in Food Preparation & Serving in the United States is 5.3%.