Immigrants from Senegal vs Immigrants from Romania Seniors Poverty Over the Age of 75
COMPARE
Immigrants from Senegal
Immigrants from Romania
Seniors Poverty Over the Age of 75
Seniors Poverty Over the Age of 75 Comparison
Immigrants from Senegal
Immigrants from Romania
14.8%
SENIORS POVERTY OVER THE AGE OF 75
0.0/ 100
METRIC RATING
282nd/ 347
METRIC RANK
11.9%
SENIORS POVERTY OVER THE AGE OF 75
72.6/ 100
METRIC RATING
138th/ 347
METRIC RANK
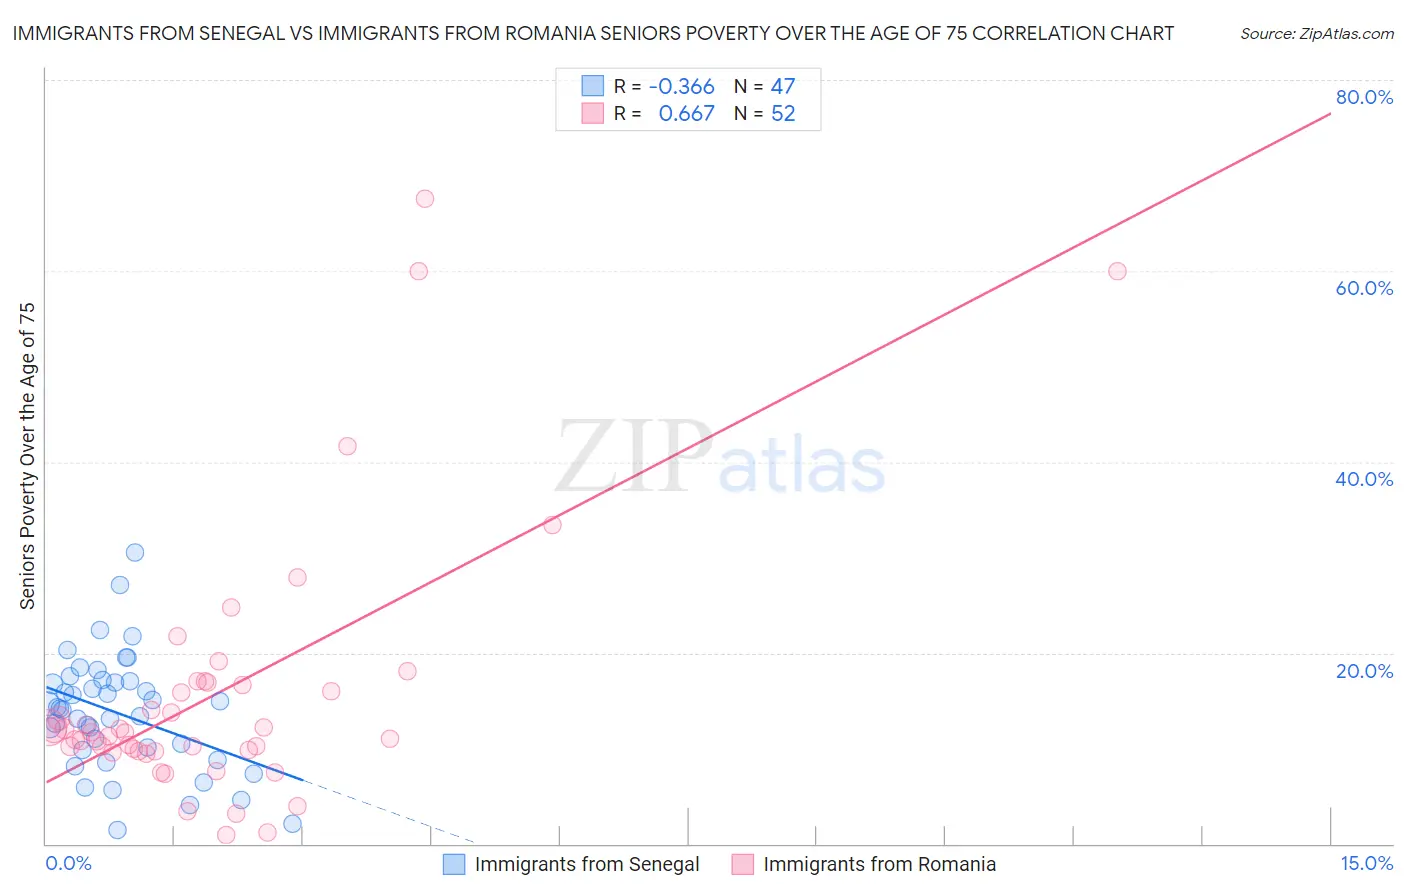
Immigrants from Senegal vs Immigrants from Romania Seniors Poverty Over the Age of 75 Correlation Chart
The statistical analysis conducted on geographies consisting of 89,840,643 people shows a mild negative correlation between the proportion of Immigrants from Senegal and poverty level among seniors over the age of 75 in the United States with a correlation coefficient (R) of -0.366 and weighted average of 14.8%. Similarly, the statistical analysis conducted on geographies consisting of 255,271,790 people shows a significant positive correlation between the proportion of Immigrants from Romania and poverty level among seniors over the age of 75 in the United States with a correlation coefficient (R) of 0.667 and weighted average of 11.9%, a difference of 23.7%.
Seniors Poverty Over the Age of 75 Correlation Summary
| Measurement | Immigrants from Senegal | Immigrants from Romania |
| Minimum | 1.5% | 0.92% |
| Maximum | 30.6% | 67.5% |
| Range | 29.1% | 66.6% |
| Mean | 13.7% | 15.7% |
| Median | 14.1% | 11.7% |
| Interquartile 25% (IQ1) | 9.8% | 9.8% |
| Interquartile 75% (IQ3) | 17.1% | 16.8% |
| Interquartile Range (IQR) | 7.2% | 7.0% |
| Standard Deviation (Sample) | 6.0% | 13.7% |
| Standard Deviation (Population) | 5.9% | 13.6% |
Similar Demographics by Seniors Poverty Over the Age of 75
Demographics Similar to Immigrants from Senegal by Seniors Poverty Over the Age of 75
In terms of seniors poverty over the age of 75, the demographic groups most similar to Immigrants from Senegal are Guatemalan (14.8%, a difference of 0.060%), Belizean (14.8%, a difference of 0.18%), Central American (14.7%, a difference of 0.29%), Cheyenne (14.9%, a difference of 0.70%), and Immigrants from Mexico (14.9%, a difference of 0.89%).
| Demographics | Rating | Rank | Seniors Poverty Over the Age of 75 |
| Immigrants | El Salvador | 0.0 /100 | #275 | Tragic 14.5% |
| Soviet Union | 0.0 /100 | #276 | Tragic 14.5% |
| Senegalese | 0.0 /100 | #277 | Tragic 14.5% |
| Immigrants | Colombia | 0.0 /100 | #278 | Tragic 14.6% |
| Blacks/African Americans | 0.0 /100 | #279 | Tragic 14.6% |
| Central Americans | 0.0 /100 | #280 | Tragic 14.7% |
| Belizeans | 0.0 /100 | #281 | Tragic 14.8% |
| Immigrants | Senegal | 0.0 /100 | #282 | Tragic 14.8% |
| Guatemalans | 0.0 /100 | #283 | Tragic 14.8% |
| Cheyenne | 0.0 /100 | #284 | Tragic 14.9% |
| Immigrants | Mexico | 0.0 /100 | #285 | Tragic 14.9% |
| Immigrants | Central America | 0.0 /100 | #286 | Tragic 15.0% |
| Immigrants | Guatemala | 0.0 /100 | #287 | Tragic 15.1% |
| Jamaicans | 0.0 /100 | #288 | Tragic 15.1% |
| Immigrants | Belize | 0.0 /100 | #289 | Tragic 15.2% |
Demographics Similar to Immigrants from Romania by Seniors Poverty Over the Age of 75
In terms of seniors poverty over the age of 75, the demographic groups most similar to Immigrants from Romania are Immigrants from Kenya (11.9%, a difference of 0.010%), Immigrants from Pakistan (12.0%, a difference of 0.080%), Immigrants from Cameroon (12.0%, a difference of 0.090%), Immigrants from Laos (12.0%, a difference of 0.12%), and Immigrants from Moldova (11.9%, a difference of 0.16%).
| Demographics | Rating | Rank | Seniors Poverty Over the Age of 75 |
| Immigrants | Western Europe | 79.6 /100 | #131 | Good 11.9% |
| Lebanese | 78.3 /100 | #132 | Good 11.9% |
| Immigrants | Sierra Leone | 77.6 /100 | #133 | Good 11.9% |
| Ugandans | 77.1 /100 | #134 | Good 11.9% |
| Immigrants | Ireland | 76.2 /100 | #135 | Good 11.9% |
| Immigrants | Philippines | 75.0 /100 | #136 | Good 11.9% |
| Immigrants | Moldova | 74.1 /100 | #137 | Good 11.9% |
| Immigrants | Romania | 72.6 /100 | #138 | Good 11.9% |
| Immigrants | Kenya | 72.6 /100 | #139 | Good 11.9% |
| Immigrants | Pakistan | 71.9 /100 | #140 | Good 12.0% |
| Immigrants | Cameroon | 71.7 /100 | #141 | Good 12.0% |
| Immigrants | Laos | 71.5 /100 | #142 | Good 12.0% |
| Americans | 71.0 /100 | #143 | Good 12.0% |
| Hmong | 70.8 /100 | #144 | Good 12.0% |
| Immigrants | Belgium | 70.8 /100 | #145 | Good 12.0% |