Pima vs Immigrants from Western Africa Receiving Food Stamps
COMPARE
Pima
Immigrants from Western Africa
Receiving Food Stamps
Receiving Food Stamps Comparison
Pima
Immigrants from Western Africa
19.0%
RECEIVING FOOD STAMPS
0.0/ 100
METRIC RATING
330th/ 347
METRIC RANK
14.7%
RECEIVING FOOD STAMPS
0.1/ 100
METRIC RATING
274th/ 347
METRIC RANK
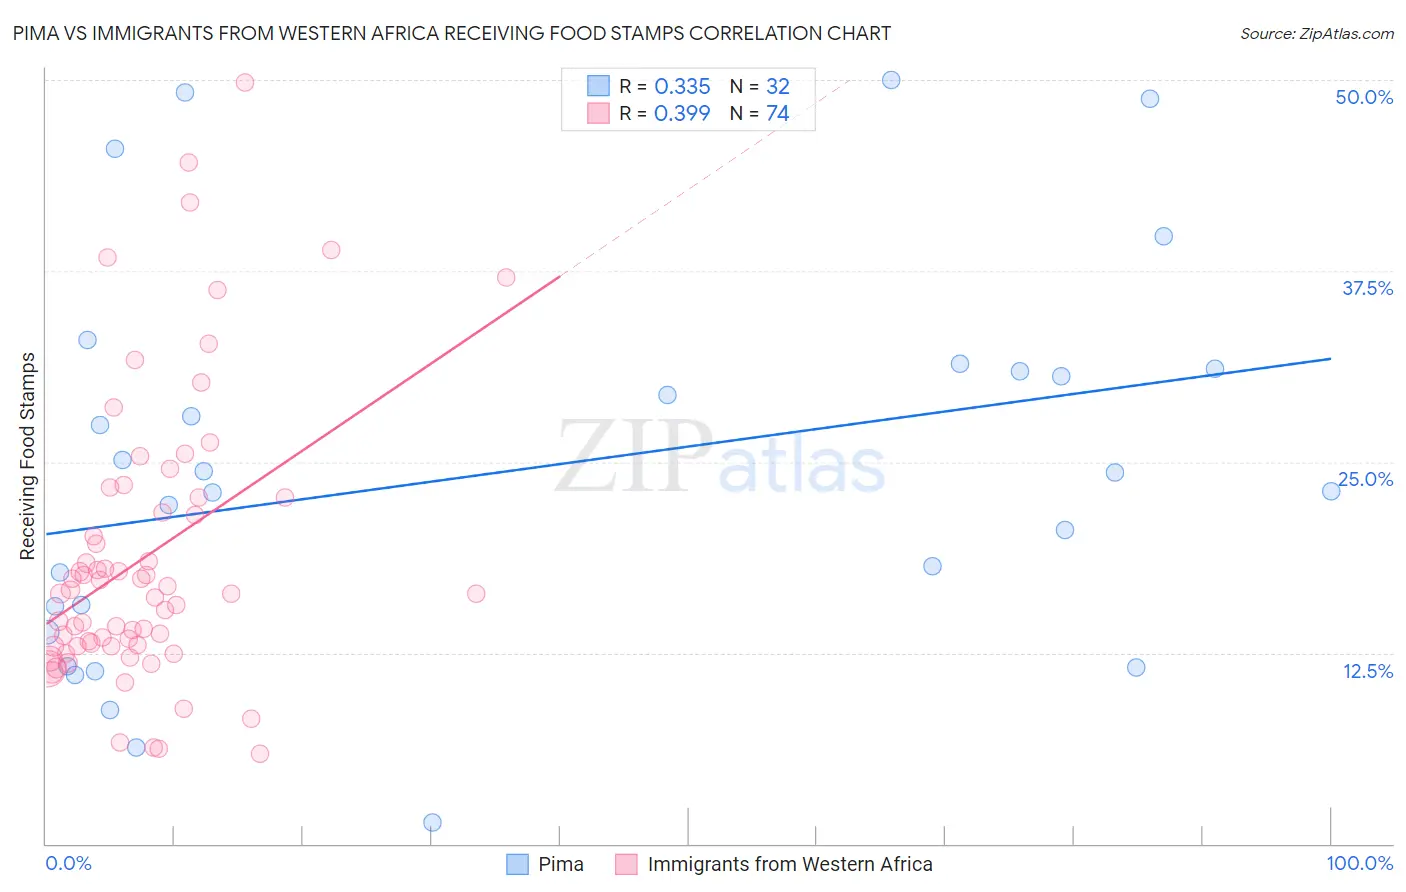
Pima vs Immigrants from Western Africa Receiving Food Stamps Correlation Chart
The statistical analysis conducted on geographies consisting of 61,500,304 people shows a mild positive correlation between the proportion of Pima and percentage of population receiving government assistance and/or food stamps in the United States with a correlation coefficient (R) of 0.335 and weighted average of 19.0%. Similarly, the statistical analysis conducted on geographies consisting of 357,063,327 people shows a mild positive correlation between the proportion of Immigrants from Western Africa and percentage of population receiving government assistance and/or food stamps in the United States with a correlation coefficient (R) of 0.399 and weighted average of 14.7%, a difference of 29.1%.
Receiving Food Stamps Correlation Summary
| Measurement | Pima | Immigrants from Western Africa |
| Minimum | 1.4% | 5.9% |
| Maximum | 50.0% | 49.8% |
| Range | 48.6% | 43.9% |
| Mean | 24.4% | 18.8% |
| Median | 23.7% | 16.4% |
| Interquartile 25% (IQ1) | 14.7% | 13.0% |
| Interquartile 75% (IQ3) | 31.0% | 22.7% |
| Interquartile Range (IQR) | 16.3% | 9.7% |
| Standard Deviation (Sample) | 12.7% | 9.3% |
| Standard Deviation (Population) | 12.5% | 9.2% |
Similar Demographics by Receiving Food Stamps
Demographics Similar to Pima by Receiving Food Stamps
In terms of receiving food stamps, the demographic groups most similar to Pima are Immigrants from Dominica (18.4%, a difference of 3.0%), Immigrants from Caribbean (19.6%, a difference of 3.4%), Colville (18.3%, a difference of 3.5%), Apache (18.3%, a difference of 3.7%), and Cuban (18.2%, a difference of 4.1%).
| Demographics | Rating | Rank | Receiving Food Stamps |
| Haitians | 0.0 /100 | #323 | Tragic 17.8% |
| British West Indians | 0.0 /100 | #324 | Tragic 17.9% |
| Immigrants | Haiti | 0.0 /100 | #325 | Tragic 18.2% |
| Cubans | 0.0 /100 | #326 | Tragic 18.2% |
| Apache | 0.0 /100 | #327 | Tragic 18.3% |
| Colville | 0.0 /100 | #328 | Tragic 18.3% |
| Immigrants | Dominica | 0.0 /100 | #329 | Tragic 18.4% |
| Pima | 0.0 /100 | #330 | Tragic 19.0% |
| Immigrants | Caribbean | 0.0 /100 | #331 | Tragic 19.6% |
| Pueblo | 0.0 /100 | #332 | Tragic 19.9% |
| Inupiat | 0.0 /100 | #333 | Tragic 20.1% |
| Yuman | 0.0 /100 | #334 | Tragic 20.2% |
| Immigrants | Cuba | 0.0 /100 | #335 | Tragic 20.8% |
| Navajo | 0.0 /100 | #336 | Tragic 21.1% |
| Cape Verdeans | 0.0 /100 | #337 | Tragic 21.1% |
Demographics Similar to Immigrants from Western Africa by Receiving Food Stamps
In terms of receiving food stamps, the demographic groups most similar to Immigrants from Western Africa are Alaskan Athabascan (14.7%, a difference of 0.020%), Chippewa (14.7%, a difference of 0.050%), Ute (14.7%, a difference of 0.080%), Immigrants from Guatemala (14.6%, a difference of 0.27%), and Mexican (14.6%, a difference of 0.36%).
| Demographics | Rating | Rank | Receiving Food Stamps |
| Dutch West Indians | 0.2 /100 | #267 | Tragic 14.3% |
| Guatemalans | 0.1 /100 | #268 | Tragic 14.4% |
| Nepalese | 0.1 /100 | #269 | Tragic 14.6% |
| Mexicans | 0.1 /100 | #270 | Tragic 14.6% |
| Immigrants | Guatemala | 0.1 /100 | #271 | Tragic 14.6% |
| Chippewa | 0.1 /100 | #272 | Tragic 14.7% |
| Alaskan Athabascans | 0.1 /100 | #273 | Tragic 14.7% |
| Immigrants | Western Africa | 0.1 /100 | #274 | Tragic 14.7% |
| Ute | 0.1 /100 | #275 | Tragic 14.7% |
| Liberians | 0.1 /100 | #276 | Tragic 14.8% |
| Seminole | 0.1 /100 | #277 | Tragic 14.8% |
| Belizeans | 0.1 /100 | #278 | Tragic 14.8% |
| Kiowa | 0.0 /100 | #279 | Tragic 14.9% |
| Ecuadorians | 0.0 /100 | #280 | Tragic 14.9% |
| Spanish American Indians | 0.0 /100 | #281 | Tragic 14.9% |