Immigrants from Central America vs Panamanian Married-Couple Family Poverty
COMPARE
Immigrants from Central America
Panamanian
Married-Couple Family Poverty
Married-Couple Family Poverty Comparison
Immigrants from Central America
Panamanians
7.4%
MARRIED-COUPLE FAMILY POVERTY
0.0/ 100
METRIC RATING
324th/ 347
METRIC RANK
5.6%
MARRIED-COUPLE FAMILY POVERTY
9.2/ 100
METRIC RATING
221st/ 347
METRIC RANK
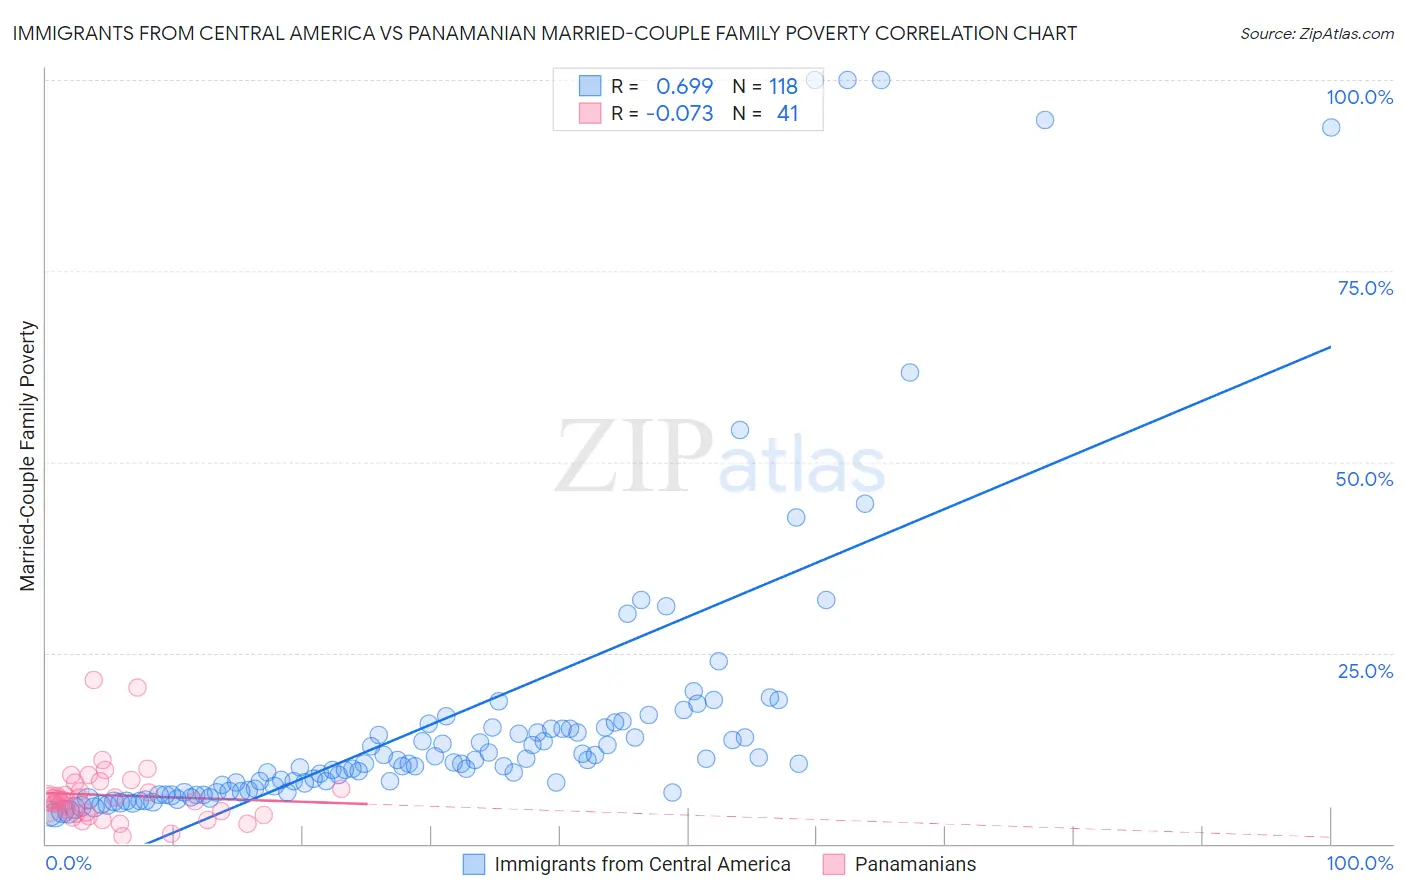
Immigrants from Central America vs Panamanian Married-Couple Family Poverty Correlation Chart
The statistical analysis conducted on geographies consisting of 527,356,648 people shows a significant positive correlation between the proportion of Immigrants from Central America and poverty level among married-couple families in the United States with a correlation coefficient (R) of 0.699 and weighted average of 7.4%. Similarly, the statistical analysis conducted on geographies consisting of 279,759,434 people shows a slight negative correlation between the proportion of Panamanians and poverty level among married-couple families in the United States with a correlation coefficient (R) of -0.073 and weighted average of 5.6%, a difference of 33.5%.
Married-Couple Family Poverty Correlation Summary
| Measurement | Immigrants from Central America | Panamanian |
| Minimum | 3.8% | 0.96% |
| Maximum | 100.0% | 21.5% |
| Range | 96.2% | 20.5% |
| Mean | 16.1% | 6.3% |
| Median | 10.5% | 5.7% |
| Interquartile 25% (IQ1) | 6.8% | 3.9% |
| Interquartile 75% (IQ3) | 15.0% | 7.6% |
| Interquartile Range (IQR) | 8.2% | 3.7% |
| Standard Deviation (Sample) | 19.6% | 4.1% |
| Standard Deviation (Population) | 19.5% | 4.0% |
Similar Demographics by Married-Couple Family Poverty
Demographics Similar to Immigrants from Central America by Married-Couple Family Poverty
In terms of married-couple family poverty, the demographic groups most similar to Immigrants from Central America are Vietnamese (7.4%, a difference of 0.090%), Immigrants from Cuba (7.5%, a difference of 0.53%), Immigrants from Bangladesh (7.5%, a difference of 0.73%), Hispanic or Latino (7.5%, a difference of 0.73%), and Immigrants from Honduras (7.3%, a difference of 1.1%).
| Demographics | Rating | Rank | Married-Couple Family Poverty |
| Mexicans | 0.0 /100 | #317 | Tragic 7.2% |
| Immigrants | Guatemala | 0.0 /100 | #318 | Tragic 7.2% |
| Immigrants | Latin America | 0.0 /100 | #319 | Tragic 7.2% |
| Immigrants | Grenada | 0.0 /100 | #320 | Tragic 7.3% |
| Immigrants | Caribbean | 0.0 /100 | #321 | Tragic 7.3% |
| Immigrants | Honduras | 0.0 /100 | #322 | Tragic 7.3% |
| Vietnamese | 0.0 /100 | #323 | Tragic 7.4% |
| Immigrants | Central America | 0.0 /100 | #324 | Tragic 7.4% |
| Immigrants | Cuba | 0.0 /100 | #325 | Tragic 7.5% |
| Immigrants | Bangladesh | 0.0 /100 | #326 | Tragic 7.5% |
| Hispanics or Latinos | 0.0 /100 | #327 | Tragic 7.5% |
| Immigrants | Mexico | 0.0 /100 | #328 | Tragic 7.6% |
| Natives/Alaskans | 0.0 /100 | #329 | Tragic 8.2% |
| Paiute | 0.0 /100 | #330 | Tragic 8.3% |
| Central American Indians | 0.0 /100 | #331 | Tragic 8.3% |
Demographics Similar to Panamanians by Married-Couple Family Poverty
In terms of married-couple family poverty, the demographic groups most similar to Panamanians are Colombian (5.6%, a difference of 0.020%), Japanese (5.6%, a difference of 0.21%), Afghan (5.5%, a difference of 0.61%), Immigrants from Nigeria (5.5%, a difference of 0.63%), and Cajun (5.6%, a difference of 0.85%).
| Demographics | Rating | Rank | Married-Couple Family Poverty |
| Iroquois | 13.1 /100 | #214 | Poor 5.5% |
| Armenians | 12.8 /100 | #215 | Poor 5.5% |
| Potawatomi | 12.4 /100 | #216 | Poor 5.5% |
| Immigrants | Nigeria | 11.3 /100 | #217 | Poor 5.5% |
| Afghans | 11.2 /100 | #218 | Poor 5.5% |
| Japanese | 9.8 /100 | #219 | Tragic 5.6% |
| Colombians | 9.2 /100 | #220 | Tragic 5.6% |
| Panamanians | 9.2 /100 | #221 | Tragic 5.6% |
| Cajuns | 6.9 /100 | #222 | Tragic 5.6% |
| Immigrants | Fiji | 6.7 /100 | #223 | Tragic 5.6% |
| Sudanese | 6.4 /100 | #224 | Tragic 5.6% |
| Immigrants | Cambodia | 6.1 /100 | #225 | Tragic 5.6% |
| South Americans | 5.7 /100 | #226 | Tragic 5.6% |
| Immigrants | Zaire | 5.6 /100 | #227 | Tragic 5.6% |
| Arabs | 5.4 /100 | #228 | Tragic 5.7% |