Guatemalan vs Romanian Married-Couple Family Poverty

COMPARE

Guatemalan
Race
Ancestry
AfghanAfricanAlaska NativeAlaskan AthabascanAlbanianAleutAlsatianAmericanApacheArabArapahoArgentineanArmenianAssyrian/Chaldean/SyriacAustralianAustrianBahamianBangladeshiBarbadianBasqueBelgianBelizeanBermudanBhutaneseBlackfeetBolivianBrazilianBritishBritish West IndianBulgarianBurmeseCajunCambodianCanadianCape VerdeanCarpatho RusynCelticCentral AmericanCentral American IndianCherokeeCheyenneChickasawChileanChineseChippewaChoctawColombianColvilleComancheCosta RicanCreeCreekCroatianCrowCubanCypriotCzechCzechoslovakianDanishDelawareDominicanDutchDutch West IndianEastern EuropeanEcuadorianEgyptianEnglishEstonianEthiopianEuropeanFijianFilipinoFinnishFrenchFrench American IndianFrench CanadianGermanGerman RussianGhanaianGreekGuamanian/ChamorroGuatemalanGuyaneseHaitianHmongHonduranHopiHoumaHungarianIcelanderIndian (Asian)IndonesianInupiatIranianIraqiIrishIroquoisIsraeliItalianJamaicanJapaneseJordanianKenyanKiowaKoreanLaotianLatvianLebaneseLiberianLithuanianLumbeeLuxembourgerMacedonianMalaysianMalteseMarshalleseMenomineeMexicanMexican American IndianMongolianMoroccanNative HawaiianNavajoNepaleseNew ZealanderNicaraguanNigerianNorthern EuropeanNorwegianOkinawanOsageOttawaPaiutePakistaniPalestinianPanamanianParaguayanPennsylvania GermanPeruvianPimaPolishPortuguesePotawatomiPuebloPuerto RicanPuget Sound SalishRussianSalvadoranSamoanScandinavianScotch-IrishScottishSeminoleSenegaleseSerbianShoshoneSierra LeoneanSiouxSlavicSlovakSloveneSomaliSouth AfricanSouth AmericanSouth American IndianSoviet UnionSpaniardSpanishSpanish AmericanSpanish American IndianSri LankanSubsaharan AfricanSudaneseSwedishSwissSyrianTaiwaneseThaiTlingit-HaidaTohono O'OdhamTonganTrinidadian and TobagonianTsimshianTurkishU.S. Virgin IslanderUgandanUkrainianUruguayanUteVenezuelanVietnameseWelshWest IndianYakamaYaquiYugoslavianYumanYup'ikZimbabwean
Immigration
NonimmigrantsImmigrantsAfghanistanAfricaAlbaniaArgentinaArmeniaAsiaAustraliaAustriaBahamasBangladeshBarbadosBelarusBelgiumBelizeBoliviaBosnia and HerzegovinaBrazilBulgariaBurma/MyanmarCabo VerdeCambodiaCameroonCanadaCaribbeanCentral AmericaChileChinaColombiaCongoCosta RicaCroatiaCubaCzechoslovakiaDenmarkDominicaDominican RepublicEastern AfricaEastern AsiaEastern EuropeEcuadorEgyptEl SalvadorEnglandEritreaEthiopiaEuropeFijiFranceGermanyGhanaGreeceGrenadaGuatemalaGuyanaHaitiHondurasHong KongHungaryIndiaIndonesiaIranIraqIrelandIsraelItalyJamaicaJapanJordanKazakhstanKenyaKoreaKuwaitLaosLatin AmericaLatviaLebanonLiberiaLithuaniaMalaysiaMexicoMicronesiaMiddle AfricaMoldovaMoroccoNepalNetherlandsNicaraguaNigeriaNorth AmericaNorth MacedoniaNorthern AfricaNorthern EuropeNorwayOceaniaPakistanPanamaPeruPhilippinesPolandPortugalRomaniaRussiaSaudi ArabiaScotlandSenegalSerbiaSierra LeoneSingaporeSomaliaSouth AfricaSouth AmericaSouth Central AsiaSouth Eastern AsiaSouthern EuropeSpainSri LankaSt. Vincent and the GrenadinesSudanSwedenSwitzerlandSyriaTaiwanThailandTrinidad and TobagoTurkeyUgandaUkraineUruguayUzbekistanVenezuelaVietnamWest IndiesWestern AfricaWestern AsiaWestern EuropeYemenZaireZimbabweAzores
Romanian
Race
Ancestry
AfghanAfricanAlaska NativeAlaskan AthabascanAlbanianAleutAlsatianAmericanApacheArabArapahoArgentineanArmenianAssyrian/Chaldean/SyriacAustralianAustrianBahamianBangladeshiBarbadianBasqueBelgianBelizeanBermudanBhutaneseBlackfeetBolivianBrazilianBritishBritish West IndianBulgarianBurmeseCajunCambodianCanadianCape VerdeanCarpatho RusynCelticCentral AmericanCentral American IndianCherokeeCheyenneChickasawChileanChineseChippewaChoctawColombianColvilleComancheCosta RicanCreeCreekCroatianCrowCubanCypriotCzechCzechoslovakianDanishDelawareDominicanDutchDutch West IndianEastern EuropeanEcuadorianEgyptianEnglishEstonianEthiopianEuropeanFijianFilipinoFinnishFrenchFrench American IndianFrench CanadianGermanGerman RussianGhanaianGreekGuamanian/ChamorroGuyaneseHaitianHmongHonduranHopiHoumaHungarianIcelanderIndian (Asian)IndonesianInupiatIranianIraqiIrishIroquoisIsraeliItalianJamaicanJapaneseJordanianKenyanKiowaKoreanLaotianLatvianLebaneseLiberianLithuanianLumbeeLuxembourgerMacedonianMalaysianMalteseMarshalleseMenomineeMexicanMexican American IndianMongolianMoroccanNative HawaiianNavajoNepaleseNew ZealanderNicaraguanNigerianNorthern EuropeanNorwegianOkinawanOsageOttawaPaiutePakistaniPalestinianPanamanianParaguayanPennsylvania GermanPeruvianPimaPolishPortuguesePotawatomiPuebloPuerto RicanPuget Sound SalishRomanianRussianSalvadoranSamoanScandinavianScotch-IrishScottishSeminoleSenegaleseSerbianShoshoneSierra LeoneanSiouxSlavicSlovakSloveneSomaliSouth AfricanSouth AmericanSouth American IndianSoviet UnionSpaniardSpanishSpanish AmericanSpanish American IndianSri LankanSubsaharan AfricanSudaneseSwedishSwissSyrianTaiwaneseThaiTlingit-HaidaTohono O'OdhamTonganTrinidadian and TobagonianTsimshianTurkishU.S. Virgin IslanderUgandanUkrainianUruguayanUteVenezuelanVietnameseWelshWest IndianYakamaYaquiYugoslavianYumanYup'ikZimbabwean
Immigration
NonimmigrantsImmigrantsAfghanistanAfricaAlbaniaArgentinaArmeniaAsiaAustraliaAustriaBahamasBangladeshBarbadosBelarusBelgiumBelizeBoliviaBosnia and HerzegovinaBrazilBulgariaBurma/MyanmarCabo VerdeCambodiaCameroonCanadaCaribbeanCentral AmericaChileChinaColombiaCongoCosta RicaCroatiaCubaCzechoslovakiaDenmarkDominicaDominican RepublicEastern AfricaEastern AsiaEastern EuropeEcuadorEgyptEl SalvadorEnglandEritreaEthiopiaEuropeFijiFranceGermanyGhanaGreeceGrenadaGuatemalaGuyanaHaitiHondurasHong KongHungaryIndiaIndonesiaIranIraqIrelandIsraelItalyJamaicaJapanJordanKazakhstanKenyaKoreaKuwaitLaosLatin AmericaLatviaLebanonLiberiaLithuaniaMalaysiaMexicoMicronesiaMiddle AfricaMoldovaMoroccoNepalNetherlandsNicaraguaNigeriaNorth AmericaNorth MacedoniaNorthern AfricaNorthern EuropeNorwayOceaniaPakistanPanamaPeruPhilippinesPolandPortugalRomaniaRussiaSaudi ArabiaScotlandSenegalSerbiaSierra LeoneSingaporeSomaliaSouth AfricaSouth AmericaSouth Central AsiaSouth Eastern AsiaSouthern EuropeSpainSri LankaSt. Vincent and the GrenadinesSudanSwedenSwitzerlandSyriaTaiwanThailandTrinidad and TobagoTurkeyUgandaUkraineUruguayUzbekistanVenezuelaVietnamWest IndiesWestern AfricaWestern AsiaWestern EuropeYemenZaireZimbabweAzores
Married-Couple Family Poverty
Income
Poverty
Unemployment
Labor Participation
Family Structure
Vehicle Availability
Education Level
Disability

Married-Couple Family Poverty Comparison

Guatemalans

Romanians

Tragic
Exceptional
7.0%
MARRIED-COUPLE FAMILY POVERTY
0.0/ 100
METRIC RATING
307th/ 347
METRIC RANK
4.8%
MARRIED-COUPLE FAMILY POVERTY
92.5/ 100
METRIC RATING
124th/ 347
METRIC RANK

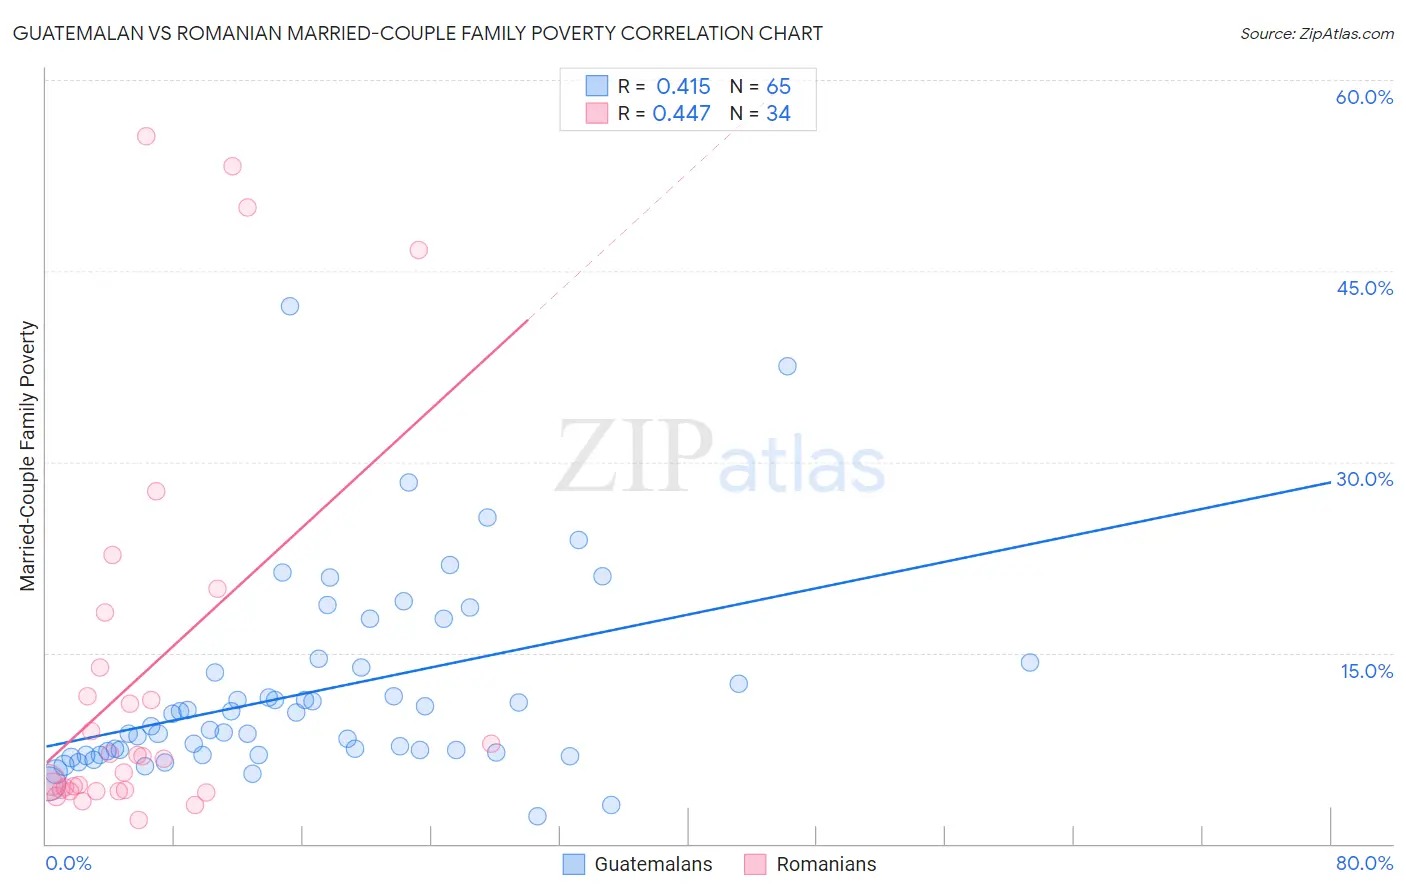
Guatemalan vs Romanian Married-Couple Family Poverty Correlation Chart

The statistical analysis conducted on geographies consisting of 406,520,979 people shows a moderate positive correlation between the proportion of Guatemalans and poverty level among married-couple families in the United States with a correlation coefficient (R) of 0.415 and weighted average of 7.0%. Similarly, the statistical analysis conducted on geographies consisting of 374,441,854 people shows a moderate positive correlation between the proportion of Romanians and poverty level among married-couple families in the United States with a correlation coefficient (R) of 0.447 and weighted average of 4.8%, a difference of 45.5%.
Guatemalan vs Romanian Married-Couple Family Poverty

Married-Couple Family Poverty Correlation Summary

MeasurementGuatemalanRomanian
Minimum2.1%1.9%
Maximum42.2%55.6%
Range40.1%53.6%
Mean11.9%13.3%
Median9.3%6.8%
Interquartile 25% (IQ1)7.1%4.2%
Interquartile 75% (IQ3)14.1%13.9%
Interquartile Range (IQR)7.0%9.6%
Standard Deviation (Sample)7.5%15.4%
Standard Deviation (Population)7.5%15.1%

Similar Demographics by Married-Couple Family Poverty

Demographics Similar to Guatemalans by Married-Couple Family Poverty

In terms of married-couple family poverty, the demographic groups most similar to Guatemalans are Spanish American Indian (7.1%, a difference of 0.18%), Hopi (7.1%, a difference of 0.78%), Immigrants from Nicaragua (7.1%, a difference of 0.81%), Immigrants from Dominica (7.1%, a difference of 0.86%), and Immigrants from Armenia (7.1%, a difference of 0.86%).
DemographicsRating | RankMarried-Couple Family Poverty
Immigrants | Belize
0.0
/100
|
#300
Tragic
6.7%
Central Americans
0.0
/100
|
#301
Tragic
6.7%
Immigrants | Ecuador
0.0
/100
|
#302
Tragic
6.7%
Immigrants | El Salvador
0.0
/100
|
#303
Tragic
6.8%
Cubans
0.0
/100
|
#304
Tragic
6.8%
Haitians
0.0
/100
|
#305
Tragic
6.8%
Immigrants | Haiti
0.0
/100
|
#306
Tragic
7.0%
Guatemalans
0.0
/100
|
#307
Tragic
7.0%
Spanish American Indians
0.0
/100
|
#308
Tragic
7.1%
Hopi
0.0
/100
|
#309
Tragic
7.1%
Immigrants | Nicaragua
0.0
/100
|
#310
Tragic
7.1%
Immigrants | Dominica
0.0
/100
|
#311
Tragic
7.1%
Immigrants | Armenia
0.0
/100
|
#312
Tragic
7.1%
Immigrants | St. Vincent and the Grenadines
0.0
/100
|
#313
Tragic
7.1%
British West Indians
0.0
/100
|
#314
Tragic
7.1%

Demographics Similar to Romanians by Married-Couple Family Poverty

In terms of married-couple family poverty, the demographic groups most similar to Romanians are Immigrants from Bosnia and Herzegovina (4.8%, a difference of 0.020%), Immigrants from Asia (4.8%, a difference of 0.090%), Egyptian (4.8%, a difference of 0.23%), Jordanian (4.8%, a difference of 0.27%), and White/Caucasian (4.8%, a difference of 0.29%).
DemographicsRating | RankMarried-Couple Family Poverty
Kenyans
94.7
/100
|
#117
Exceptional
4.8%
Immigrants | Philippines
94.6
/100
|
#118
Exceptional
4.8%
Immigrants | Eastern Asia
94.0
/100
|
#119
Exceptional
4.8%
Immigrants | Southern Europe
93.4
/100
|
#120
Exceptional
4.8%
Indians (Asian)
93.2
/100
|
#121
Exceptional
4.8%
Whites/Caucasians
93.1
/100
|
#122
Exceptional
4.8%
Jordanians
93.1
/100
|
#123
Exceptional
4.8%
Romanians
92.5
/100
|
#124
Exceptional
4.8%
Immigrants | Bosnia and Herzegovina
92.5
/100
|
#125
Exceptional
4.8%
Immigrants | Asia
92.3
/100
|
#126
Exceptional
4.8%
Egyptians
92.0
/100
|
#127
Exceptional
4.8%
Palestinians
91.2
/100
|
#128
Exceptional
4.9%
Immigrants | Pakistan
90.7
/100
|
#129
Exceptional
4.9%
Soviet Union
90.7
/100
|
#130
Exceptional
4.9%
Immigrants | Eastern Europe
90.5
/100
|
#131
Exceptional
4.9%