Cherokee vs New Zealander Married-Couple Family Poverty
COMPARE
Cherokee
New Zealander
Married-Couple Family Poverty
Married-Couple Family Poverty Comparison
Cherokee
New Zealanders
5.8%
MARRIED-COUPLE FAMILY POVERTY
2.7/ 100
METRIC RATING
238th/ 347
METRIC RANK
4.4%
MARRIED-COUPLE FAMILY POVERTY
99.4/ 100
METRIC RATING
69th/ 347
METRIC RANK
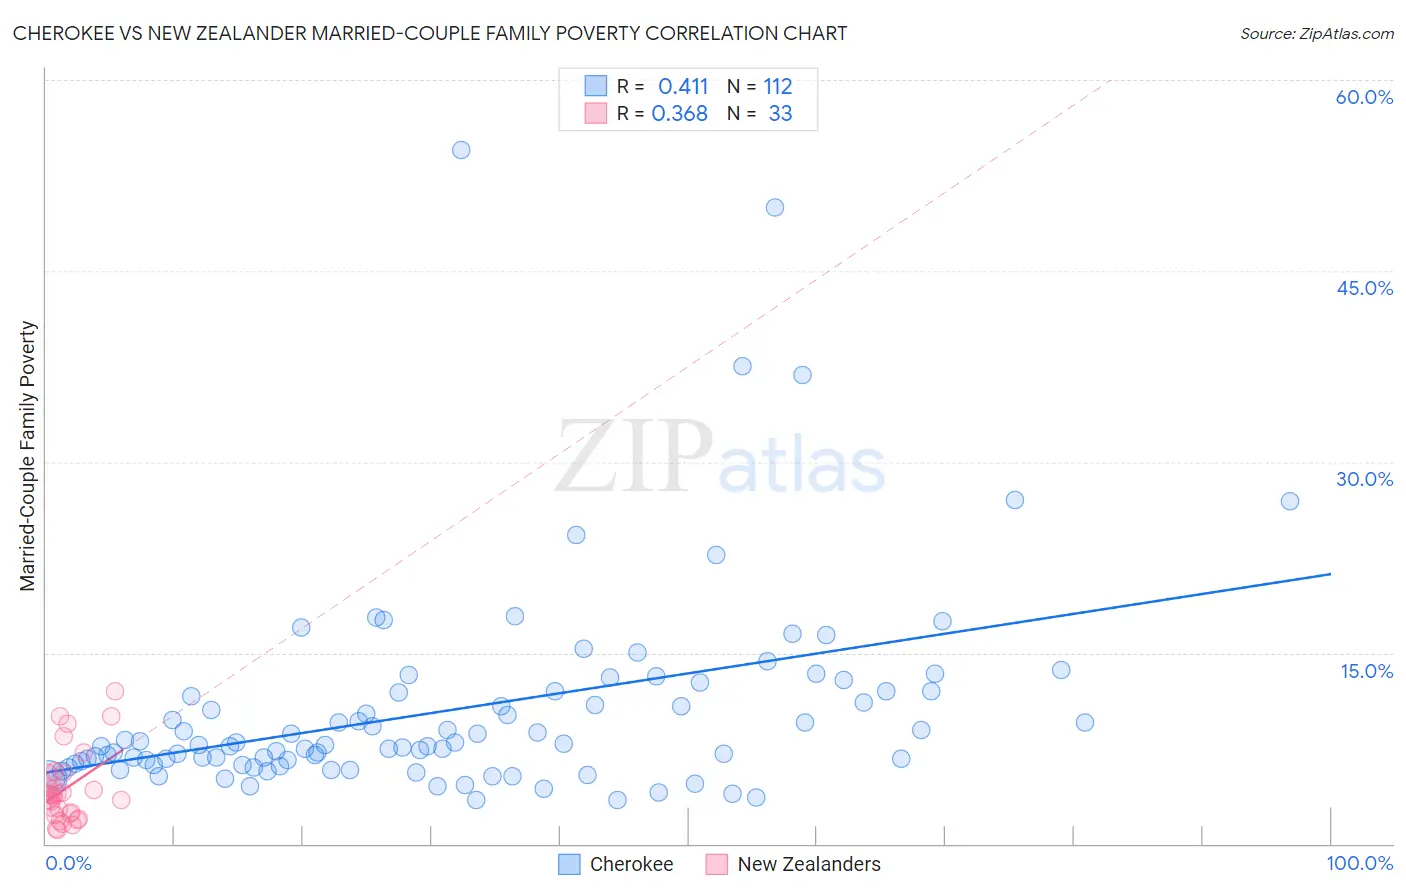
Cherokee vs New Zealander Married-Couple Family Poverty Correlation Chart
The statistical analysis conducted on geographies consisting of 487,541,023 people shows a moderate positive correlation between the proportion of Cherokee and poverty level among married-couple families in the United States with a correlation coefficient (R) of 0.411 and weighted average of 5.8%. Similarly, the statistical analysis conducted on geographies consisting of 106,591,527 people shows a mild positive correlation between the proportion of New Zealanders and poverty level among married-couple families in the United States with a correlation coefficient (R) of 0.368 and weighted average of 4.4%, a difference of 29.6%.
Married-Couple Family Poverty Correlation Summary
| Measurement | Cherokee | New Zealander |
| Minimum | 3.4% | 1.1% |
| Maximum | 54.5% | 11.9% |
| Range | 51.1% | 10.8% |
| Mean | 10.6% | 4.4% |
| Median | 7.7% | 3.8% |
| Interquartile 25% (IQ1) | 6.2% | 2.3% |
| Interquartile 75% (IQ3) | 12.0% | 5.5% |
| Interquartile Range (IQR) | 5.8% | 3.2% |
| Standard Deviation (Sample) | 8.2% | 2.8% |
| Standard Deviation (Population) | 8.2% | 2.8% |
Similar Demographics by Married-Couple Family Poverty
Demographics Similar to Cherokee by Married-Couple Family Poverty
In terms of married-couple family poverty, the demographic groups most similar to Cherokee are Venezuelan (5.8%, a difference of 0.020%), Fijian (5.8%, a difference of 0.19%), Immigrants from Panama (5.8%, a difference of 0.22%), Immigrants from Western Africa (5.8%, a difference of 0.31%), and Immigrants from South America (5.7%, a difference of 0.38%).
| Demographics | Rating | Rank | Married-Couple Family Poverty |
| Immigrants | Iraq | 4.4 /100 | #231 | Tragic 5.7% |
| Immigrants | Laos | 4.4 /100 | #232 | Tragic 5.7% |
| Immigrants | Colombia | 3.7 /100 | #233 | Tragic 5.7% |
| Immigrants | Uruguay | 3.7 /100 | #234 | Tragic 5.7% |
| Immigrants | Sudan | 3.5 /100 | #235 | Tragic 5.7% |
| Ghanaians | 3.3 /100 | #236 | Tragic 5.7% |
| Immigrants | South America | 3.1 /100 | #237 | Tragic 5.7% |
| Cherokee | 2.7 /100 | #238 | Tragic 5.8% |
| Venezuelans | 2.7 /100 | #239 | Tragic 5.8% |
| Fijians | 2.5 /100 | #240 | Tragic 5.8% |
| Immigrants | Panama | 2.5 /100 | #241 | Tragic 5.8% |
| Immigrants | Western Africa | 2.4 /100 | #242 | Tragic 5.8% |
| Somalis | 2.3 /100 | #243 | Tragic 5.8% |
| Chickasaw | 2.3 /100 | #244 | Tragic 5.8% |
| Immigrants | Afghanistan | 2.1 /100 | #245 | Tragic 5.8% |
Demographics Similar to New Zealanders by Married-Couple Family Poverty
In terms of married-couple family poverty, the demographic groups most similar to New Zealanders are Slavic (4.4%, a difference of 0.010%), Immigrants from Canada (4.4%, a difference of 0.030%), Immigrants from Serbia (4.4%, a difference of 0.070%), Immigrants from Korea (4.5%, a difference of 0.13%), and Macedonian (4.4%, a difference of 0.20%).
| Demographics | Rating | Rank | Married-Couple Family Poverty |
| Immigrants | Australia | 99.6 /100 | #62 | Exceptional 4.4% |
| Immigrants | Sri Lanka | 99.6 /100 | #63 | Exceptional 4.4% |
| Immigrants | Bulgaria | 99.5 /100 | #64 | Exceptional 4.4% |
| Macedonians | 99.4 /100 | #65 | Exceptional 4.4% |
| Immigrants | Serbia | 99.4 /100 | #66 | Exceptional 4.4% |
| Immigrants | Canada | 99.4 /100 | #67 | Exceptional 4.4% |
| Slavs | 99.4 /100 | #68 | Exceptional 4.4% |
| New Zealanders | 99.4 /100 | #69 | Exceptional 4.4% |
| Immigrants | Korea | 99.4 /100 | #70 | Exceptional 4.5% |
| Immigrants | North America | 99.3 /100 | #71 | Exceptional 4.5% |
| Immigrants | England | 99.3 /100 | #72 | Exceptional 4.5% |
| Ukrainians | 99.2 /100 | #73 | Exceptional 4.5% |
| Immigrants | Austria | 99.2 /100 | #74 | Exceptional 4.5% |
| Cambodians | 99.2 /100 | #75 | Exceptional 4.5% |
| Immigrants | South Africa | 99.1 /100 | #76 | Exceptional 4.5% |