Zip Codes with the Highest Percentage of Households with Income Below $10,000 in Philadelphia, PA
RELATED REPORTS & OPTIONS
Household Income | $0-10k
Philadelphia
Compare Zip Codes
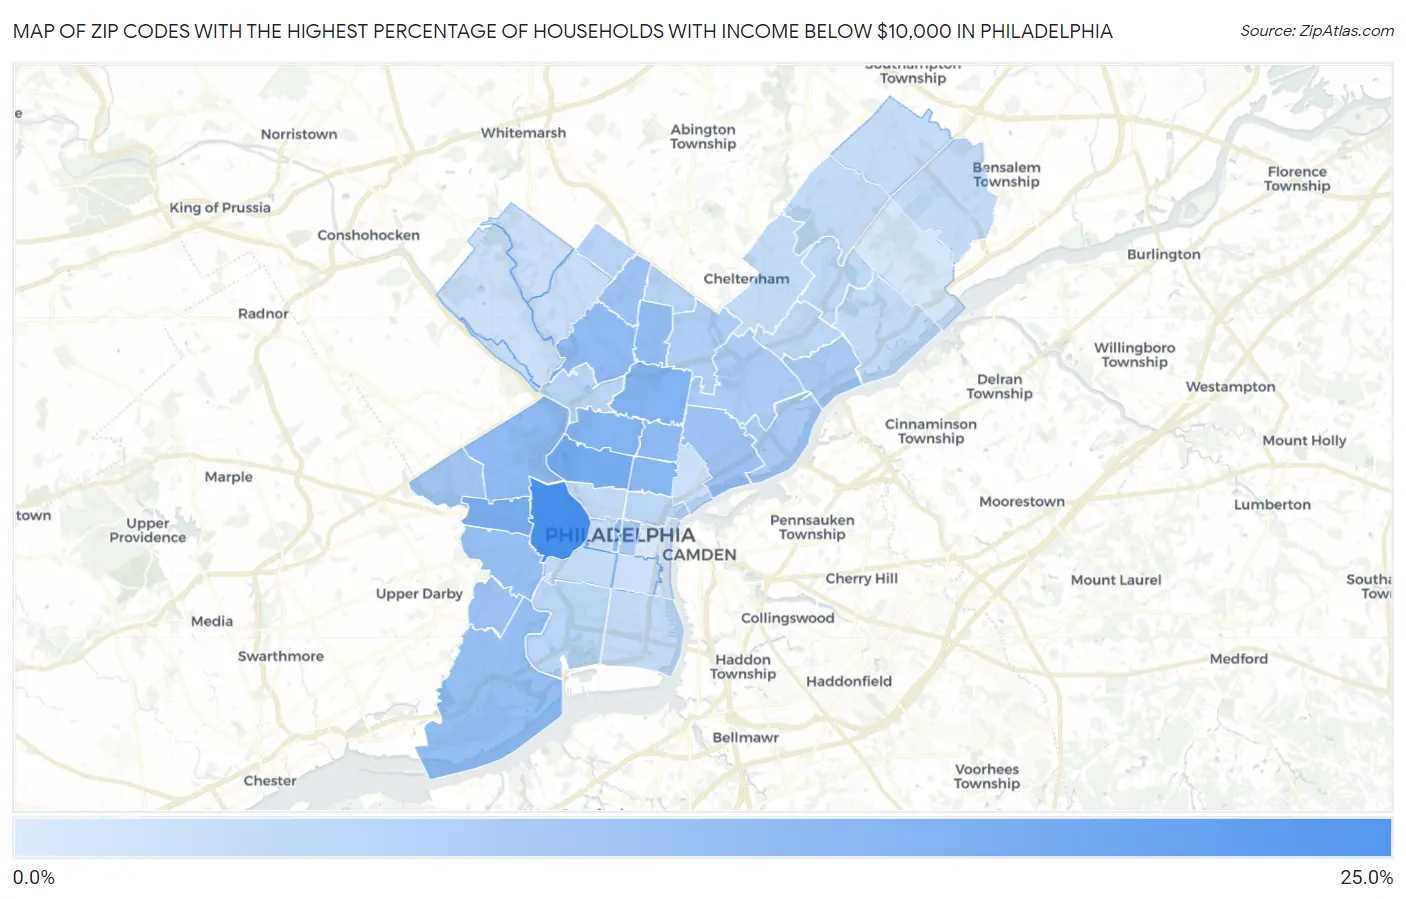
Map of Zip Codes with the Highest Percentage of Households with Income Below $10,000 in Philadelphia
0.0%
25.0%
Zip Codes with the Highest Percentage of Households with Income Below $10,000 in Philadelphia, PA
| Zip Code | Households with Income < $10k | vs State | vs National | |
| 1. | 19104 | 24.4% | 4.8%(+19.6)#17 | 4.9%(+19.5)#511 |
| 2. | 19121 | 17.0% | 4.8%(+12.2)#37 | 4.9%(+12.1)#1,157 |
| 3. | 19139 | 16.7% | 4.8%(+11.9)#39 | 4.9%(+11.8)#1,200 |
| 4. | 19140 | 15.1% | 4.8%(+10.3)#53 | 4.9%(+10.2)#1,497 |
| 5. | 19132 | 15.0% | 4.8%(+10.2)#55 | 4.9%(+10.1)#1,514 |
| 6. | 19122 | 14.1% | 4.8%(+9.30)#61 | 4.9%(+9.20)#1,739 |
| 7. | 19133 | 13.5% | 4.8%(+8.70)#65 | 4.9%(+8.60)#1,908 |
| 8. | 19131 | 13.1% | 4.8%(+8.30)#68 | 4.9%(+8.20)#2,021 |
| 9. | 19144 | 13.0% | 4.8%(+8.20)#69 | 4.9%(+8.10)#2,060 |
| 10. | 19102 | 12.8% | 4.8%(+8.00)#78 | 4.9%(+7.90)#2,166 |
| 11. | 19141 | 12.7% | 4.8%(+7.90)#81 | 4.9%(+7.80)#2,191 |
| 12. | 19143 | 12.2% | 4.8%(+7.40)#89 | 4.9%(+7.30)#2,364 |
| 13. | 19153 | 12.2% | 4.8%(+7.40)#90 | 4.9%(+7.30)#2,376 |
| 14. | 19142 | 11.4% | 4.8%(+6.60)#99 | 4.9%(+6.50)#2,723 |
| 15. | 19138 | 11.3% | 4.8%(+6.50)#101 | 4.9%(+6.40)#2,784 |
| 16. | 19134 | 11.0% | 4.8%(+6.20)#107 | 4.9%(+6.10)#2,942 |
| 17. | 19151 | 10.4% | 4.8%(+5.60)#122 | 4.9%(+5.50)#3,289 |
| 18. | 19107 | 9.8% | 4.8%(+5.00)#139 | 4.9%(+4.90)#3,722 |
| 19. | 19137 | 9.4% | 4.8%(+4.60)#152 | 4.9%(+4.50)#4,041 |
| 20. | 19135 | 9.2% | 4.8%(+4.40)#160 | 4.9%(+4.30)#4,202 |
| 21. | 19124 | 9.0% | 4.8%(+4.20)#169 | 4.9%(+4.10)#4,392 |
| 22. | 19120 | 8.3% | 4.8%(+3.50)#195 | 4.9%(+3.40)#5,148 |
| 23. | 19126 | 7.3% | 4.8%(+2.50)#241 | 4.9%(+2.40)#6,511 |
| 24. | 19129 | 7.1% | 4.8%(+2.30)#250 | 4.9%(+2.20)#6,819 |
| 25. | 19150 | 6.9% | 4.8%(+2.10)#265 | 4.9%(+2.00)#7,120 |
| 26. | 19145 | 6.8% | 4.8%(+2.00)#272 | 4.9%(+1.90)#7,299 |
| 27. | 19149 | 6.4% | 4.8%(+1.60)#319 | 4.9%(+1.50)#8,086 |
| 28. | 19123 | 6.4% | 4.8%(+1.60)#322 | 4.9%(+1.50)#8,133 |
| 29. | 19152 | 6.2% | 4.8%(+1.40)#335 | 4.9%(+1.30)#8,526 |
| 30. | 19130 | 5.6% | 4.8%(+0.800)#405 | 4.9%(+0.700)#9,975 |
| 31. | 19154 | 5.5% | 4.8%(+0.700)#422 | 4.9%(+0.600)#10,218 |
| 32. | 19111 | 5.4% | 4.8%(+0.600)#428 | 4.9%(+0.500)#10,433 |
| 33. | 19148 | 5.3% | 4.8%(+0.500)#447 | 4.9%(+0.400)#10,716 |
| 34. | 19136 | 5.3% | 4.8%(+0.500)#448 | 4.9%(+0.400)#10,738 |
| 35. | 19115 | 5.3% | 4.8%(+0.500)#449 | 4.9%(+0.400)#10,743 |
| 36. | 19146 | 5.1% | 4.8%(+0.300)#478 | 4.9%(+0.200)#11,342 |
| 37. | 19116 | 5.1% | 4.8%(+0.300)#479 | 4.9%(+0.200)#11,356 |
| 38. | 19127 | 5.1% | 4.8%(+0.300)#483 | 4.9%(+0.200)#11,474 |
| 39. | 19103 | 4.8% | 4.8%(=0.000)#514 | 4.9%(-0.100)#12,335 |
| 40. | 19119 | 4.7% | 4.8%(-0.100)#530 | 4.9%(-0.200)#12,666 |
| 41. | 19118 | 4.5% | 4.8%(-0.300)#579 | 4.9%(-0.400)#13,448 |
| 42. | 19128 | 4.2% | 4.8%(-0.600)#628 | 4.9%(-0.700)#14,464 |
| 43. | 19125 | 4.2% | 4.8%(-0.600)#629 | 4.9%(-0.700)#14,510 |
| 44. | 19147 | 3.7% | 4.8%(-1.10)#719 | 4.9%(-1.20)#16,400 |
| 45. | 19114 | 2.8% | 4.8%(-2.00)#969 | 4.9%(-2.10)#20,274 |
| 46. | 19106 | 1.9% | 4.8%(-2.90)#1,199 | 4.9%(-3.00)#24,062 |
1
Common Questions
What are the Top 10 Zip Codes with the Highest Percentage of Households with Income Below $10,000 in Philadelphia, PA?
Top 10 Zip Codes with the Highest Percentage of Households with Income Below $10,000 in Philadelphia, PA are:
What zip code has the Highest Percentage of Households with Income Below $10,000 in Philadelphia, PA?
19104 has the Highest Percentage of Households with Income Below $10,000 in Philadelphia, PA with 24.4%.
What is the Percentage of Households with Income Below $10,000 in Philadelphia, PA?
Percentage of Households with Income Below $10,000 in Philadelphia is 9.1%.
What is the Percentage of Households with Income Below $10,000 in Pennsylvania?
Percentage of Households with Income Below $10,000 in Pennsylvania is 4.8%.
What is the Percentage of Households with Income Below $10,000 in the United States?
Percentage of Households with Income Below $10,000 in the United States is 4.9%.