Zip Codes with the Highest Percentage of Population Employed in Farming, Fishing & Forestry in Philadelphia, PA
RELATED REPORTS & OPTIONS
Farming, Fishing & Forestry
Philadelphia
Compare Zip Codes
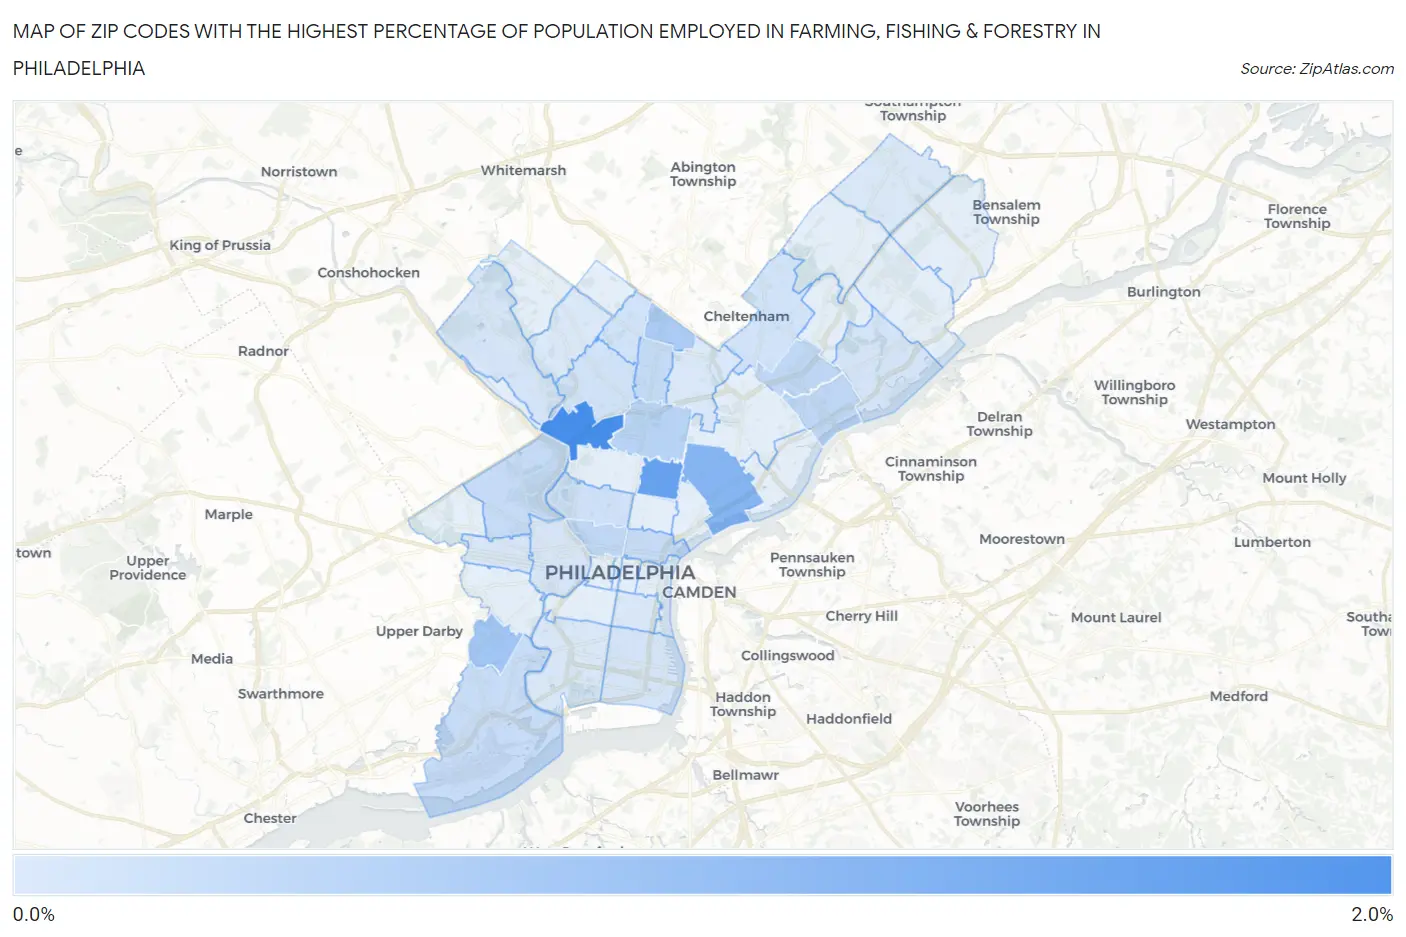
Map of Zip Codes with the Highest Percentage of Population Employed in Farming, Fishing & Forestry in Philadelphia
0.0%
2.0%
Zip Codes with the Highest Percentage of Population Employed in Farming, Fishing & Forestry in Philadelphia, PA
| Zip Code | % Employed | vs State | vs National | |
| 1. | 19129 | 1.7% | 0.41%(+1.34)#218 | 0.61%(+1.14)#7,189 |
| 2. | 19133 | 1.4% | 0.41%(+0.977)#267 | 0.61%(+0.777)#8,263 |
| 3. | 19134 | 1.0% | 0.41%(+0.607)#343 | 0.61%(+0.407)#9,680 |
| 4. | 19142 | 0.69% | 0.41%(+0.281)#434 | 0.61%(+0.081)#11,466 |
| 5. | 19126 | 0.59% | 0.41%(+0.187)#470 | 0.61%(-0.013)#12,093 |
| 6. | 19140 | 0.44% | 0.41%(+0.030)#534 | 0.61%(-0.169)#13,426 |
| 7. | 19130 | 0.35% | 0.41%(-0.057)#587 | 0.61%(-0.257)#14,283 |
| 8. | 19135 | 0.34% | 0.41%(-0.063)#590 | 0.61%(-0.262)#14,331 |
| 9. | 19149 | 0.34% | 0.41%(-0.065)#592 | 0.61%(-0.265)#14,358 |
| 10. | 19141 | 0.30% | 0.41%(-0.107)#620 | 0.61%(-0.307)#14,851 |
| 11. | 19131 | 0.28% | 0.41%(-0.126)#630 | 0.61%(-0.325)#15,066 |
| 12. | 19123 | 0.26% | 0.41%(-0.144)#636 | 0.61%(-0.343)#15,256 |
| 13. | 19153 | 0.24% | 0.41%(-0.169)#655 | 0.61%(-0.369)#15,590 |
| 14. | 19121 | 0.16% | 0.41%(-0.246)#715 | 0.61%(-0.446)#16,751 |
| 15. | 19138 | 0.15% | 0.41%(-0.259)#727 | 0.61%(-0.458)#16,972 |
| 16. | 19111 | 0.14% | 0.41%(-0.265)#732 | 0.61%(-0.465)#17,090 |
| 17. | 19144 | 0.14% | 0.41%(-0.268)#734 | 0.61%(-0.467)#17,137 |
| 18. | 19136 | 0.10% | 0.41%(-0.301)#763 | 0.61%(-0.501)#17,665 |
| 19. | 19128 | 0.094% | 0.41%(-0.312)#772 | 0.61%(-0.511)#17,858 |
| 20. | 19148 | 0.084% | 0.41%(-0.322)#785 | 0.61%(-0.522)#18,038 |
| 21. | 19139 | 0.074% | 0.41%(-0.332)#797 | 0.61%(-0.531)#18,224 |
| 22. | 19104 | 0.055% | 0.41%(-0.351)#812 | 0.61%(-0.551)#18,572 |
| 23. | 19116 | 0.052% | 0.41%(-0.354)#814 | 0.61%(-0.554)#18,624 |
| 24. | 19145 | 0.049% | 0.41%(-0.356)#817 | 0.61%(-0.556)#18,672 |
| 25. | 19119 | 0.049% | 0.41%(-0.357)#819 | 0.61%(-0.556)#18,675 |
| 26. | 19120 | 0.042% | 0.41%(-0.364)#826 | 0.61%(-0.564)#18,787 |
| 27. | 19147 | 0.042% | 0.41%(-0.364)#827 | 0.61%(-0.564)#18,790 |
1
Common Questions
What are the Top 10 Zip Codes with the Highest Percentage of Population Employed in Farming, Fishing & Forestry in Philadelphia, PA?
Top 10 Zip Codes with the Highest Percentage of Population Employed in Farming, Fishing & Forestry in Philadelphia, PA are:
What zip code has the Highest Percentage of Population Employed in Farming, Fishing & Forestry in Philadelphia, PA?
19129 has the Highest Percentage of Population Employed in Farming, Fishing & Forestry in Philadelphia, PA with 1.7%.
What is the Percentage of Population Employed in Farming, Fishing & Forestry in Philadelphia, PA?
Percentage of Population Employed in Farming, Fishing & Forestry in Philadelphia is 0.17%.
What is the Percentage of Population Employed in Farming, Fishing & Forestry in Pennsylvania?
Percentage of Population Employed in Farming, Fishing & Forestry in Pennsylvania is 0.41%.
What is the Percentage of Population Employed in Farming, Fishing & Forestry in the United States?
Percentage of Population Employed in Farming, Fishing & Forestry in the United States is 0.61%.