Zip Codes with the Highest Percentage of Population Employed in Computer, Engineering & Science in Philadelphia, PA
RELATED REPORTS & OPTIONS
Computer, Engineering & Science
Philadelphia
Compare Zip Codes
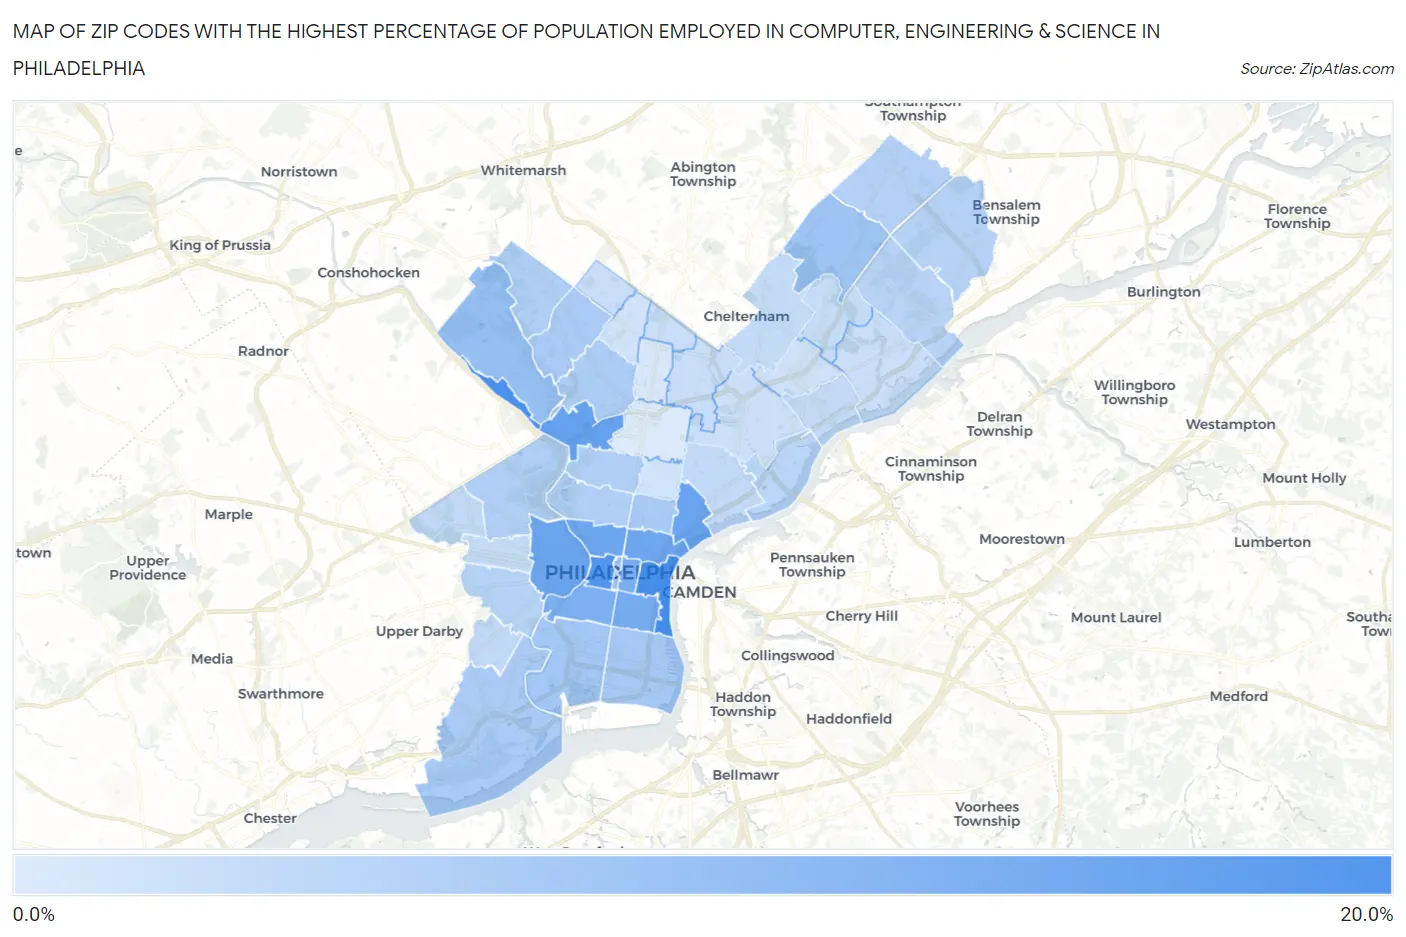
Map of Zip Codes with the Highest Percentage of Population Employed in Computer, Engineering & Science in Philadelphia
0.0%
20.0%
Zip Codes with the Highest Percentage of Population Employed in Computer, Engineering & Science in Philadelphia, PA
| Zip Code | % Employed | vs State | vs National | |
| 1. | 19106 | 17.4% | 6.5%(+10.9)#32 | 6.8%(+10.7)#760 |
| 2. | 19127 | 17.1% | 6.5%(+10.5)#34 | 6.8%(+10.3)#802 |
| 3. | 19103 | 16.1% | 6.5%(+9.57)#39 | 6.8%(+9.35)#936 |
| 4. | 19129 | 13.9% | 6.5%(+7.37)#58 | 6.8%(+7.15)#1,367 |
| 5. | 19125 | 13.4% | 6.5%(+6.90)#61 | 6.8%(+6.68)#1,497 |
| 6. | 19104 | 13.2% | 6.5%(+6.63)#66 | 6.8%(+6.41)#1,577 |
| 7. | 19123 | 12.9% | 6.5%(+6.35)#73 | 6.8%(+6.13)#1,683 |
| 8. | 19130 | 12.7% | 6.5%(+6.19)#78 | 6.8%(+5.96)#1,737 |
| 9. | 19147 | 11.9% | 6.5%(+5.35)#99 | 6.8%(+5.13)#2,086 |
| 10. | 19107 | 11.4% | 6.5%(+4.84)#119 | 6.8%(+4.61)#2,364 |
| 11. | 19146 | 11.2% | 6.5%(+4.68)#124 | 6.8%(+4.45)#2,449 |
| 12. | 19128 | 8.3% | 6.5%(+1.76)#253 | 6.8%(+1.54)#4,861 |
| 13. | 19102 | 7.7% | 6.5%(+1.11)#299 | 6.8%(+0.885)#5,754 |
| 14. | 19115 | 7.3% | 6.5%(+0.763)#332 | 6.8%(+0.539)#6,304 |
| 15. | 19145 | 6.9% | 6.5%(+0.382)#369 | 6.8%(+0.158)#6,928 |
| 16. | 19148 | 6.7% | 6.5%(+0.130)#412 | 6.8%(-0.095)#7,405 |
| 17. | 19122 | 6.5% | 6.5%(-0.087)#434 | 6.8%(-0.311)#7,829 |
| 18. | 19119 | 6.1% | 6.5%(-0.471)#486 | 6.8%(-0.696)#8,665 |
| 19. | 19153 | 6.0% | 6.5%(-0.515)#495 | 6.8%(-0.740)#8,776 |
| 20. | 19144 | 5.8% | 6.5%(-0.786)#534 | 6.8%(-1.01)#9,417 |
| 21. | 19118 | 5.5% | 6.5%(-1.02)#563 | 6.8%(-1.25)#10,019 |
| 22. | 19121 | 5.4% | 6.5%(-1.09)#575 | 6.8%(-1.32)#10,193 |
| 23. | 19132 | 5.4% | 6.5%(-1.16)#580 | 6.8%(-1.39)#10,385 |
| 24. | 19131 | 5.3% | 6.5%(-1.23)#589 | 6.8%(-1.45)#10,540 |
| 25. | 19116 | 5.1% | 6.5%(-1.44)#616 | 6.8%(-1.67)#11,102 |
| 26. | 19143 | 4.9% | 6.5%(-1.67)#654 | 6.8%(-1.89)#11,743 |
| 27. | 19154 | 4.8% | 6.5%(-1.73)#668 | 6.8%(-1.96)#11,927 |
| 28. | 19114 | 4.7% | 6.5%(-1.86)#678 | 6.8%(-2.08)#12,254 |
| 29. | 19137 | 4.4% | 6.5%(-2.14)#732 | 6.8%(-2.37)#13,178 |
| 30. | 19142 | 3.6% | 6.5%(-2.95)#906 | 6.8%(-3.18)#15,930 |
| 31. | 19134 | 3.5% | 6.5%(-3.01)#919 | 6.8%(-3.24)#16,152 |
| 32. | 19151 | 3.5% | 6.5%(-3.02)#922 | 6.8%(-3.25)#16,191 |
| 33. | 19135 | 3.4% | 6.5%(-3.13)#941 | 6.8%(-3.36)#16,606 |
| 34. | 19139 | 3.3% | 6.5%(-3.20)#951 | 6.8%(-3.42)#16,852 |
| 35. | 19111 | 3.3% | 6.5%(-3.28)#966 | 6.8%(-3.50)#17,173 |
| 36. | 19152 | 3.2% | 6.5%(-3.32)#977 | 6.8%(-3.54)#17,314 |
| 37. | 19120 | 3.0% | 6.5%(-3.58)#1,034 | 6.8%(-3.81)#18,267 |
| 38. | 19126 | 2.9% | 6.5%(-3.60)#1,037 | 6.8%(-3.83)#18,336 |
| 39. | 19150 | 2.5% | 6.5%(-3.99)#1,112 | 6.8%(-4.22)#19,860 |
| 40. | 19136 | 2.5% | 6.5%(-4.00)#1,114 | 6.8%(-4.23)#19,881 |
| 41. | 19124 | 2.4% | 6.5%(-4.09)#1,136 | 6.8%(-4.32)#20,218 |
| 42. | 19149 | 2.1% | 6.5%(-4.48)#1,206 | 6.8%(-4.70)#21,645 |
| 43. | 19133 | 1.9% | 6.5%(-4.60)#1,229 | 6.8%(-4.83)#22,109 |
| 44. | 19138 | 1.8% | 6.5%(-4.69)#1,241 | 6.8%(-4.92)#22,424 |
| 45. | 19141 | 1.2% | 6.5%(-5.30)#1,350 | 6.8%(-5.53)#24,389 |
| 46. | 19140 | 0.72% | 6.5%(-5.82)#1,409 | 6.8%(-6.04)#25,755 |
1
Common Questions
What are the Top 10 Zip Codes with the Highest Percentage of Population Employed in Computer, Engineering & Science in Philadelphia, PA?
Top 10 Zip Codes with the Highest Percentage of Population Employed in Computer, Engineering & Science in Philadelphia, PA are:
What zip code has the Highest Percentage of Population Employed in Computer, Engineering & Science in Philadelphia, PA?
19106 has the Highest Percentage of Population Employed in Computer, Engineering & Science in Philadelphia, PA with 17.4%.
What is the Percentage of Population Employed in Computer, Engineering & Science in Philadelphia, PA?
Percentage of Population Employed in Computer, Engineering & Science in Philadelphia is 6.3%.
What is the Percentage of Population Employed in Computer, Engineering & Science in Pennsylvania?
Percentage of Population Employed in Computer, Engineering & Science in Pennsylvania is 6.5%.
What is the Percentage of Population Employed in Computer, Engineering & Science in the United States?
Percentage of Population Employed in Computer, Engineering & Science in the United States is 6.8%.