Zip Codes with the Highest Percentage of Population Employed in Arts, Media & Entertainment in Philadelphia, PA
RELATED REPORTS & OPTIONS
Arts, Media & Entertainment
Philadelphia
Compare Zip Codes
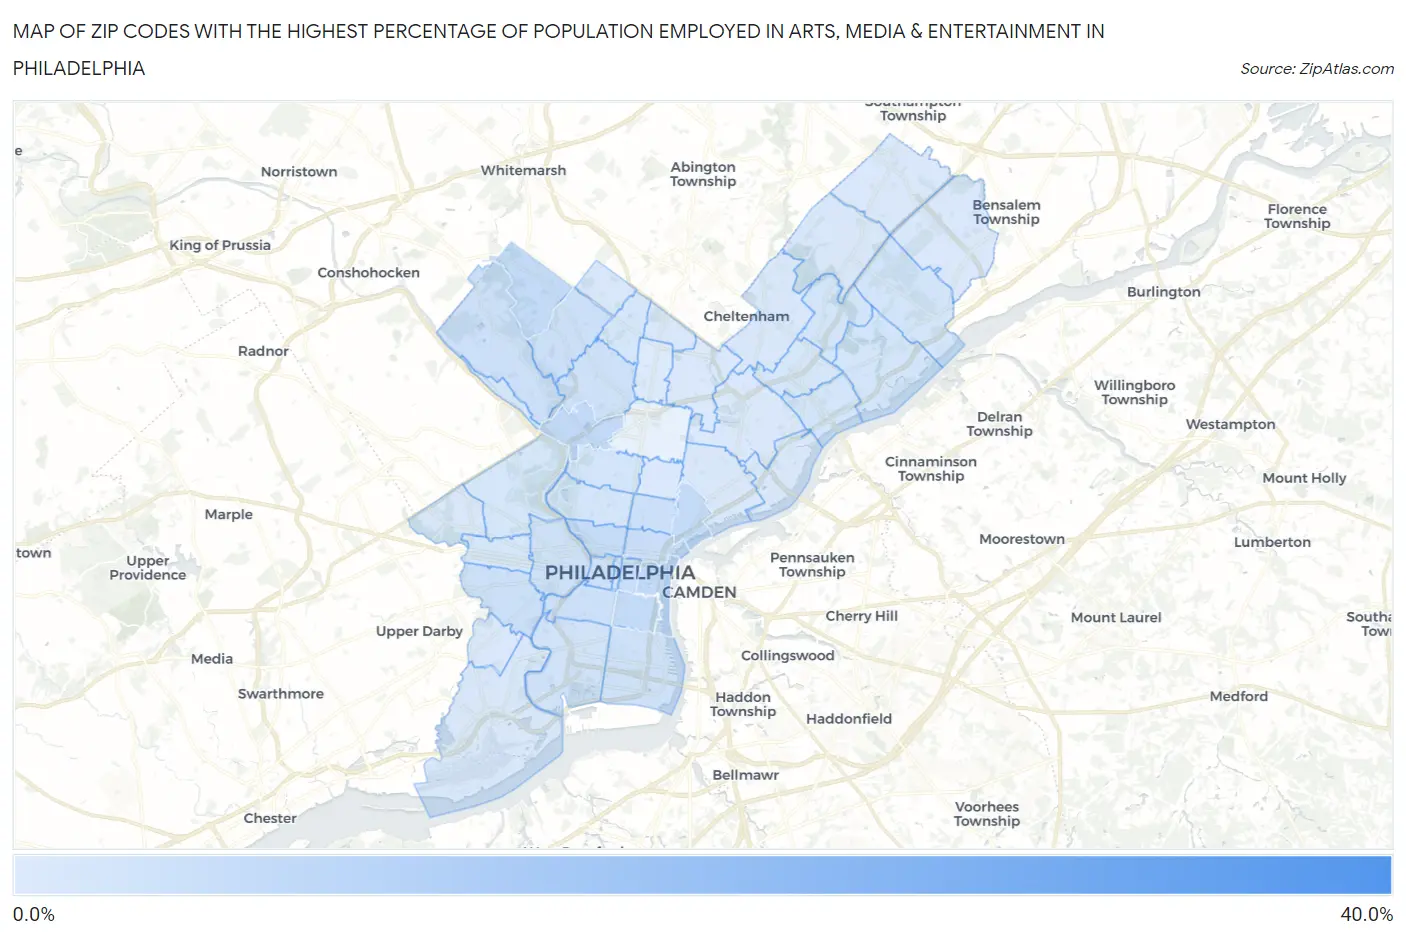
Map of Zip Codes with the Highest Percentage of Population Employed in Arts, Media & Entertainment in Philadelphia
0.0%
40.0%
Zip Codes with the Highest Percentage of Population Employed in Arts, Media & Entertainment in Philadelphia, PA
| Zip Code | % Employed | vs State | vs National | |
| 1. | 19108 | 39.1% | 1.8%(+37.4)#4 | 2.1%(+37.1)#23 |
| 2. | 19129 | 6.5% | 1.8%(+4.71)#32 | 2.1%(+4.40)#882 |
| 3. | 19147 | 6.1% | 1.8%(+4.34)#35 | 2.1%(+4.04)#1,004 |
| 4. | 19125 | 5.8% | 1.8%(+4.02)#41 | 2.1%(+3.71)#1,133 |
| 5. | 19118 | 5.7% | 1.8%(+3.96)#43 | 2.1%(+3.65)#1,156 |
| 6. | 19106 | 5.7% | 1.8%(+3.91)#44 | 2.1%(+3.60)#1,170 |
| 7. | 19130 | 5.2% | 1.8%(+3.49)#54 | 2.1%(+3.18)#1,376 |
| 8. | 19123 | 4.5% | 1.8%(+2.73)#73 | 2.1%(+2.42)#1,864 |
| 9. | 19107 | 4.3% | 1.8%(+2.59)#78 | 2.1%(+2.28)#1,997 |
| 10. | 19146 | 3.9% | 1.8%(+2.18)#89 | 2.1%(+1.87)#2,451 |
| 11. | 19143 | 3.7% | 1.8%(+1.99)#101 | 2.1%(+1.68)#2,711 |
| 12. | 19128 | 3.7% | 1.8%(+1.90)#109 | 2.1%(+1.60)#2,820 |
| 13. | 19122 | 3.6% | 1.8%(+1.82)#114 | 2.1%(+1.51)#2,963 |
| 14. | 19119 | 3.5% | 1.8%(+1.72)#122 | 2.1%(+1.41)#3,104 |
| 15. | 19144 | 3.4% | 1.8%(+1.62)#130 | 2.1%(+1.31)#3,308 |
| 16. | 19103 | 3.1% | 1.8%(+1.39)#144 | 2.1%(+1.09)#3,738 |
| 17. | 19148 | 3.1% | 1.8%(+1.39)#145 | 2.1%(+1.09)#3,741 |
| 18. | 19102 | 3.1% | 1.8%(+1.32)#151 | 2.1%(+1.01)#3,906 |
| 19. | 19104 | 3.0% | 1.8%(+1.23)#159 | 2.1%(+0.927)#4,118 |
| 20. | 19145 | 2.5% | 1.8%(+0.698)#241 | 2.1%(+0.391)#5,730 |
| 21. | 19121 | 2.2% | 1.8%(+0.460)#298 | 2.1%(+0.153)#6,758 |
| 22. | 19136 | 2.2% | 1.8%(+0.458)#300 | 2.1%(+0.150)#6,774 |
| 23. | 19152 | 2.2% | 1.8%(+0.419)#311 | 2.1%(+0.111)#6,952 |
| 24. | 19135 | 2.1% | 1.8%(+0.305)#341 | 2.1%(-0.003)#7,500 |
| 25. | 19114 | 2.0% | 1.8%(+0.239)#363 | 2.1%(-0.068)#7,850 |
| 26. | 19132 | 1.9% | 1.8%(+0.184)#380 | 2.1%(-0.123)#8,150 |
| 27. | 19127 | 1.7% | 1.8%(-0.096)#466 | 2.1%(-0.403)#9,938 |
| 28. | 19139 | 1.6% | 1.8%(-0.113)#479 | 2.1%(-0.420)#10,060 |
| 29. | 19138 | 1.6% | 1.8%(-0.172)#495 | 2.1%(-0.479)#10,445 |
| 30. | 19149 | 1.5% | 1.8%(-0.239)#521 | 2.1%(-0.546)#10,886 |
| 31. | 19131 | 1.4% | 1.8%(-0.334)#558 | 2.1%(-0.642)#11,569 |
| 32. | 19137 | 1.4% | 1.8%(-0.396)#592 | 2.1%(-0.703)#12,017 |
| 33. | 19134 | 1.3% | 1.8%(-0.431)#610 | 2.1%(-0.738)#12,283 |
| 34. | 19150 | 1.3% | 1.8%(-0.485)#631 | 2.1%(-0.792)#12,691 |
| 35. | 19111 | 1.2% | 1.8%(-0.518)#644 | 2.1%(-0.825)#12,968 |
| 36. | 19153 | 1.1% | 1.8%(-0.625)#697 | 2.1%(-0.932)#13,756 |
| 37. | 19115 | 1.1% | 1.8%(-0.691)#734 | 2.1%(-0.998)#14,294 |
| 38. | 19126 | 1.1% | 1.8%(-0.692)#735 | 2.1%(-0.999)#14,301 |
| 39. | 19151 | 1.1% | 1.8%(-0.694)#736 | 2.1%(-1.00)#14,319 |
| 40. | 19154 | 0.83% | 1.8%(-0.925)#847 | 2.1%(-1.23)#16,192 |
| 41. | 19116 | 0.72% | 1.8%(-1.03)#891 | 2.1%(-1.34)#17,053 |
| 42. | 19133 | 0.69% | 1.8%(-1.07)#910 | 2.1%(-1.38)#17,375 |
| 43. | 19142 | 0.57% | 1.8%(-1.18)#966 | 2.1%(-1.49)#18,304 |
| 44. | 19120 | 0.53% | 1.8%(-1.22)#979 | 2.1%(-1.53)#18,577 |
| 45. | 19124 | 0.36% | 1.8%(-1.40)#1,074 | 2.1%(-1.70)#19,935 |
| 46. | 19141 | 0.10% | 1.8%(-1.65)#1,156 | 2.1%(-1.96)#21,388 |
1
Common Questions
What are the Top 10 Zip Codes with the Highest Percentage of Population Employed in Arts, Media & Entertainment in Philadelphia, PA?
Top 10 Zip Codes with the Highest Percentage of Population Employed in Arts, Media & Entertainment in Philadelphia, PA are:
What zip code has the Highest Percentage of Population Employed in Arts, Media & Entertainment in Philadelphia, PA?
19108 has the Highest Percentage of Population Employed in Arts, Media & Entertainment in Philadelphia, PA with 39.1%.
What is the Percentage of Population Employed in Arts, Media & Entertainment in Philadelphia, PA?
Percentage of Population Employed in Arts, Media & Entertainment in Philadelphia is 2.4%.
What is the Percentage of Population Employed in Arts, Media & Entertainment in Pennsylvania?
Percentage of Population Employed in Arts, Media & Entertainment in Pennsylvania is 1.8%.
What is the Percentage of Population Employed in Arts, Media & Entertainment in the United States?
Percentage of Population Employed in Arts, Media & Entertainment in the United States is 2.1%.