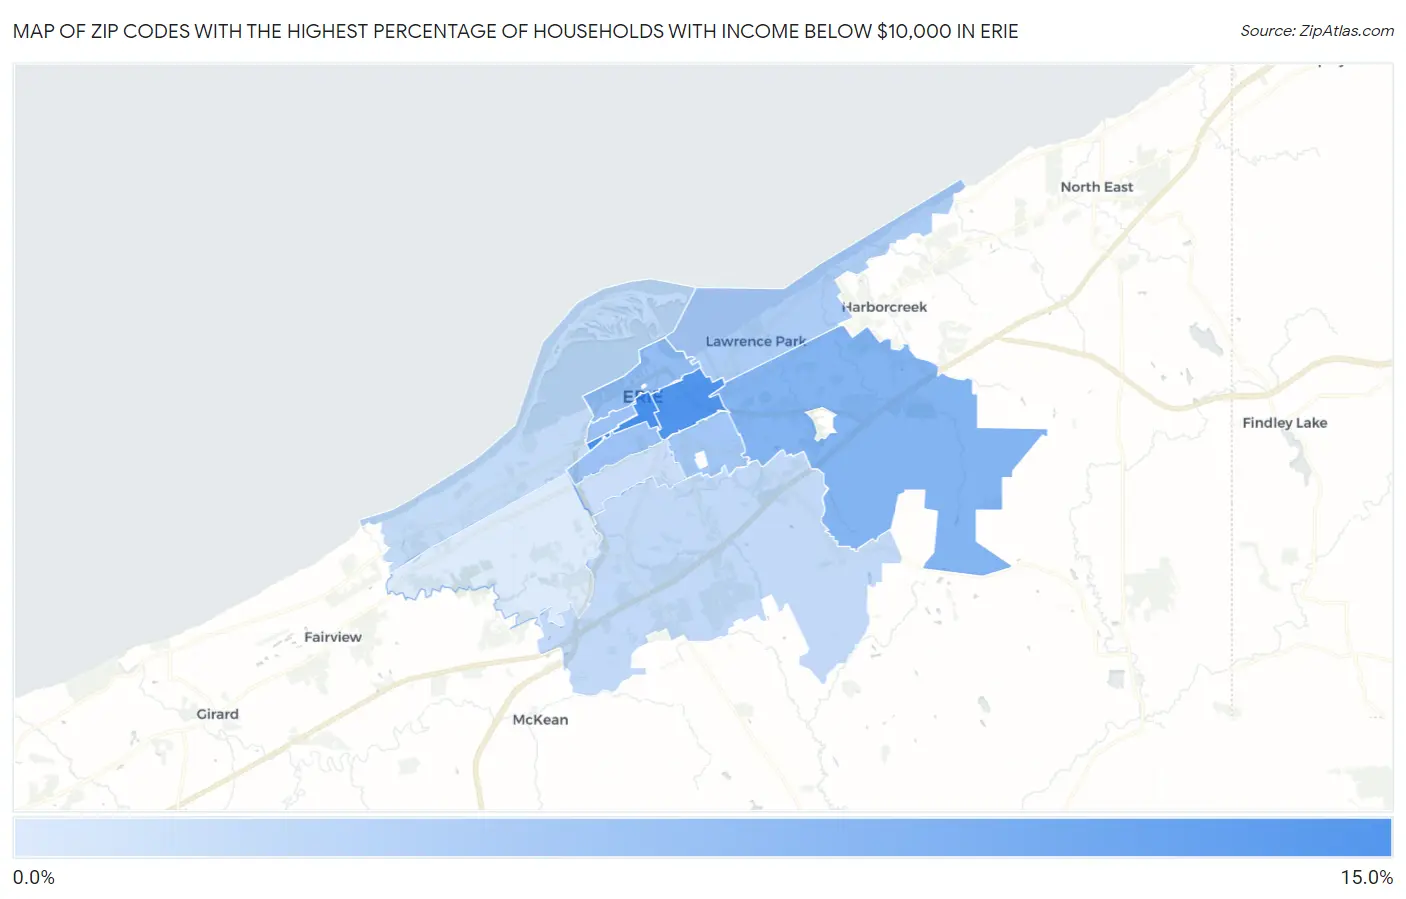
Zip Codes with the Highest Percentage of Households with Income Below $10,000 in Erie, PA
RELATED REPORTS & OPTIONS
Household Income | $0-10k
Erie
Compare Zip Codes
Map of Zip Codes with the Highest Percentage of Households with Income Below $10,000 in Erie
0.0%
15.0%
Zip Codes with the Highest Percentage of Households with Income Below $10,000 in Erie, PA
| Zip Code | Households with Income < $10k | vs State | vs National | |
| 1. | 16501 | 12.8% | 4.8%(+8.00)#80 | 4.9%(+7.90)#2,174 |
| 2. | 16503 | 12.3% | 4.8%(+7.50)#85 | 4.9%(+7.40)#2,331 |
| 3. | 16510 | 8.7% | 4.8%(+3.90)#176 | 4.9%(+3.80)#4,723 |
| 4. | 16507 | 7.7% | 4.8%(+2.90)#218 | 4.9%(+2.80)#5,958 |
| 5. | 16502 | 7.1% | 4.8%(+2.30)#249 | 4.9%(+2.20)#6,809 |
| 6. | 16504 | 6.6% | 4.8%(+1.80)#300 | 4.9%(+1.70)#7,743 |
| 7. | 16511 | 6.0% | 4.8%(+1.20)#356 | 4.9%(+1.10)#9,038 |
| 8. | 16509 | 4.7% | 4.8%(-0.100)#531 | 4.9%(-0.200)#12,671 |
| 9. | 16505 | 4.5% | 4.8%(-0.300)#576 | 4.9%(-0.400)#13,420 |
| 10. | 16508 | 4.0% | 4.8%(-0.800)#657 | 4.9%(-0.900)#15,319 |
| 11. | 16506 | 2.9% | 4.8%(-1.90)#940 | 4.9%(-2.00)#19,864 |
1
Common Questions
What are the Top 10 Zip Codes with the Highest Percentage of Households with Income Below $10,000 in Erie, PA?
Top 10 Zip Codes with the Highest Percentage of Households with Income Below $10,000 in Erie, PA are:
What zip code has the Highest Percentage of Households with Income Below $10,000 in Erie, PA?
16501 has the Highest Percentage of Households with Income Below $10,000 in Erie, PA with 12.8%.
What is the Percentage of Households with Income Below $10,000 in Erie, PA?
Percentage of Households with Income Below $10,000 in Erie is 7.8%.
What is the Percentage of Households with Income Below $10,000 in Pennsylvania?
Percentage of Households with Income Below $10,000 in Pennsylvania is 4.8%.
What is the Percentage of Households with Income Below $10,000 in the United States?
Percentage of Households with Income Below $10,000 in the United States is 4.9%.