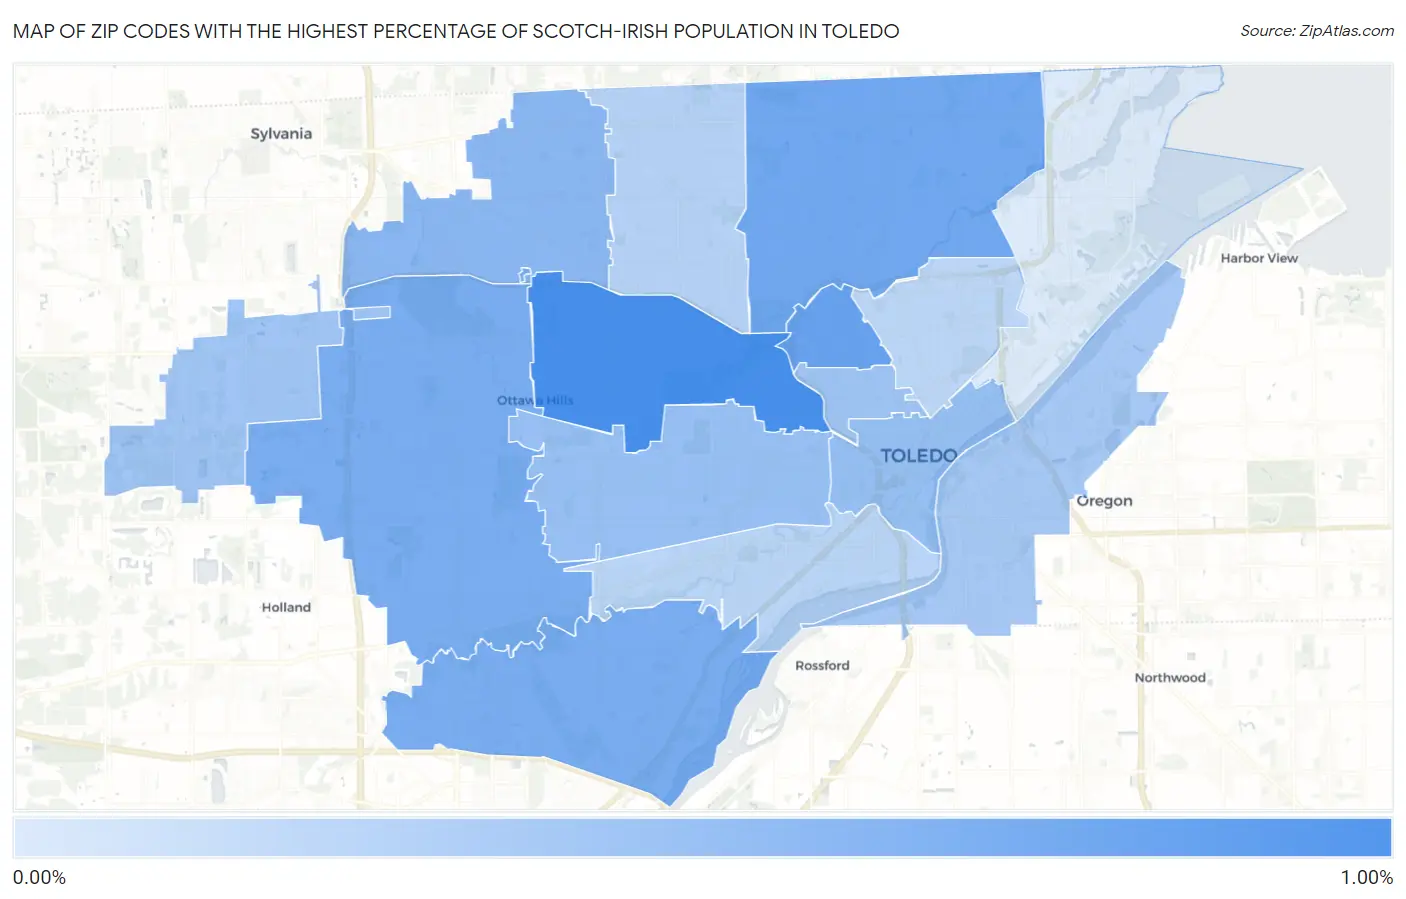
Zip Codes with the Highest Percentage of Scotch-Irish Population in Toledo, OH
RELATED REPORTS & OPTIONS
Scotch-Irish
Toledo
Compare Zip Codes
Map of Zip Codes with the Highest Percentage of Scotch-Irish Population in Toledo
0.00%
1.00%
Zip Codes with the Highest Percentage of Scotch-Irish Population in Toledo, OH
| Zip Code | Scotch-Irish | vs State | vs National | |
| 1. | 43606 | 0.91% | 0.87%(+0.040)#407 | 0.82%(+0.095)#10,678 |
| 2. | 43610 | 0.73% | 0.87%(-0.139)#496 | 0.82%(-0.085)#12,932 |
| 3. | 43612 | 0.69% | 0.87%(-0.179)#516 | 0.82%(-0.125)#13,495 |
| 4. | 43615 | 0.63% | 0.87%(-0.238)#559 | 0.82%(-0.183)#14,325 |
| 5. | 43614 | 0.63% | 0.87%(-0.239)#561 | 0.82%(-0.184)#14,341 |
| 6. | 43623 | 0.55% | 0.87%(-0.327)#612 | 0.82%(-0.273)#15,672 |
| 7. | 43604 | 0.49% | 0.87%(-0.384)#652 | 0.82%(-0.330)#16,615 |
| 8. | 43607 | 0.48% | 0.87%(-0.394)#664 | 0.82%(-0.339)#16,777 |
| 9. | 43620 | 0.43% | 0.87%(-0.442)#682 | 0.82%(-0.387)#17,553 |
| 10. | 43617 | 0.42% | 0.87%(-0.449)#689 | 0.82%(-0.395)#17,682 |
| 11. | 43605 | 0.40% | 0.87%(-0.476)#711 | 0.82%(-0.421)#18,127 |
| 12. | 43613 | 0.31% | 0.87%(-0.559)#771 | 0.82%(-0.504)#19,504 |
| 13. | 43609 | 0.29% | 0.87%(-0.586)#790 | 0.82%(-0.531)#19,960 |
| 14. | 43608 | 0.28% | 0.87%(-0.594)#800 | 0.82%(-0.540)#20,096 |
| 15. | 43611 | 0.099% | 0.87%(-0.773)#891 | 0.82%(-0.718)#23,055 |
1
Common Questions
What are the Top 10 Zip Codes with the Highest Percentage of Scotch-Irish Population in Toledo, OH?
Top 10 Zip Codes with the Highest Percentage of Scotch-Irish Population in Toledo, OH are:
What zip code has the Highest Percentage of Scotch-Irish Population in Toledo, OH?
43606 has the Highest Percentage of Scotch-Irish Population in Toledo, OH with 0.91%.
What is the Percentage of Scotch-Irish Population in Toledo, OH?
Percentage of Scotch-Irish Population in Toledo is 0.47%.
What is the Percentage of Scotch-Irish Population in Ohio?
Percentage of Scotch-Irish Population in Ohio is 0.87%.
What is the Percentage of Scotch-Irish Population in the United States?
Percentage of Scotch-Irish Population in the United States is 0.82%.