Grass Valley, NV
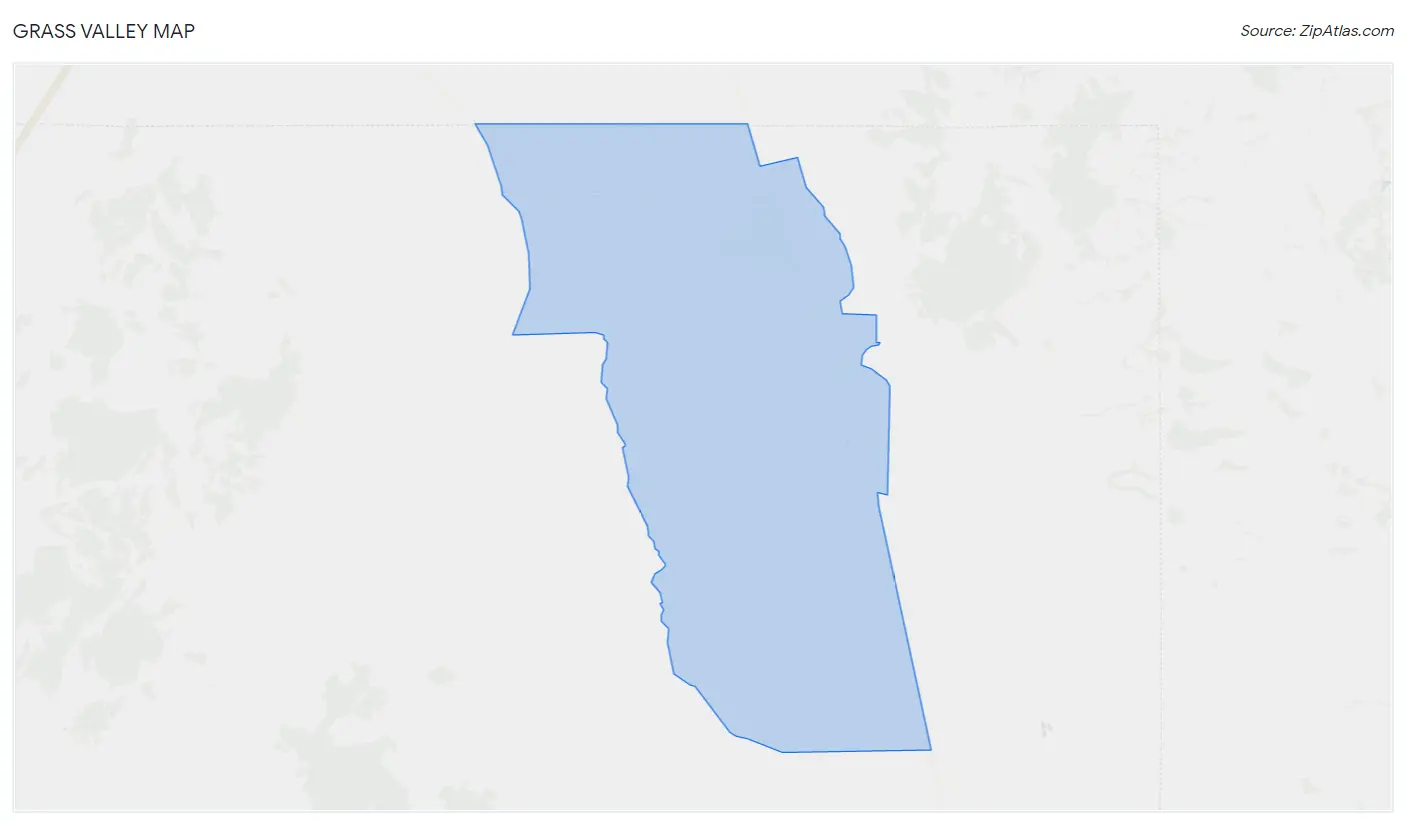
Grass Valley Map
Grass Valley Overview
1,190
TOTAL POPULATION
669
MALE POPULATION
521
FEMALE POPULATION
128.41
MALES / 100 FEMALES
77.88
FEMALES / 100 MALES
27.9
MEDIAN AGE
3.7
AVG FAMILY SIZE
3.3
AVG HOUSEHOLD SIZE
$37,866
PER CAPITA INCOME
$91,368
AVG FAMILY INCOME
$77,308
AVG HOUSEHOLD INCOME
77.2%
WAGE / INCOME GAP [ % ]
22.8¢/ $1
WAGE / INCOME GAP [ $ ]
0.35
INEQUALITY / GINI INDEX
608
LABOR FORCE [ PEOPLE ]
66.2%
PERCENT IN LABOR FORCE
12.2%
UNEMPLOYMENT RATE
Race in Grass Valley
The most populous races in Grass Valley are White / Caucasian (1,081 | 90.8%), Hispanic or Latino (272 | 22.9%), and Some other Race (92 | 7.7%).
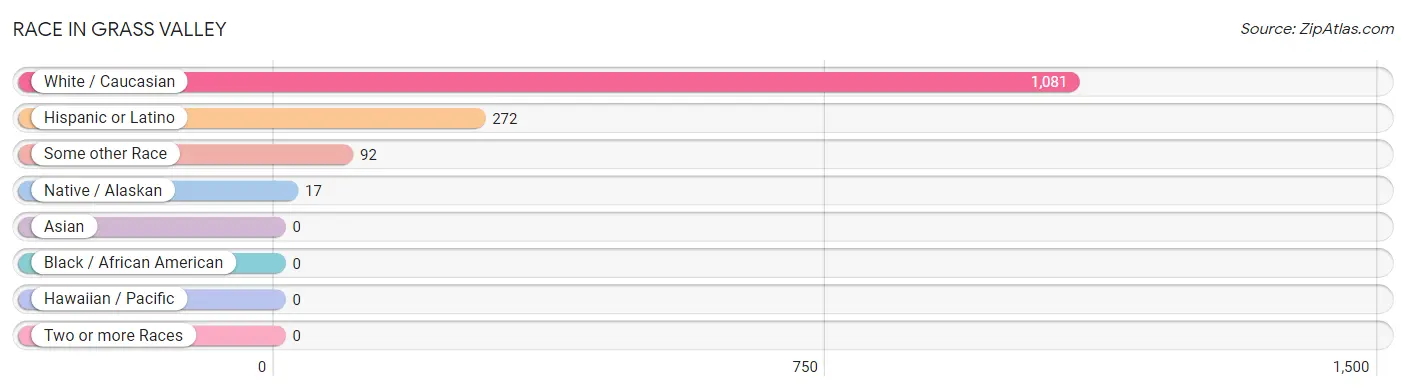
| Race | # Population | % Population |
| Asian | 0 | 0.0% |
| Black / African American | 0 | 0.0% |
| Hawaiian / Pacific | 0 | 0.0% |
| Hispanic or Latino | 272 | 22.9% |
| Native / Alaskan | 17 | 1.4% |
| White / Caucasian | 1,081 | 90.8% |
| Two or more Races | 0 | 0.0% |
| Some other Race | 92 | 7.7% |
| Total | 1,190 | 100.0% |
Ancestry in Grass Valley
The most populous ancestries reported in Grass Valley are German (217 | 18.2%), English (200 | 16.8%), Scotch-Irish (164 | 13.8%), Irish (114 | 9.6%), and Mexican (94 | 7.9%), together accounting for 66.3% of all Grass Valley residents.
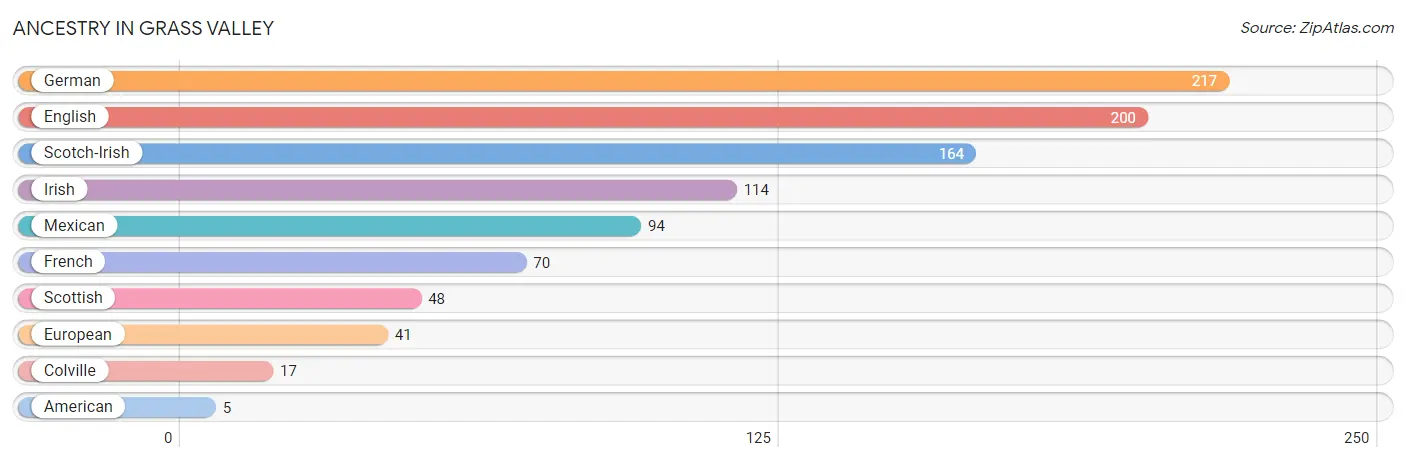
| Ancestry | # Population | % Population |
| American | 5 | 0.4% |
| Colville | 17 | 1.4% |
| English | 200 | 16.8% |
| European | 41 | 3.5% |
| French | 70 | 5.9% |
| German | 217 | 18.2% |
| Irish | 114 | 9.6% |
| Mexican | 94 | 7.9% |
| Scotch-Irish | 164 | 13.8% |
| Scottish | 48 | 4.0% | View All 10 Rows |
Immigrants in Grass Valley
The most numerous immigrant groups reported in Grass Valley came from Central America (51 | 4.3%), Latin America (51 | 4.3%), and Mexico (51 | 4.3%), together accounting for 12.9% of all Grass Valley residents.
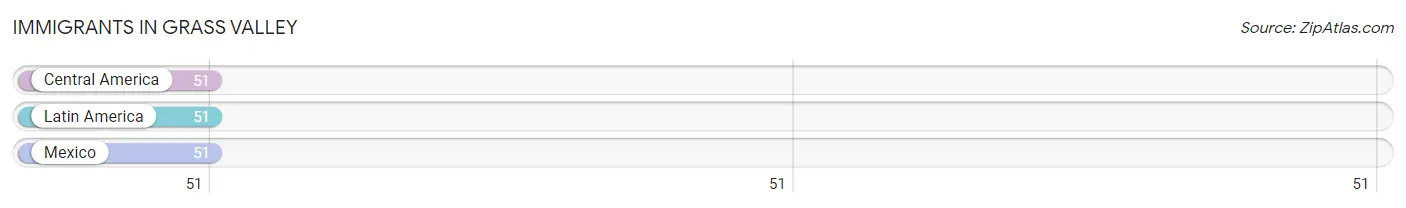
| Immigration Origin | # Population | % Population |
| Central America | 51 | 4.3% |
| Latin America | 51 | 4.3% |
| Mexico | 51 | 4.3% | View All 3 Rows |
Sex and Age in Grass Valley
Sex and Age in Grass Valley
The most populous age groups in Grass Valley are 25 to 29 Years (100 | 14.9%) for men and 5 to 9 Years (93 | 17.8%) for women.
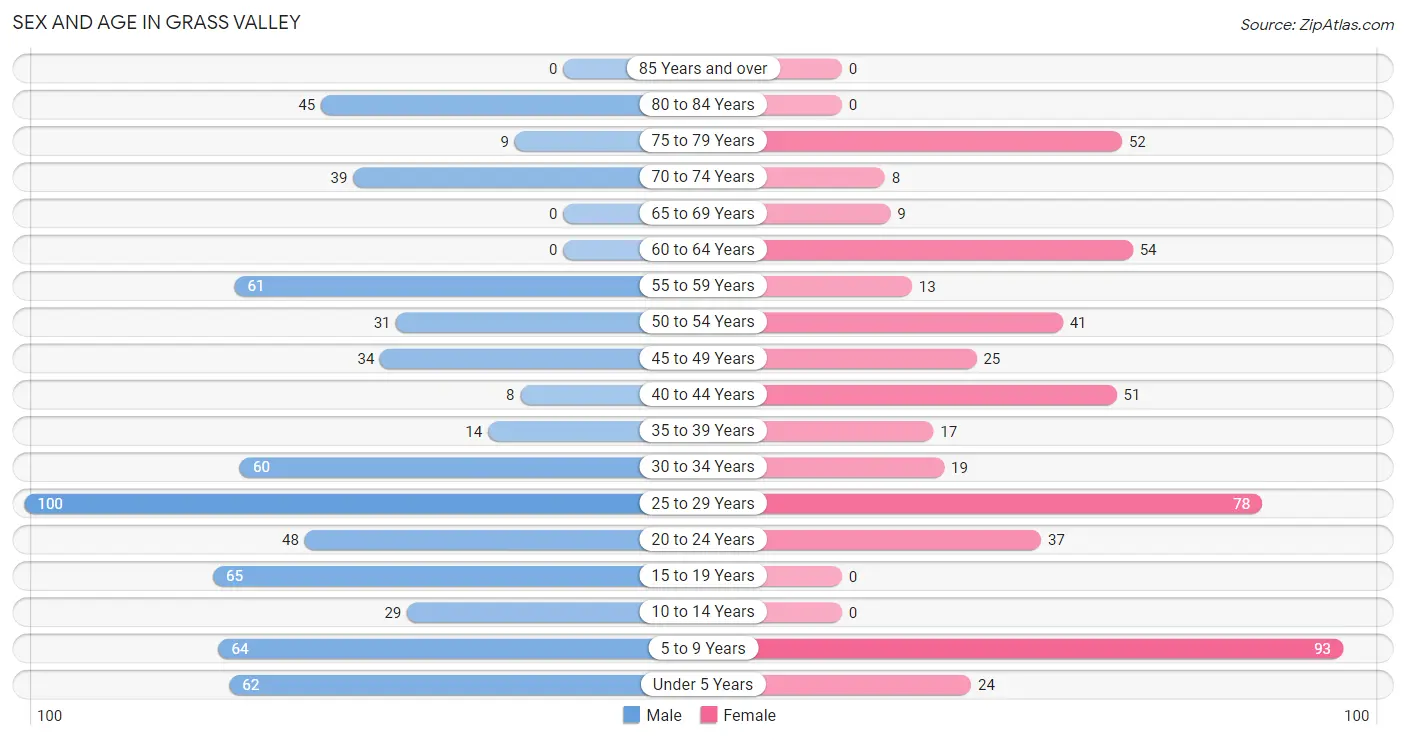
| Age Bracket | Male | Female |
| Under 5 Years | 62 (9.3%) | 24 (4.6%) |
| 5 to 9 Years | 64 (9.6%) | 93 (17.8%) |
| 10 to 14 Years | 29 (4.3%) | 0 (0.0%) |
| 15 to 19 Years | 65 (9.7%) | 0 (0.0%) |
| 20 to 24 Years | 48 (7.2%) | 37 (7.1%) |
| 25 to 29 Years | 100 (14.9%) | 78 (15.0%) |
| 30 to 34 Years | 60 (9.0%) | 19 (3.6%) |
| 35 to 39 Years | 14 (2.1%) | 17 (3.3%) |
| 40 to 44 Years | 8 (1.2%) | 51 (9.8%) |
| 45 to 49 Years | 34 (5.1%) | 25 (4.8%) |
| 50 to 54 Years | 31 (4.6%) | 41 (7.9%) |
| 55 to 59 Years | 61 (9.1%) | 13 (2.5%) |
| 60 to 64 Years | 0 (0.0%) | 54 (10.4%) |
| 65 to 69 Years | 0 (0.0%) | 9 (1.7%) |
| 70 to 74 Years | 39 (5.8%) | 8 (1.5%) |
| 75 to 79 Years | 9 (1.3%) | 52 (10.0%) |
| 80 to 84 Years | 45 (6.7%) | 0 (0.0%) |
| 85 Years and over | 0 (0.0%) | 0 (0.0%) |
| Total | 669 (100.0%) | 521 (100.0%) |
Families and Households in Grass Valley
Median Family Size in Grass Valley
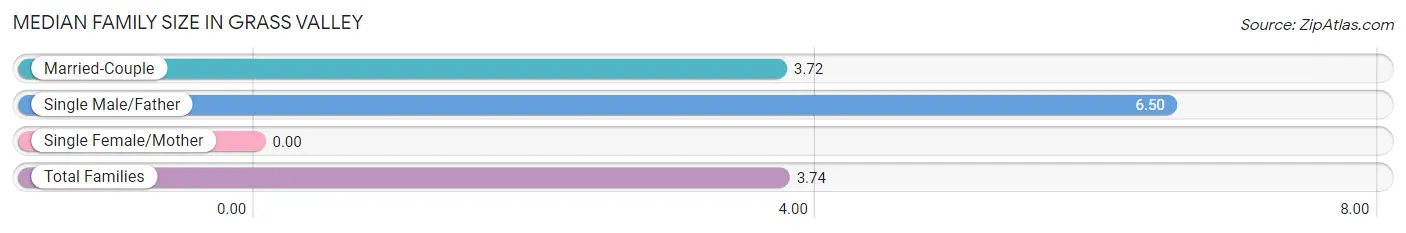
| Family Type | # Families | Family Size |
| Married-Couple | 296 (99.3%) | 3.72 |
| Single Male/Father | 2 (0.7%) | 6.50 |
| Single Female/Mother | 0 (0.0%) | - |
| Total Families | 298 (100.0%) | 3.74 |
Median Household Size in Grass Valley
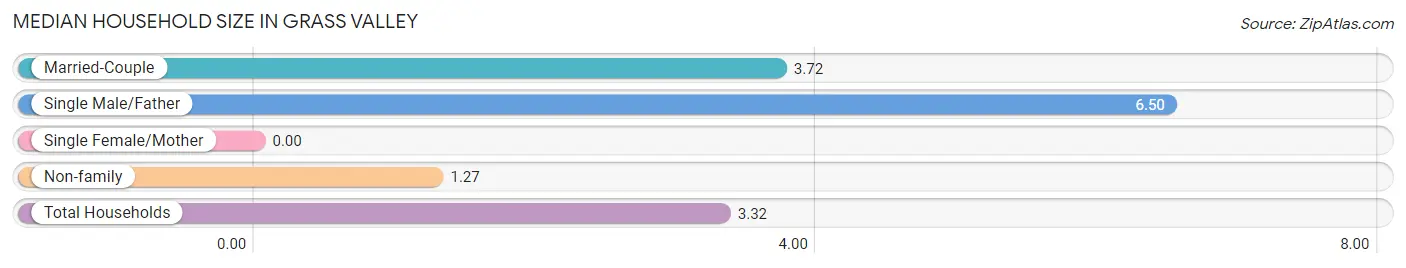
| Household Type | # Households | Household Size |
| Married-Couple | 296 (82.7%) | 3.72 |
| Single Male/Father | 2 (0.6%) | 6.50 |
| Single Female/Mother | 0 (0.0%) | - |
| Non-family | 60 (16.8%) | 1.27 |
| Total Households | 358 (100.0%) | 3.32 |
Household Size by Marriage Status in Grass Valley
Out of a total of 358 households in Grass Valley, 298 (83.2%) are family households, while 60 (16.8%) are nonfamily households. The most numerous type of family households are 2-person households, comprising 136, and the most common type of nonfamily households are 1-person households, comprising 44.
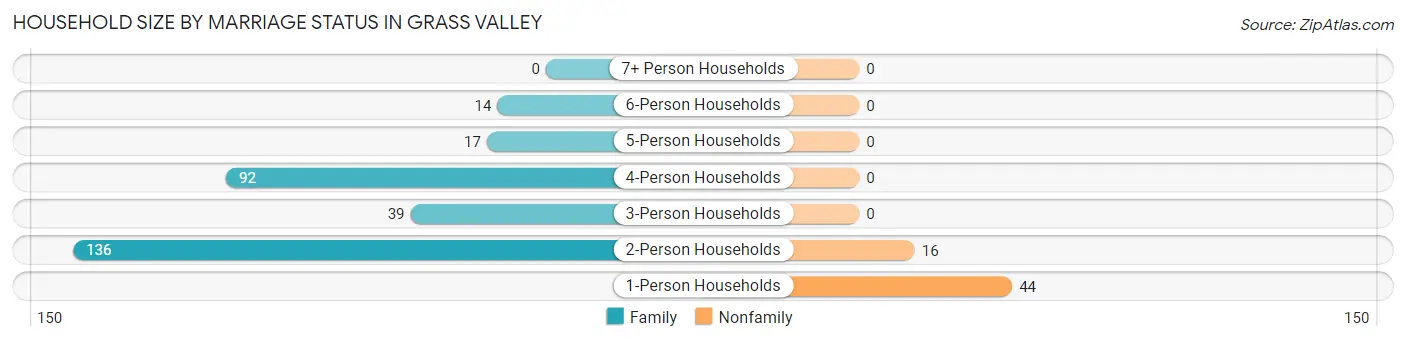
| Household Size | Family Households | Nonfamily Households |
| 1-Person Households | - | 44 (12.3%) |
| 2-Person Households | 136 (38.0%) | 16 (4.5%) |
| 3-Person Households | 39 (10.9%) | 0 (0.0%) |
| 4-Person Households | 92 (25.7%) | 0 (0.0%) |
| 5-Person Households | 17 (4.8%) | 0 (0.0%) |
| 6-Person Households | 14 (3.9%) | 0 (0.0%) |
| 7+ Person Households | 0 (0.0%) | 0 (0.0%) |
| Total | 298 (83.2%) | 60 (16.8%) |
Female Fertility in Grass Valley
Fertility by Age in Grass Valley
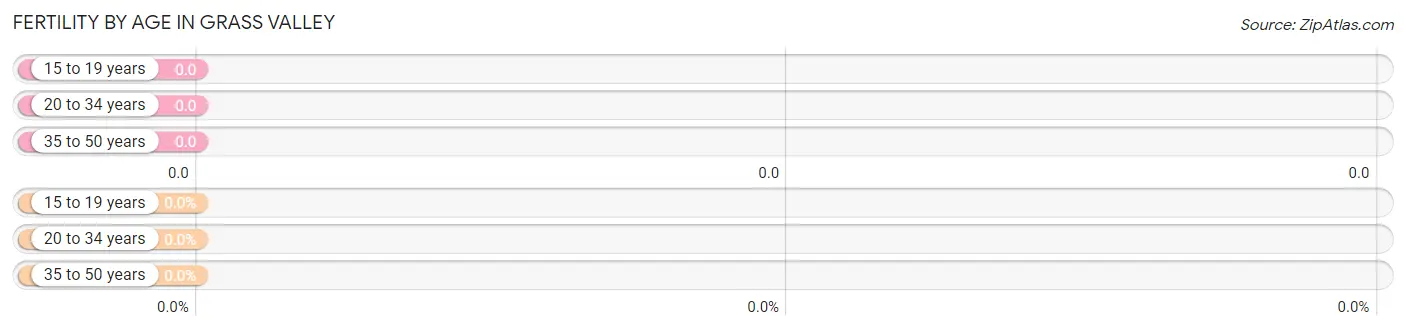
| Age Bracket | Women with Births | Births / 1,000 Women |
| 15 to 19 years | 0 (0.0%) | 0.0 |
| 20 to 34 years | 0 (0.0%) | 0.0 |
| 35 to 50 years | 0 (0.0%) | 0.0 |
| Total | 0 (0.0%) | 0.0 |
Fertility by Age by Marriage Status in Grass Valley
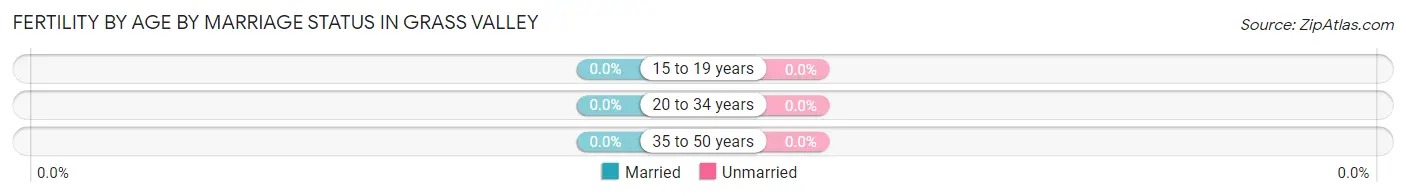
| Age Bracket | Married | Unmarried |
| 15 to 19 years | 0 (0.0%) | 0 (0.0%) |
| 20 to 34 years | 0 (0.0%) | 0 (0.0%) |
| 35 to 50 years | 0 (0.0%) | 0 (0.0%) |
| Total | 0 (0.0%) | 0 (0.0%) |
Fertility by Education in Grass Valley
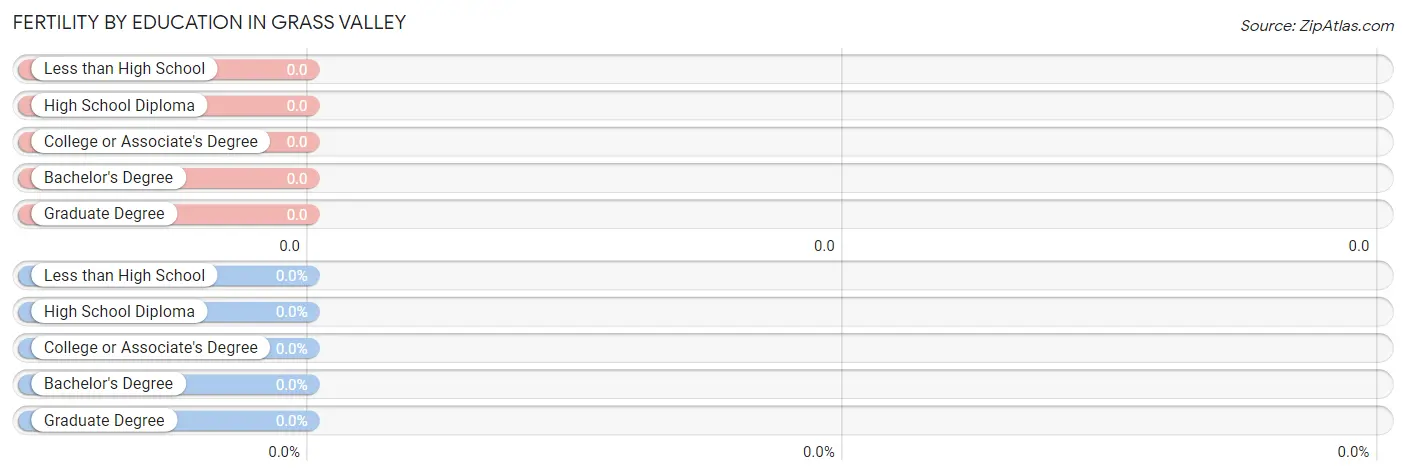
| Educational Attainment | Women with Births | Births / 1,000 Women |
| Less than High School | 0 (0.0%) | 0.0 |
| High School Diploma | 0 (0.0%) | 0.0 |
| College or Associate's Degree | 0 (0.0%) | 0.0 |
| Bachelor's Degree | 0 (0.0%) | 0.0 |
| Graduate Degree | 0 (0.0%) | 0.0 |
| Total | 0 (0.0%) | 0.0 |
Fertility by Education by Marriage Status in Grass Valley
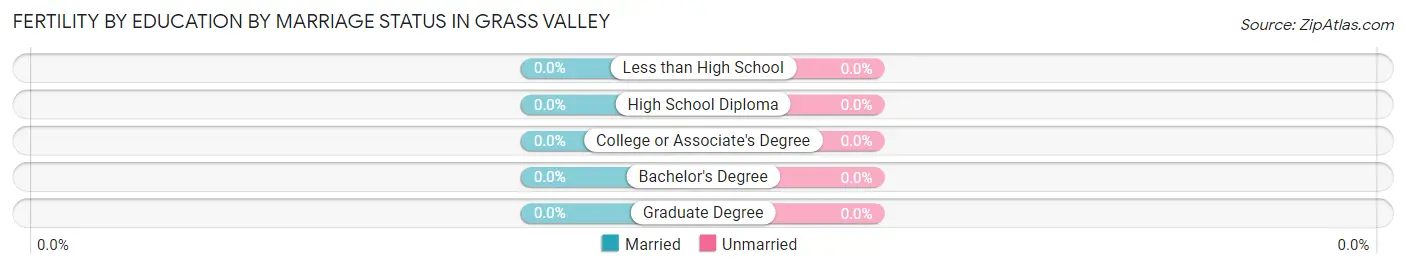
| Educational Attainment | Married | Unmarried |
| Less than High School | 0 (0.0%) | 0 (0.0%) |
| High School Diploma | 0 (0.0%) | 0 (0.0%) |
| College or Associate's Degree | 0 (0.0%) | 0 (0.0%) |
| Bachelor's Degree | 0 (0.0%) | 0 (0.0%) |
| Graduate Degree | 0 (0.0%) | 0 (0.0%) |
| Total | 0 (0.0%) | 0 (0.0%) |
Income in Grass Valley
Income Overview in Grass Valley
Per Capita Income in Grass Valley is $37,866, while median incomes of families and households are $91,368 and $77,308 respectively.
| Characteristic | Number | Measure |
| Per Capita Income | 1,190 | $37,866 |
| Median Family Income | 298 | $91,368 |
| Mean Family Income | 298 | $111,393 |
| Median Household Income | 358 | $77,308 |
| Mean Household Income | 358 | $98,176 |
| Income Deficit | 298 | $0 |
| Wage / Income Gap (%) | 1,190 | 77.20% |
| Wage / Income Gap ($) | 1,190 | 22.80¢ per $1 |
| Gini / Inequality Index | 1,190 | 0.35 |
Earnings by Sex in Grass Valley
Average Earnings in Grass Valley are $51,004, $90,189 for men and $20,565 for women, a difference of 77.2%.
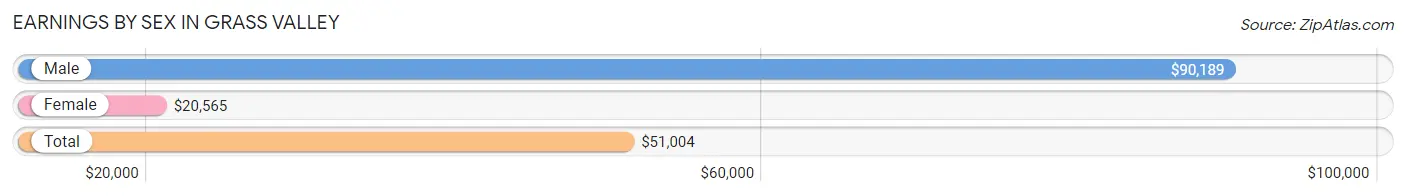
| Sex | Number | Average Earnings |
| Male | 356 (56.1%) | $90,189 |
| Female | 279 (43.9%) | $20,565 |
| Total | 635 (100.0%) | $51,004 |
Earnings by Sex by Income Bracket in Grass Valley
The most common earnings brackets in Grass Valley are $100,000+ for men (100 | 28.1%) and $17,500 to $19,999 for women (46 | 16.5%).
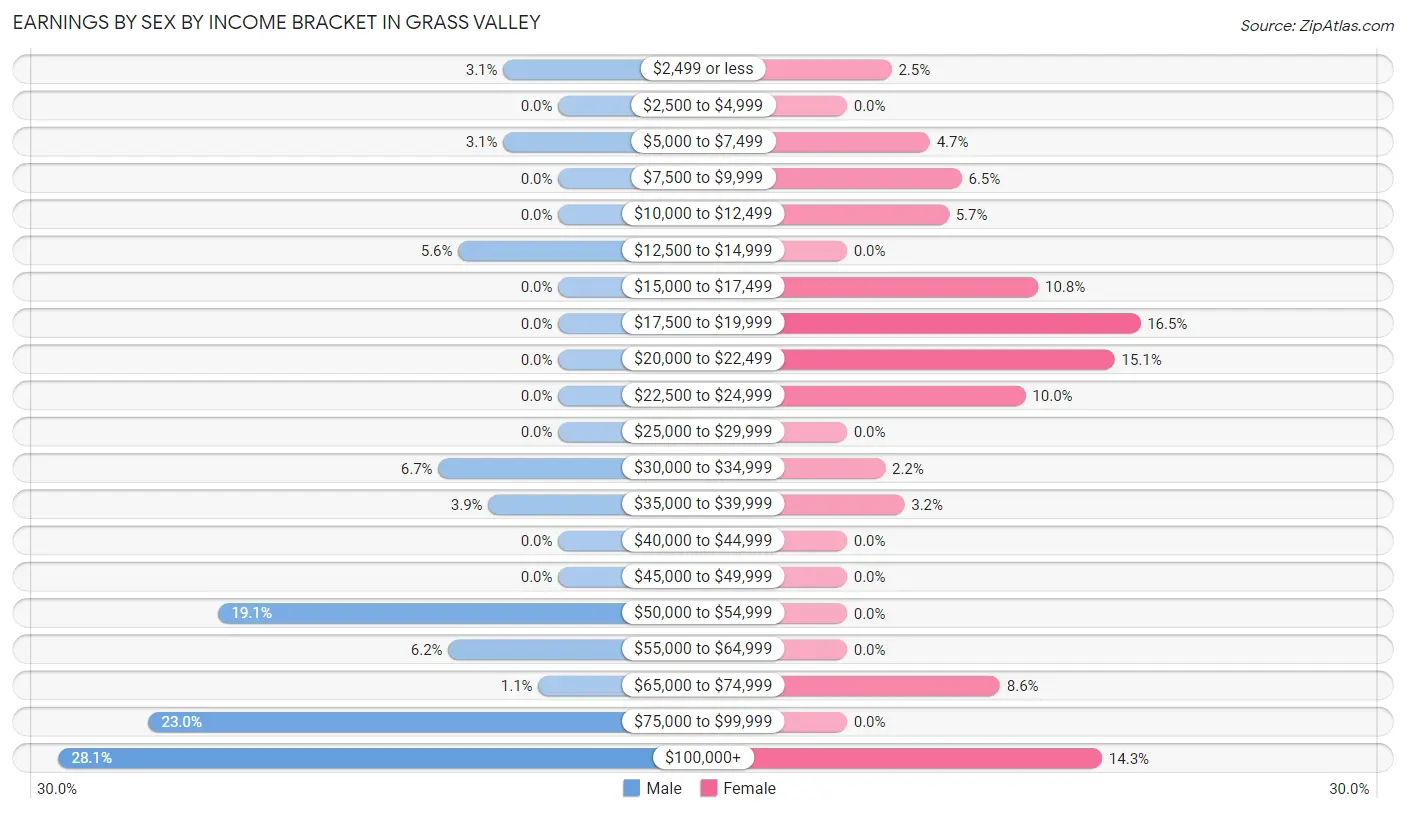
| Income | Male | Female |
| $2,499 or less | 11 (3.1%) | 7 (2.5%) |
| $2,500 to $4,999 | 0 (0.0%) | 0 (0.0%) |
| $5,000 to $7,499 | 11 (3.1%) | 13 (4.7%) |
| $7,500 to $9,999 | 0 (0.0%) | 18 (6.5%) |
| $10,000 to $12,499 | 0 (0.0%) | 16 (5.7%) |
| $12,500 to $14,999 | 20 (5.6%) | 0 (0.0%) |
| $15,000 to $17,499 | 0 (0.0%) | 30 (10.7%) |
| $17,500 to $19,999 | 0 (0.0%) | 46 (16.5%) |
| $20,000 to $22,499 | 0 (0.0%) | 42 (15.0%) |
| $22,500 to $24,999 | 0 (0.0%) | 28 (10.0%) |
| $25,000 to $29,999 | 0 (0.0%) | 0 (0.0%) |
| $30,000 to $34,999 | 24 (6.7%) | 6 (2.1%) |
| $35,000 to $39,999 | 14 (3.9%) | 9 (3.2%) |
| $40,000 to $44,999 | 0 (0.0%) | 0 (0.0%) |
| $45,000 to $49,999 | 0 (0.0%) | 0 (0.0%) |
| $50,000 to $54,999 | 68 (19.1%) | 0 (0.0%) |
| $55,000 to $64,999 | 22 (6.2%) | 0 (0.0%) |
| $65,000 to $74,999 | 4 (1.1%) | 24 (8.6%) |
| $75,000 to $99,999 | 82 (23.0%) | 0 (0.0%) |
| $100,000+ | 100 (28.1%) | 40 (14.3%) |
| Total | 356 (100.0%) | 279 (100.0%) |
Earnings by Sex by Educational Attainment in Grass Valley
Average earnings in Grass Valley are $91,132 for men and $19,511 for women, a difference of 78.6%. Men with an educational attainment of high school diploma enjoy the highest average annual earnings of $91,156, while those with high school diploma education earn the least with $91,156. Women with an educational attainment of high school diploma earn the most with the average annual earnings of $22,857, while those with college or associate's degree education have the smallest earnings of $16,208.
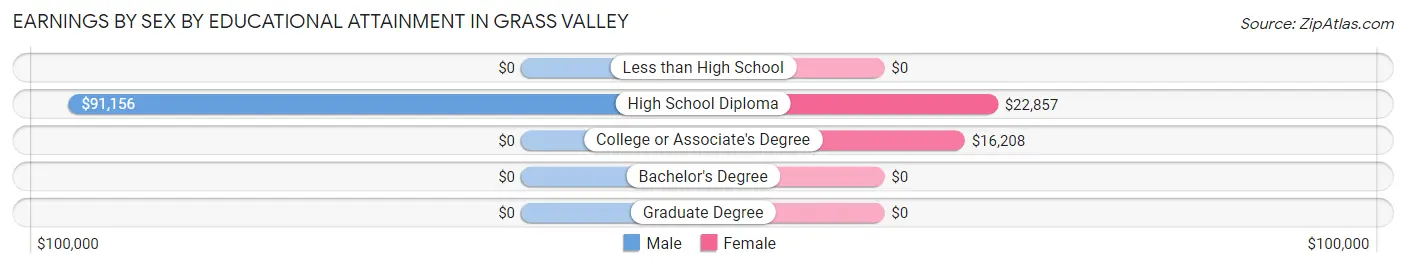
| Educational Attainment | Male Income | Female Income |
| Less than High School | - | - |
| High School Diploma | $91,156 | $22,857 |
| College or Associate's Degree | - | - |
| Bachelor's Degree | - | - |
| Graduate Degree | - | - |
| Total | $91,132 | $19,511 |
Family Income in Grass Valley
Family Income Brackets in Grass Valley
According to the Grass Valley family income data, there are 74 families falling into the $75,000 to $99,999 income range, which is the most common income bracket and makes up 24.8% of all families.
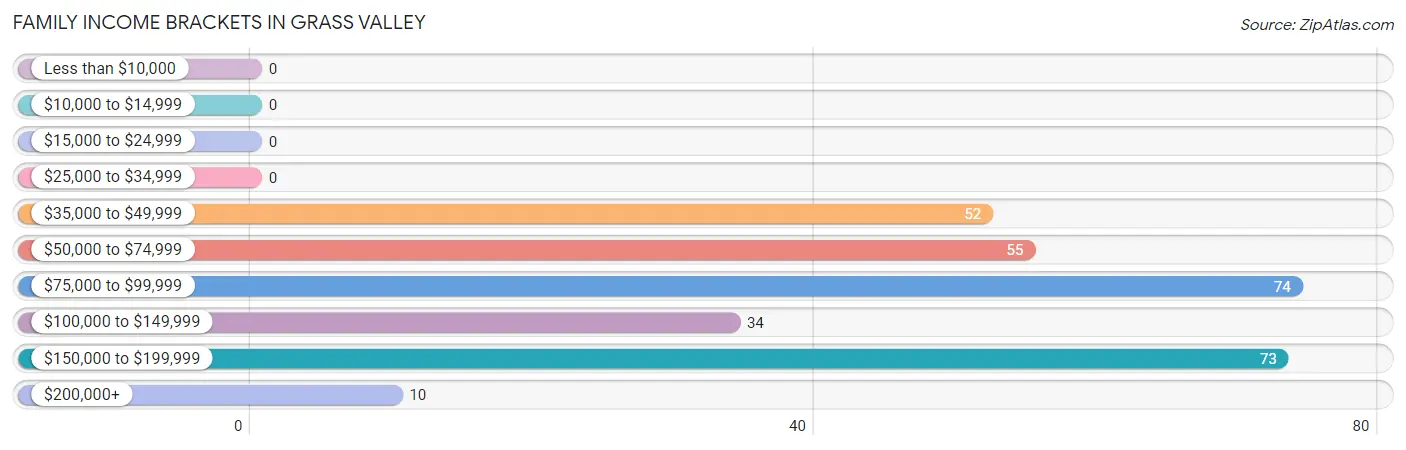
| Income Bracket | # Families | % Families |
| Less than $10,000 | 0 | 0.0% |
| $10,000 to $14,999 | 0 | 0.0% |
| $15,000 to $24,999 | 0 | 0.0% |
| $25,000 to $34,999 | 0 | 0.0% |
| $35,000 to $49,999 | 52 | 17.4% |
| $50,000 to $74,999 | 55 | 18.5% |
| $75,000 to $99,999 | 74 | 24.8% |
| $100,000 to $149,999 | 34 | 11.4% |
| $150,000 to $199,999 | 73 | 24.5% |
| $200,000+ | 10 | 3.4% |
Family Income by Famaliy Size in Grass Valley
3-person families (39 | 13.1%) account for the highest median family income in Grass Valley with $167,969 per family, while 3-person families (39 | 13.1%) have the highest median income of $55,990 per family member.
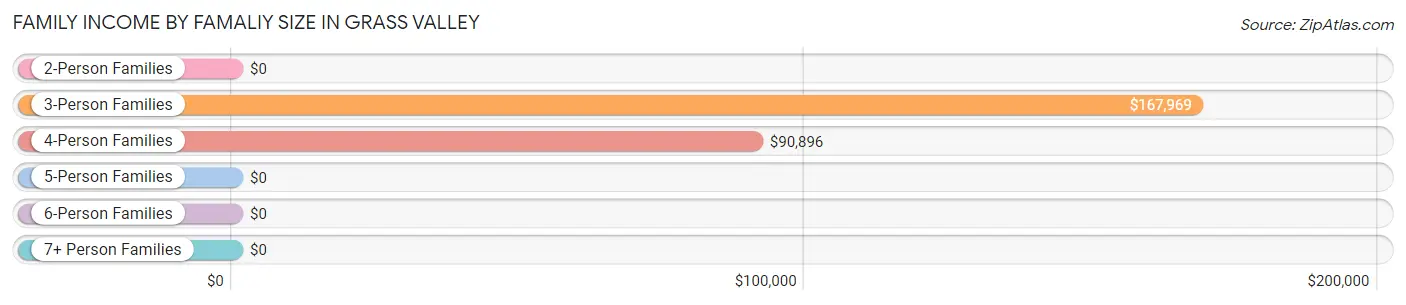
| Income Bracket | # Families | Median Income |
| 2-Person Families | 136 (45.6%) | $0 |
| 3-Person Families | 39 (13.1%) | $167,969 |
| 4-Person Families | 92 (30.9%) | $90,896 |
| 5-Person Families | 17 (5.7%) | $0 |
| 6-Person Families | 14 (4.7%) | $0 |
| 7+ Person Families | 0 (0.0%) | $0 |
| Total | 298 (100.0%) | $91,368 |
Family Income by Number of Earners in Grass Valley
The median family income in Grass Valley is $91,368, with families comprising 3+ earners (50) having the highest median family income of $168,854, while families with no earners (60) have the lowest median family income of $44,167, accounting for 16.8% and 20.1% of families, respectively.
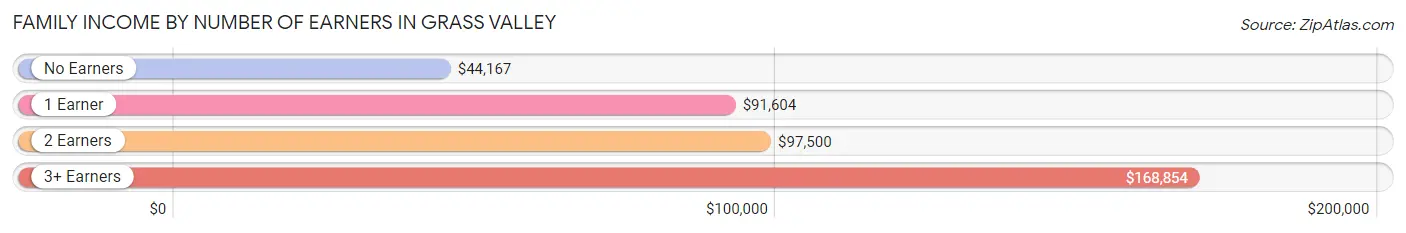
| Number of Earners | # Families | Median Income |
| No Earners | 60 (20.1%) | $44,167 |
| 1 Earner | 112 (37.6%) | $91,604 |
| 2 Earners | 76 (25.5%) | $97,500 |
| 3+ Earners | 50 (16.8%) | $168,854 |
| Total | 298 (100.0%) | $91,368 |
Household Income in Grass Valley
Household Income Brackets in Grass Valley
With 86 households falling in the category, the $35,000 to $49,999 income range is the most frequent in Grass Valley, accounting for 24.0% of all households.
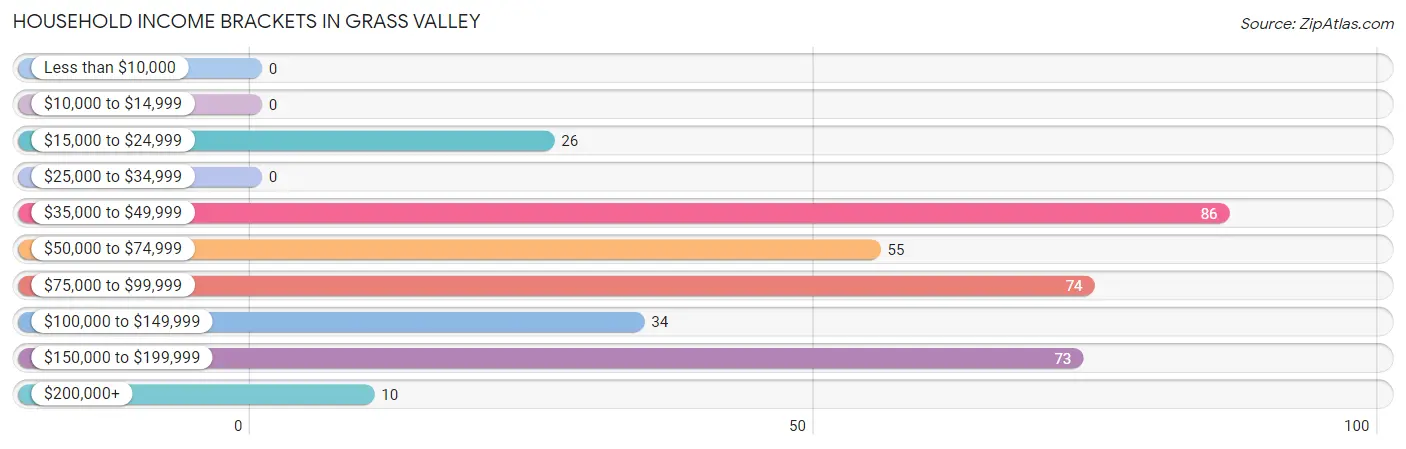
| Income Bracket | # Households | % Households |
| Less than $10,000 | 0 | 0.0% |
| $10,000 to $14,999 | 0 | 0.0% |
| $15,000 to $24,999 | 26 | 7.3% |
| $25,000 to $34,999 | 0 | 0.0% |
| $35,000 to $49,999 | 86 | 24.0% |
| $50,000 to $74,999 | 55 | 15.4% |
| $75,000 to $99,999 | 74 | 20.7% |
| $100,000 to $149,999 | 34 | 9.5% |
| $150,000 to $199,999 | 73 | 20.4% |
| $200,000+ | 10 | 2.8% |
Household Income by Householder Age in Grass Valley
The median household income in Grass Valley is $77,308, with the highest median household income of $122,250 found in the 45 to 64 years age bracket for the primary householder. A total of 127 households (35.5%) fall into this category.
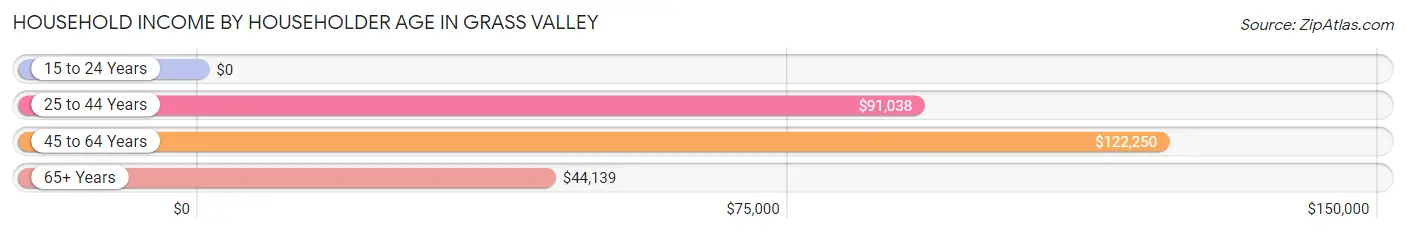
| Income Bracket | # Households | Median Income |
| 15 to 24 Years | 0 (0.0%) | $0 |
| 25 to 44 Years | 136 (38.0%) | $91,038 |
| 45 to 64 Years | 127 (35.5%) | $122,250 |
| 65+ Years | 95 (26.5%) | $44,139 |
| Total | 358 (100.0%) | $77,308 |
Poverty in Grass Valley
Income Below Poverty by Sex and Age in Grass Valley
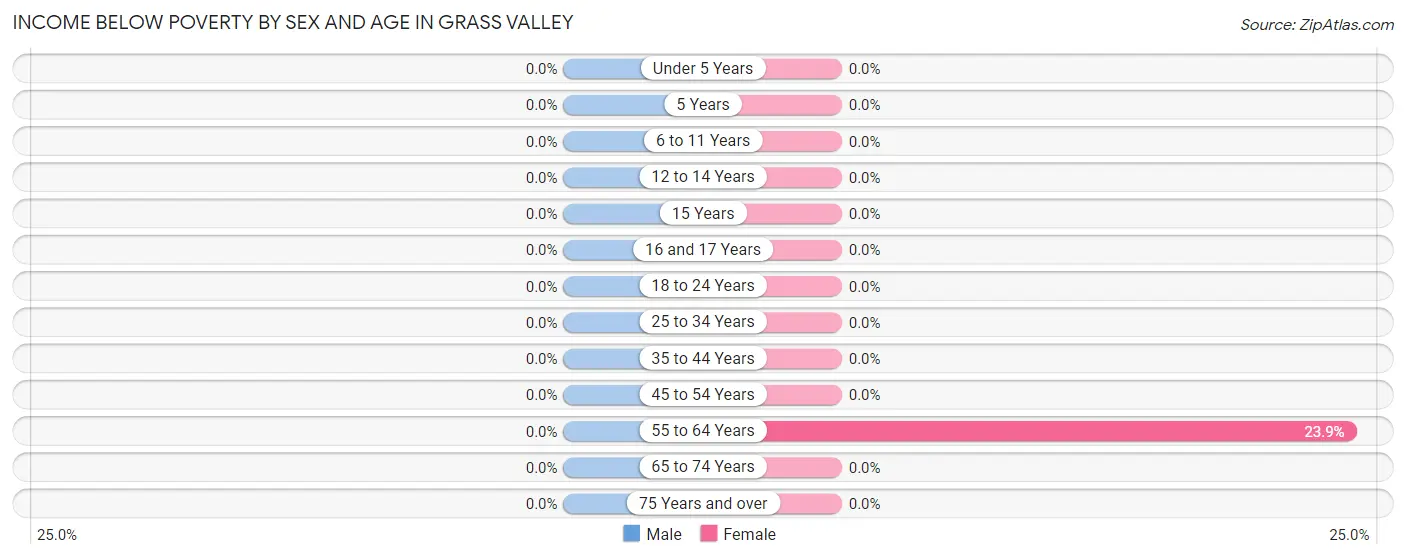
| Age Bracket | Male | Female |
| Under 5 Years | 0 (0.0%) | 0 (0.0%) |
| 5 Years | 0 (0.0%) | 0 (0.0%) |
| 6 to 11 Years | 0 (0.0%) | 0 (0.0%) |
| 12 to 14 Years | 0 (0.0%) | 0 (0.0%) |
| 15 Years | 0 (0.0%) | 0 (0.0%) |
| 16 and 17 Years | 0 (0.0%) | 0 (0.0%) |
| 18 to 24 Years | 0 (0.0%) | 0 (0.0%) |
| 25 to 34 Years | 0 (0.0%) | 0 (0.0%) |
| 35 to 44 Years | 0 (0.0%) | 0 (0.0%) |
| 45 to 54 Years | 0 (0.0%) | 0 (0.0%) |
| 55 to 64 Years | 0 (0.0%) | 16 (23.9%) |
| 65 to 74 Years | 0 (0.0%) | 0 (0.0%) |
| 75 Years and over | 0 (0.0%) | 0 (0.0%) |
| Total | 0 (0.0%) | 16 (3.1%) |
Income Above Poverty by Sex and Age in Grass Valley
According to the poverty statistics in Grass Valley, males aged under 5 years and females aged under 5 years are the age groups that are most secure financially, with 100.0% of males and 100.0% of females in these age groups living above the poverty line.
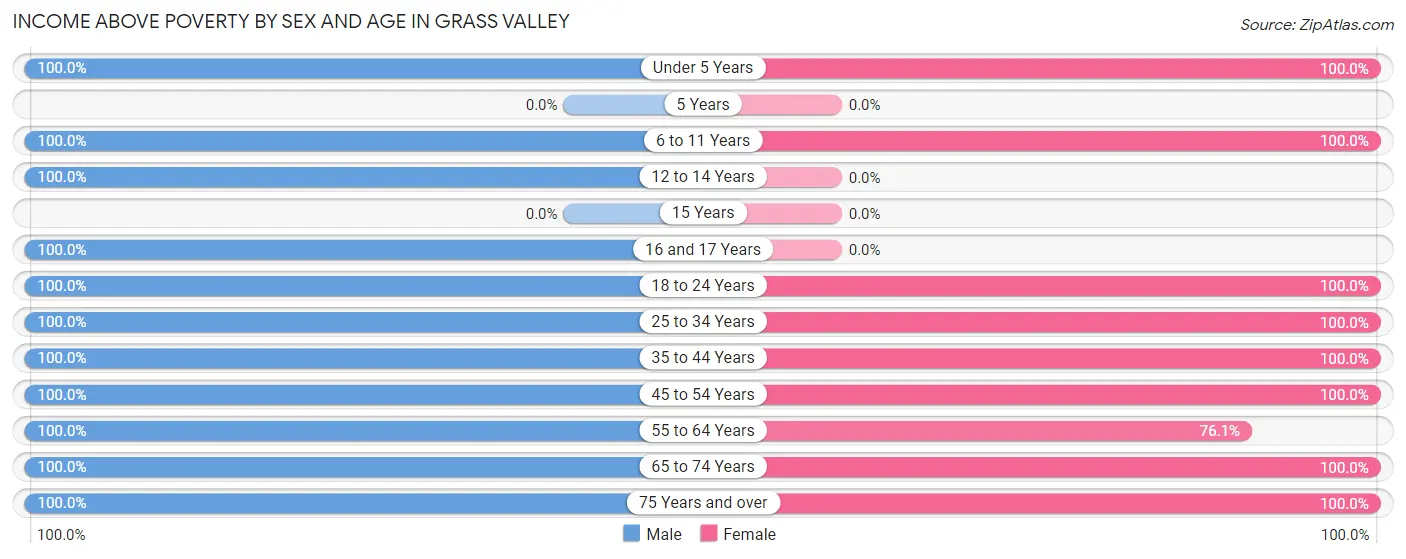
| Age Bracket | Male | Female |
| Under 5 Years | 62 (100.0%) | 24 (100.0%) |
| 5 Years | 0 (0.0%) | 0 (0.0%) |
| 6 to 11 Years | 85 (100.0%) | 93 (100.0%) |
| 12 to 14 Years | 8 (100.0%) | 0 (0.0%) |
| 15 Years | 0 (0.0%) | 0 (0.0%) |
| 16 and 17 Years | 45 (100.0%) | 0 (0.0%) |
| 18 to 24 Years | 68 (100.0%) | 37 (100.0%) |
| 25 to 34 Years | 160 (100.0%) | 97 (100.0%) |
| 35 to 44 Years | 22 (100.0%) | 68 (100.0%) |
| 45 to 54 Years | 65 (100.0%) | 66 (100.0%) |
| 55 to 64 Years | 61 (100.0%) | 51 (76.1%) |
| 65 to 74 Years | 39 (100.0%) | 17 (100.0%) |
| 75 Years and over | 54 (100.0%) | 52 (100.0%) |
| Total | 669 (100.0%) | 505 (96.9%) |
Income Below Poverty Among Married-Couple Families in Grass Valley
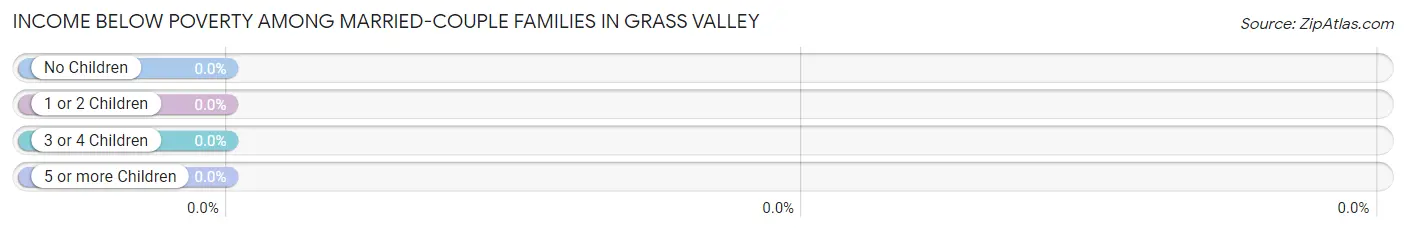
| Children | Above Poverty | Below Poverty |
| No Children | 172 (100.0%) | 0 (0.0%) |
| 1 or 2 Children | 107 (100.0%) | 0 (0.0%) |
| 3 or 4 Children | 17 (100.0%) | 0 (0.0%) |
| 5 or more Children | 0 (0.0%) | 0 (0.0%) |
| Total | 296 (100.0%) | 0 (0.0%) |
Income Below Poverty Among Single-Parent Households in Grass Valley
| Children | Single Father | Single Mother |
| No Children | 0 (0.0%) | 0 (0.0%) |
| 1 or 2 Children | 0 (0.0%) | 0 (0.0%) |
| 3 or 4 Children | 0 (0.0%) | 0 (0.0%) |
| 5 or more Children | 0 (0.0%) | 0 (0.0%) |
| Total | 0 (0.0%) | 0 (0.0%) |
Income Below Poverty Among Married-Couple vs Single-Parent Households in Grass Valley
| Children | Married-Couple Families | Single-Parent Households |
| No Children | 0 (0.0%) | 0 (0.0%) |
| 1 or 2 Children | 0 (0.0%) | 0 (0.0%) |
| 3 or 4 Children | 0 (0.0%) | 0 (0.0%) |
| 5 or more Children | 0 (0.0%) | 0 (0.0%) |
| Total | 0 (0.0%) | 0 (0.0%) |
Employment Characteristics in Grass Valley
Employment by Class of Employer in Grass Valley
Among the 534 employed individuals in Grass Valley, private company employees (427 | 80.0%), self-employed (not incorporated) (42 | 7.9%), and not-for-profit organizations (28 | 5.2%) make up the most common classes of employment.
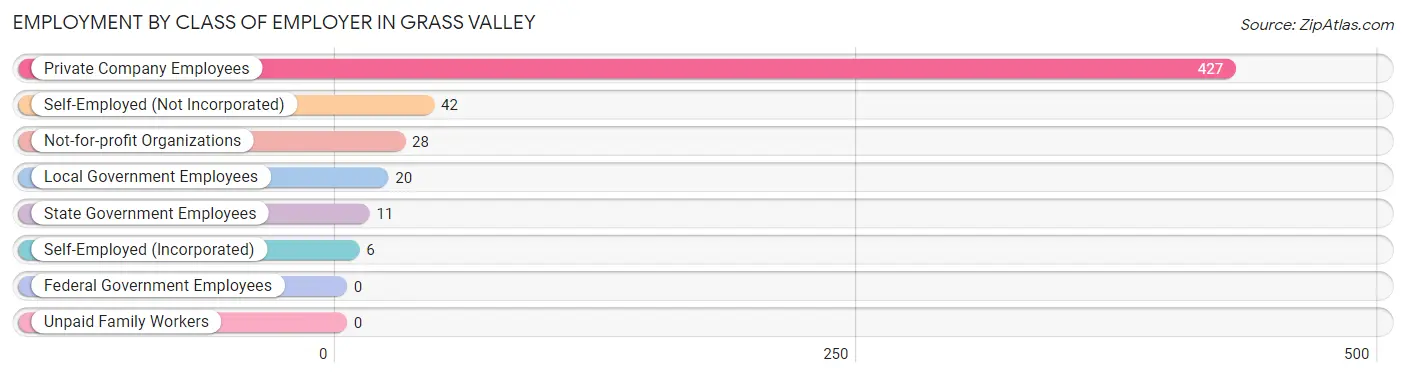
| Employer Class | # Employees | % Employees |
| Private Company Employees | 427 | 80.0% |
| Self-Employed (Incorporated) | 6 | 1.1% |
| Self-Employed (Not Incorporated) | 42 | 7.9% |
| Not-for-profit Organizations | 28 | 5.2% |
| Local Government Employees | 20 | 3.7% |
| State Government Employees | 11 | 2.1% |
| Federal Government Employees | 0 | 0.0% |
| Unpaid Family Workers | 0 | 0.0% |
| Total | 534 | 100.0% |
Employment Status by Age in Grass Valley
According to the labor force statistics for Grass Valley, out of the total population over 16 years of age (918), 66.2% or 608 individuals are in the labor force, with 12.2% or 74 of them unemployed. The age group with the highest labor force participation rate is 25 to 29 years, with 100.0% or 178 individuals in the labor force. Within the labor force, the 25 to 29 years age range has the highest percentage of unemployed individuals, with 35.4% or 63 of them being unemployed.
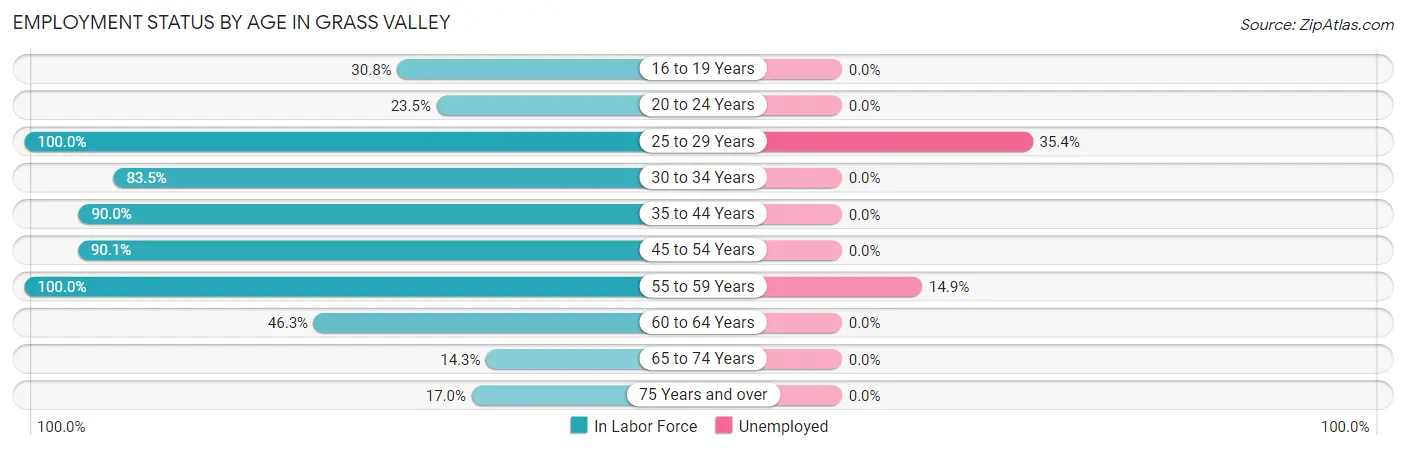
| Age Bracket | In Labor Force | Unemployed |
| 16 to 19 Years | 20 (30.8%) | 0 (0.0%) |
| 20 to 24 Years | 20 (23.5%) | 0 (0.0%) |
| 25 to 29 Years | 178 (100.0%) | 63 (35.4%) |
| 30 to 34 Years | 66 (83.5%) | 0 (0.0%) |
| 35 to 44 Years | 81 (90.0%) | 0 (0.0%) |
| 45 to 54 Years | 118 (90.1%) | 0 (0.0%) |
| 55 to 59 Years | 74 (100.0%) | 11 (14.9%) |
| 60 to 64 Years | 25 (46.3%) | 0 (0.0%) |
| 65 to 74 Years | 8 (14.3%) | 0 (0.0%) |
| 75 Years and over | 18 (17.0%) | 0 (0.0%) |
| Total | 608 (66.2%) | 74 (12.2%) |
Employment Status by Educational Attainment in Grass Valley
According to labor force statistics for Grass Valley, 89.4% of individuals (542) out of the total population between 25 and 64 years of age (606) are in the labor force, with 13.7% or 74 of them being unemployed. The group with the highest labor force participation rate are those with the educational attainment of less than high school, with 100.0% or 43 individuals in the labor force. Within the labor force, individuals with college / associate degree education have the highest percentage of unemployment, with 18.8% or 22 of them being unemployed.
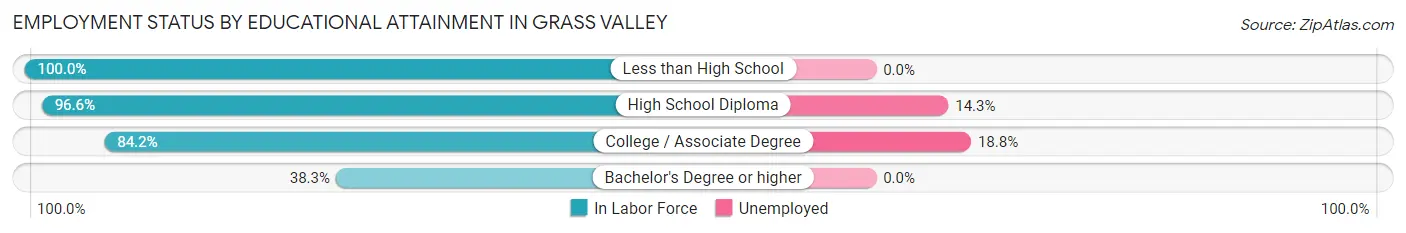
| Educational Attainment | In Labor Force | Unemployed |
| Less than High School | 43 (100.0%) | 0 (0.0%) |
| High School Diploma | 364 (96.6%) | 54 (14.3%) |
| College / Associate Degree | 117 (84.2%) | 26 (18.8%) |
| Bachelor's Degree or higher | 18 (38.3%) | 0 (0.0%) |
| Total | 542 (89.4%) | 83 (13.7%) |
Employment Occupations by Sex in Grass Valley
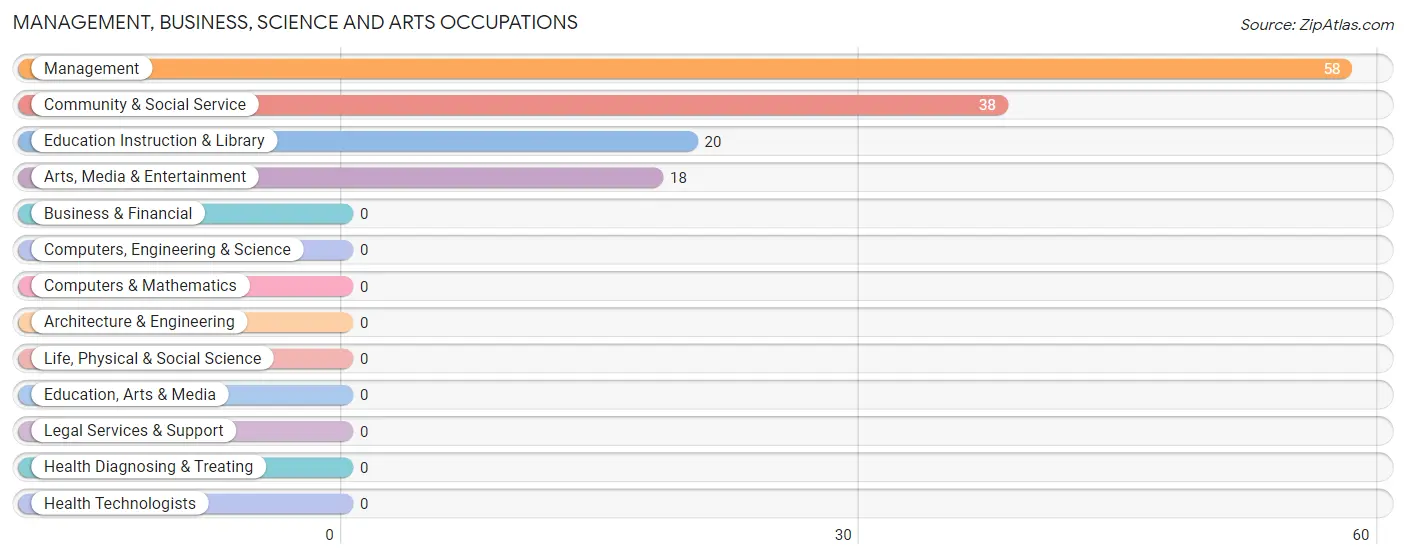
Management, Business, Science and Arts Occupations
The most common Management, Business, Science and Arts occupations in Grass Valley are Management (58 | 10.9%), Community & Social Service (38 | 7.1%), Education Instruction & Library (20 | 3.7%), and Arts, Media & Entertainment (18 | 3.4%).
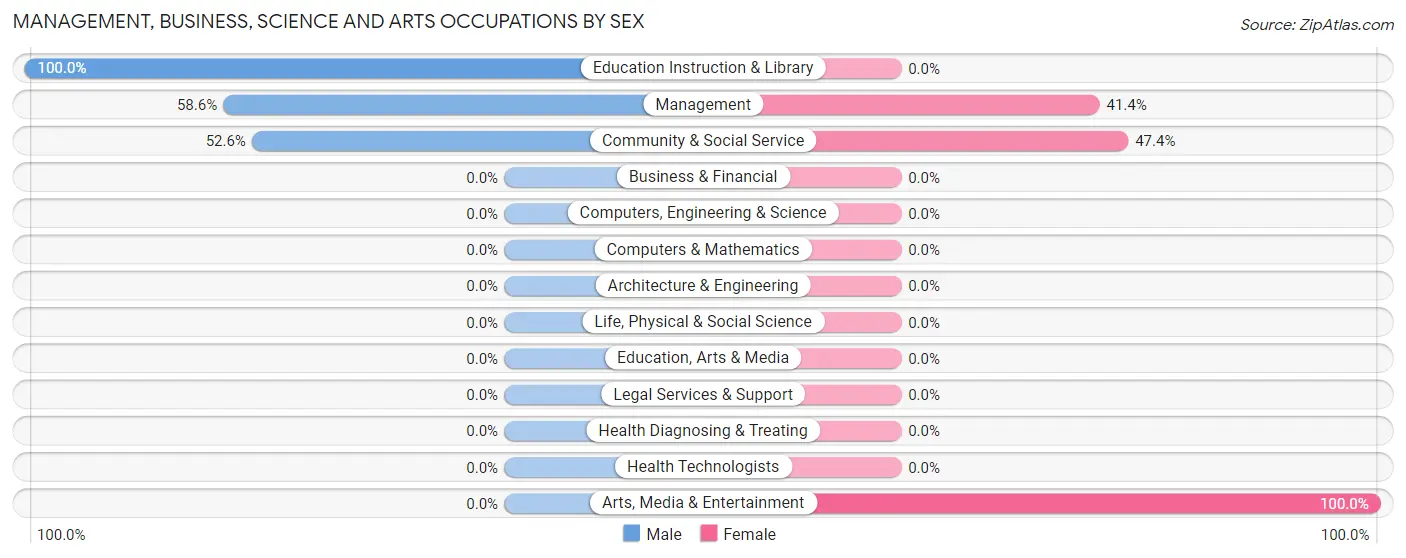
Management, Business, Science and Arts Occupations by Sex
Within the Management, Business, Science and Arts occupations in Grass Valley, the most male-oriented occupations are Education Instruction & Library (100.0%), Management (58.6%), and Community & Social Service (52.6%), while the most female-oriented occupations are Arts, Media & Entertainment (100.0%), Community & Social Service (47.4%), and Management (41.4%).
| Occupation | Male | Female |
| Management | 34 (58.6%) | 24 (41.4%) |
| Business & Financial | 0 (0.0%) | 0 (0.0%) |
| Computers, Engineering & Science | 0 (0.0%) | 0 (0.0%) |
| Computers & Mathematics | 0 (0.0%) | 0 (0.0%) |
| Architecture & Engineering | 0 (0.0%) | 0 (0.0%) |
| Life, Physical & Social Science | 0 (0.0%) | 0 (0.0%) |
| Community & Social Service | 20 (52.6%) | 18 (47.4%) |
| Education, Arts & Media | 0 (0.0%) | 0 (0.0%) |
| Legal Services & Support | 0 (0.0%) | 0 (0.0%) |
| Education Instruction & Library | 20 (100.0%) | 0 (0.0%) |
| Arts, Media & Entertainment | 0 (0.0%) | 18 (100.0%) |
| Health Diagnosing & Treating | 0 (0.0%) | 0 (0.0%) |
| Health Technologists | 0 (0.0%) | 0 (0.0%) |
| Total (Category) | 54 (56.2%) | 42 (43.8%) |
| Total (Overall) | 334 (62.5%) | 200 (37.4%) |
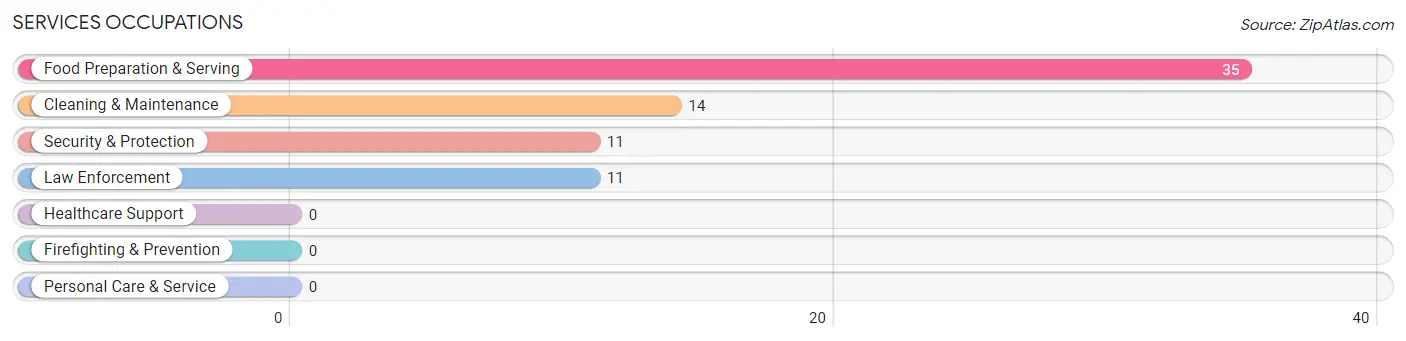
Services Occupations
The most common Services occupations in Grass Valley are Food Preparation & Serving (35 | 6.6%), Cleaning & Maintenance (14 | 2.6%), Security & Protection (11 | 2.1%), and Law Enforcement (11 | 2.1%).
Services Occupations by Sex
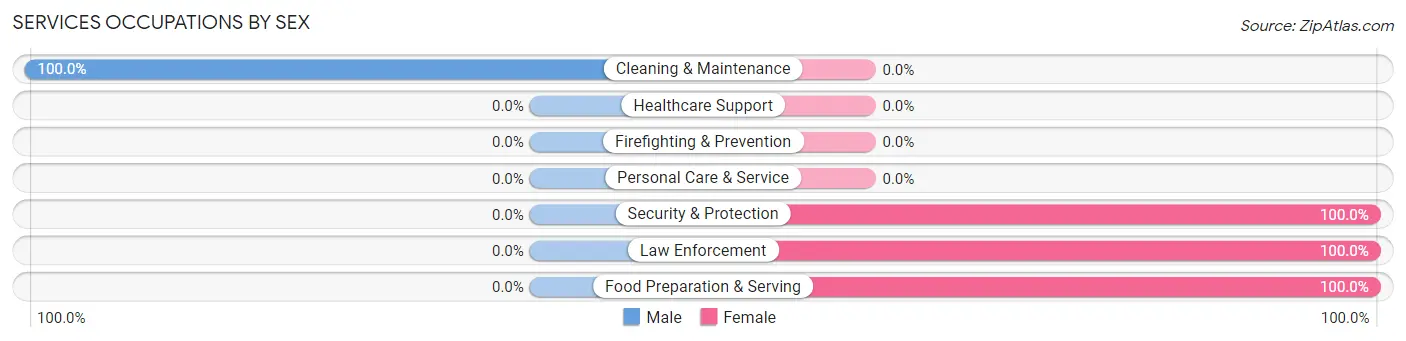
| Occupation | Male | Female |
| Healthcare Support | 0 (0.0%) | 0 (0.0%) |
| Security & Protection | 0 (0.0%) | 11 (100.0%) |
| Firefighting & Prevention | 0 (0.0%) | 0 (0.0%) |
| Law Enforcement | 0 (0.0%) | 11 (100.0%) |
| Food Preparation & Serving | 0 (0.0%) | 35 (100.0%) |
| Cleaning & Maintenance | 14 (100.0%) | 0 (0.0%) |
| Personal Care & Service | 0 (0.0%) | 0 (0.0%) |
| Total (Category) | 14 (23.3%) | 46 (76.7%) |
| Total (Overall) | 334 (62.5%) | 200 (37.4%) |
Sales and Office Occupations
The most common Sales and Office occupations in Grass Valley are Sales & Related (80 | 15.0%), and Office & Administration (33 | 6.2%).
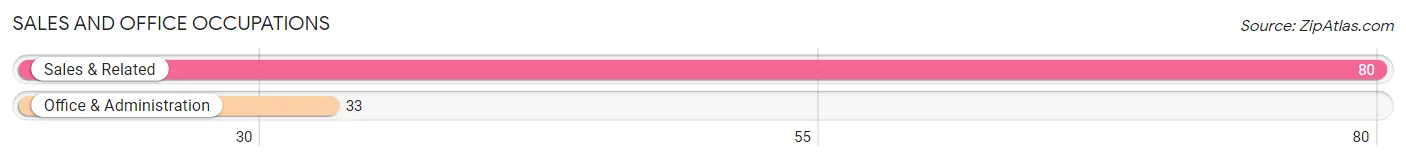
Sales and Office Occupations by Sex
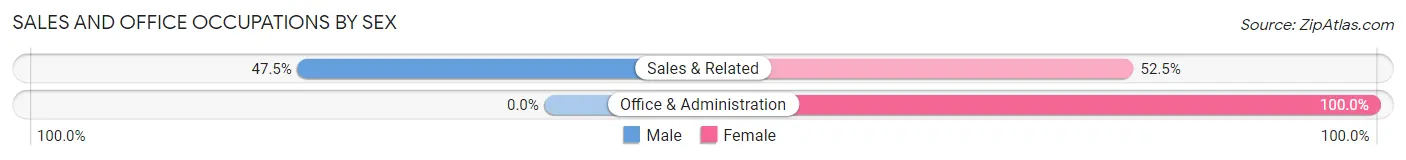
| Occupation | Male | Female |
| Sales & Related | 38 (47.5%) | 42 (52.5%) |
| Office & Administration | 0 (0.0%) | 33 (100.0%) |
| Total (Category) | 38 (33.6%) | 75 (66.4%) |
| Total (Overall) | 334 (62.5%) | 200 (37.4%) |
Natural Resources, Construction and Maintenance Occupations
The most common Natural Resources, Construction and Maintenance occupations in Grass Valley are Construction & Extraction (95 | 17.8%), Installation, Maintenance & Repair (44 | 8.2%), and Farming, Fishing & Forestry (12 | 2.2%).
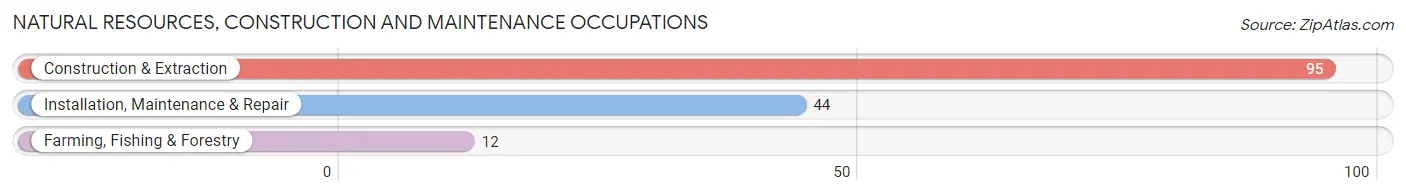
Natural Resources, Construction and Maintenance Occupations by Sex
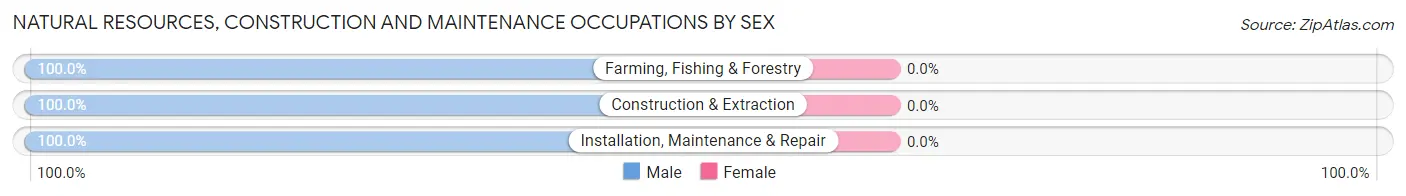
| Occupation | Male | Female |
| Farming, Fishing & Forestry | 12 (100.0%) | 0 (0.0%) |
| Construction & Extraction | 95 (100.0%) | 0 (0.0%) |
| Installation, Maintenance & Repair | 44 (100.0%) | 0 (0.0%) |
| Total (Category) | 151 (100.0%) | 0 (0.0%) |
| Total (Overall) | 334 (62.5%) | 200 (37.4%) |
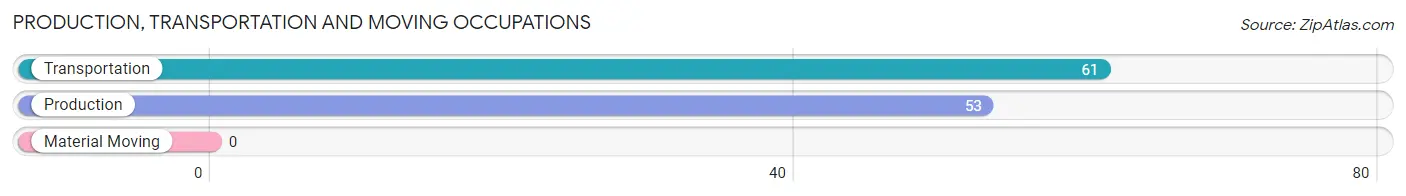
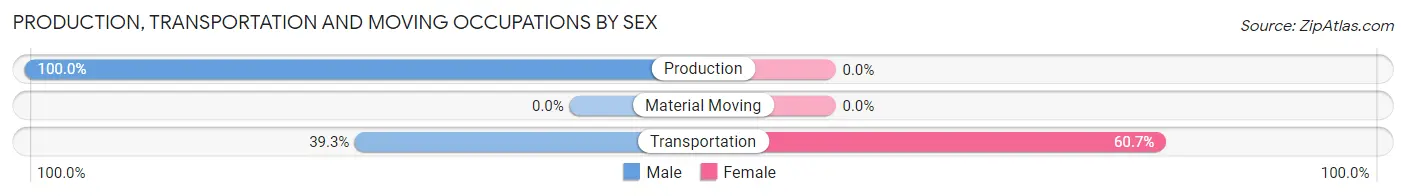
Production, Transportation and Moving Occupations
The most common Production, Transportation and Moving occupations in Grass Valley are Transportation (61 | 11.4%), and Production (53 | 9.9%).
Production, Transportation and Moving Occupations by Sex
| Occupation | Male | Female |
| Production | 53 (100.0%) | 0 (0.0%) |
| Transportation | 24 (39.3%) | 37 (60.7%) |
| Material Moving | 0 (0.0%) | 0 (0.0%) |
| Total (Category) | 77 (67.5%) | 37 (32.5%) |
| Total (Overall) | 334 (62.5%) | 200 (37.4%) |
Employment Industries by Sex in Grass Valley
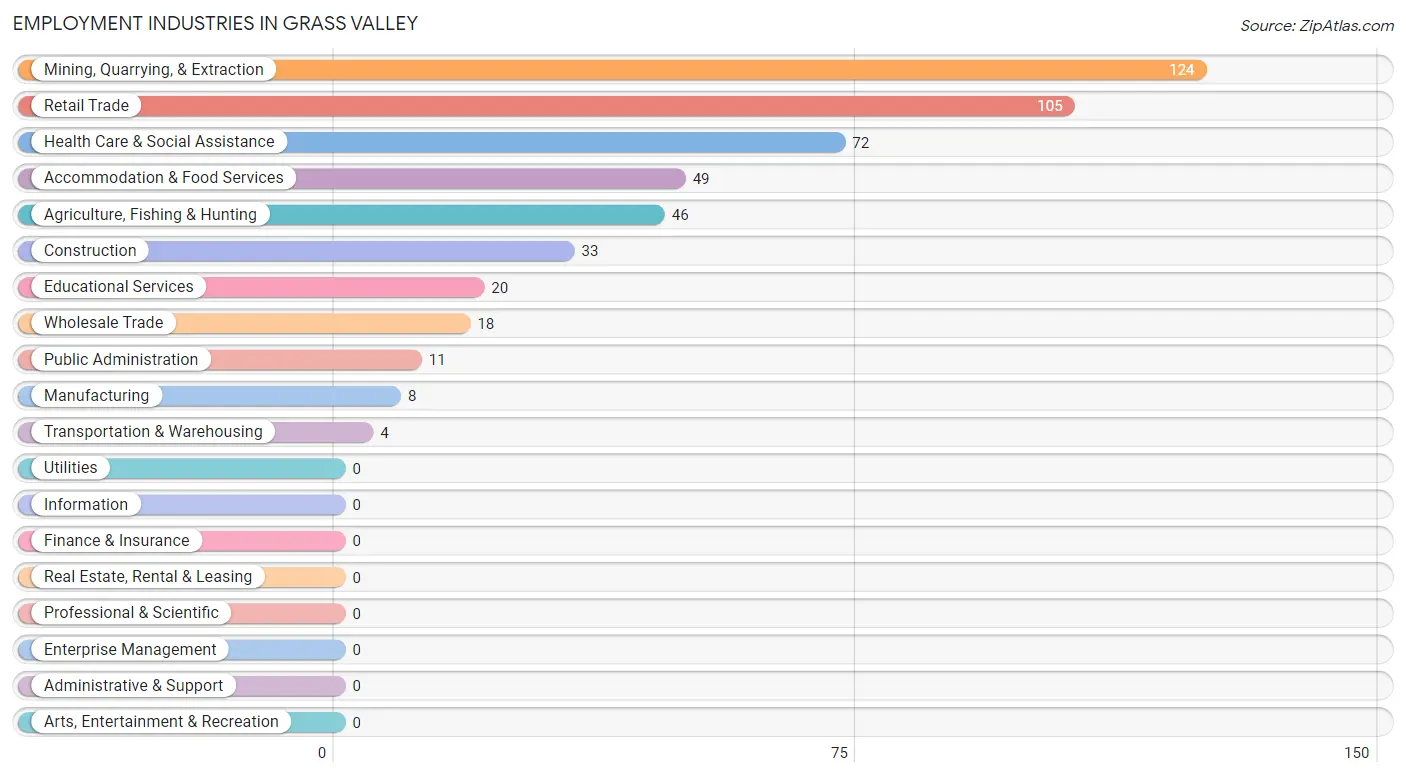
Employment Industries in Grass Valley
The major employment industries in Grass Valley include Mining, Quarrying, & Extraction (124 | 23.2%), Retail Trade (105 | 19.7%), Health Care & Social Assistance (72 | 13.5%), Accommodation & Food Services (49 | 9.2%), and Agriculture, Fishing & Hunting (46 | 8.6%).
Employment Industries by Sex in Grass Valley
The Grass Valley industries that see more men than women are Agriculture, Fishing & Hunting (100.0%), Mining, Quarrying, & Extraction (100.0%), and Manufacturing (100.0%), whereas the industries that tend to have a higher number of women are Wholesale Trade (100.0%), Health Care & Social Assistance (100.0%), and Public Administration (100.0%).
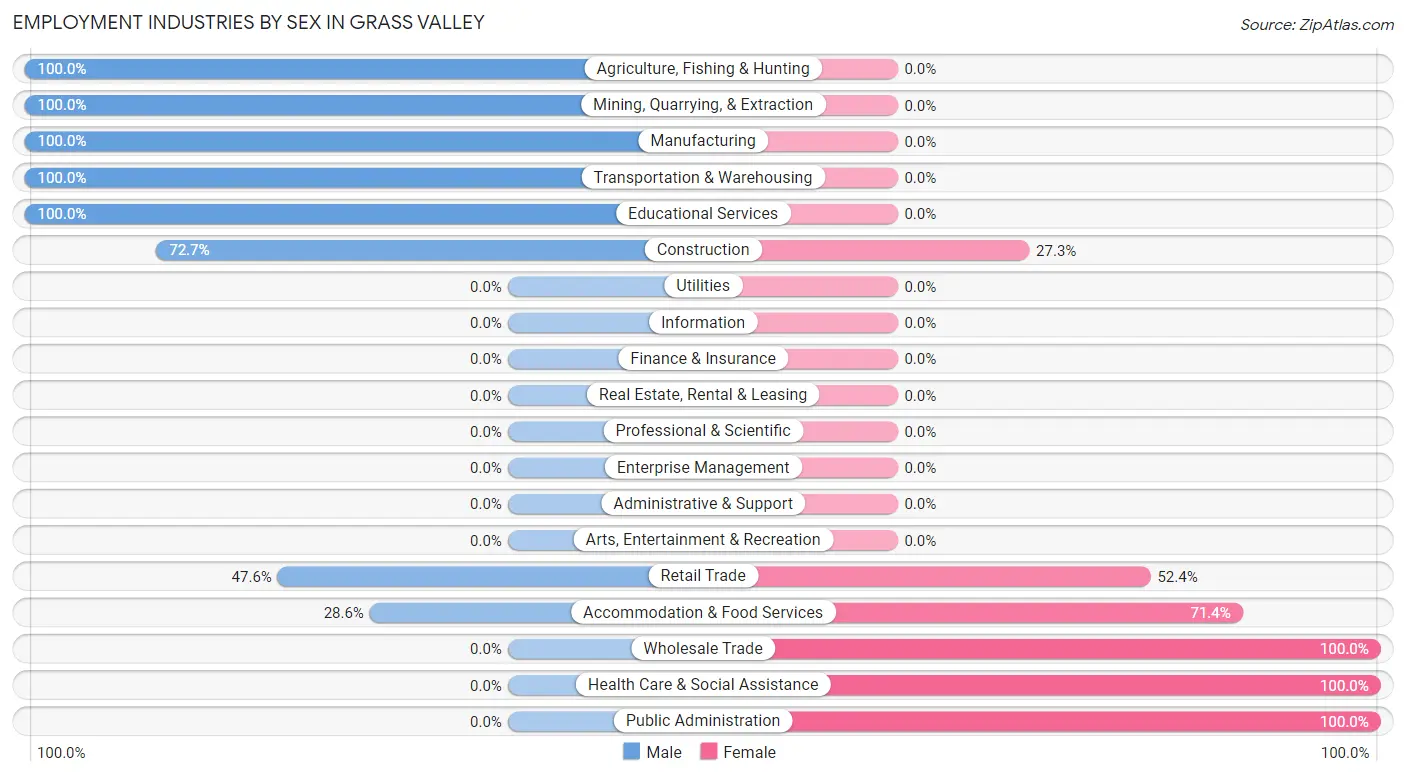
| Industry | Male | Female |
| Agriculture, Fishing & Hunting | 46 (100.0%) | 0 (0.0%) |
| Mining, Quarrying, & Extraction | 124 (100.0%) | 0 (0.0%) |
| Construction | 24 (72.7%) | 9 (27.3%) |
| Manufacturing | 8 (100.0%) | 0 (0.0%) |
| Wholesale Trade | 0 (0.0%) | 18 (100.0%) |
| Retail Trade | 50 (47.6%) | 55 (52.4%) |
| Transportation & Warehousing | 4 (100.0%) | 0 (0.0%) |
| Utilities | 0 (0.0%) | 0 (0.0%) |
| Information | 0 (0.0%) | 0 (0.0%) |
| Finance & Insurance | 0 (0.0%) | 0 (0.0%) |
| Real Estate, Rental & Leasing | 0 (0.0%) | 0 (0.0%) |
| Professional & Scientific | 0 (0.0%) | 0 (0.0%) |
| Enterprise Management | 0 (0.0%) | 0 (0.0%) |
| Administrative & Support | 0 (0.0%) | 0 (0.0%) |
| Educational Services | 20 (100.0%) | 0 (0.0%) |
| Health Care & Social Assistance | 0 (0.0%) | 72 (100.0%) |
| Arts, Entertainment & Recreation | 0 (0.0%) | 0 (0.0%) |
| Accommodation & Food Services | 14 (28.6%) | 35 (71.4%) |
| Public Administration | 0 (0.0%) | 11 (100.0%) |
| Total | 334 (62.5%) | 200 (37.4%) |
Education in Grass Valley
School Enrollment in Grass Valley
The most common levels of schooling among the 268 students in Grass Valley are elementary school (178 | 66.4%), high school (53 | 19.8%), and nursery / preschool (24 | 9.0%).
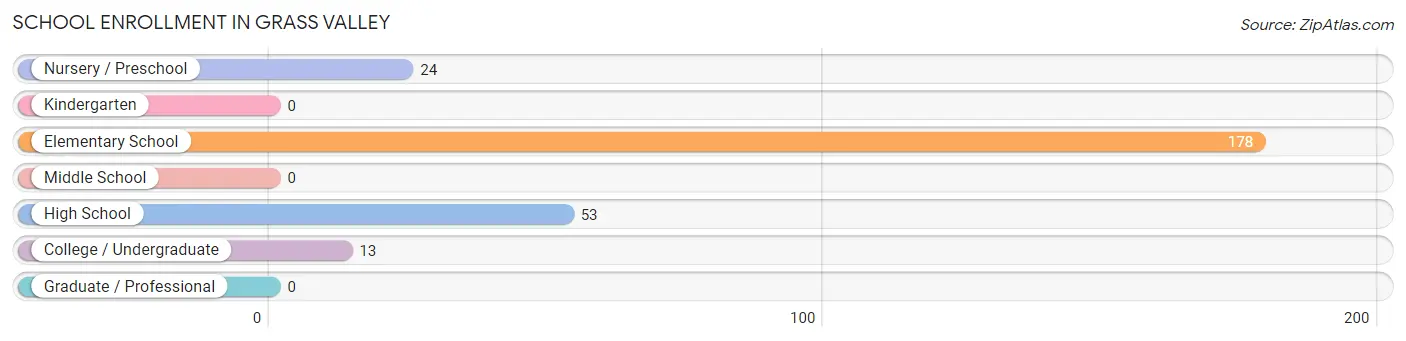
| School Level | # Students | % Students |
| Nursery / Preschool | 24 | 9.0% |
| Kindergarten | 0 | 0.0% |
| Elementary School | 178 | 66.4% |
| Middle School | 0 | 0.0% |
| High School | 53 | 19.8% |
| College / Undergraduate | 13 | 4.9% |
| Graduate / Professional | 0 | 0.0% |
| Total | 268 | 100.0% |
School Enrollment by Age by Funding Source in Grass Valley
Out of a total of 268 students who are enrolled in schools in Grass Valley, 24 (9.0%) attend a private institution, while the remaining 244 (91.0%) are enrolled in public schools. The age group of 3 to 4 year olds has the highest likelihood of being enrolled in private schools, with 24 (100.0% in the age bracket) enrolled. Conversely, the age group of 5 to 9 year old has the lowest likelihood of being enrolled in a private school, with 157 (100.0% in the age bracket) attending a public institution.
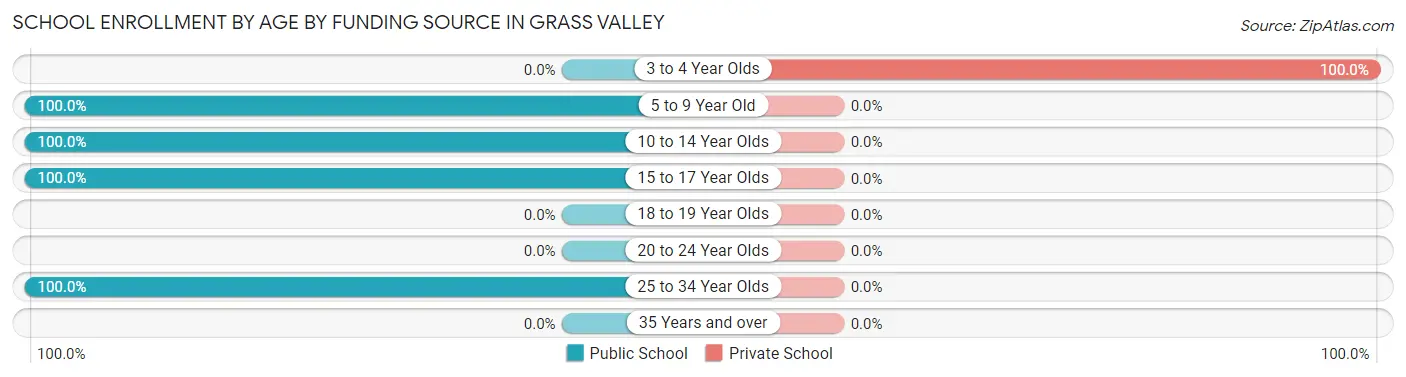
| Age Bracket | Public School | Private School |
| 3 to 4 Year Olds | 0 (0.0%) | 24 (100.0%) |
| 5 to 9 Year Old | 157 (100.0%) | 0 (0.0%) |
| 10 to 14 Year Olds | 29 (100.0%) | 0 (0.0%) |
| 15 to 17 Year Olds | 45 (100.0%) | 0 (0.0%) |
| 18 to 19 Year Olds | 0 (0.0%) | 0 (0.0%) |
| 20 to 24 Year Olds | 0 (0.0%) | 0 (0.0%) |
| 25 to 34 Year Olds | 13 (100.0%) | 0 (0.0%) |
| 35 Years and over | 0 (0.0%) | 0 (0.0%) |
| Total | 244 (91.0%) | 24 (9.0%) |
Educational Attainment by Field of Study in Grass Valley
Engineering (29 | 38.2%), social sciences (18 | 23.7%), liberal arts & history (18 | 23.7%), and arts & humanities (11 | 14.5%) are the most common fields of study among 76 individuals in Grass Valley who have obtained a bachelor's degree or higher.
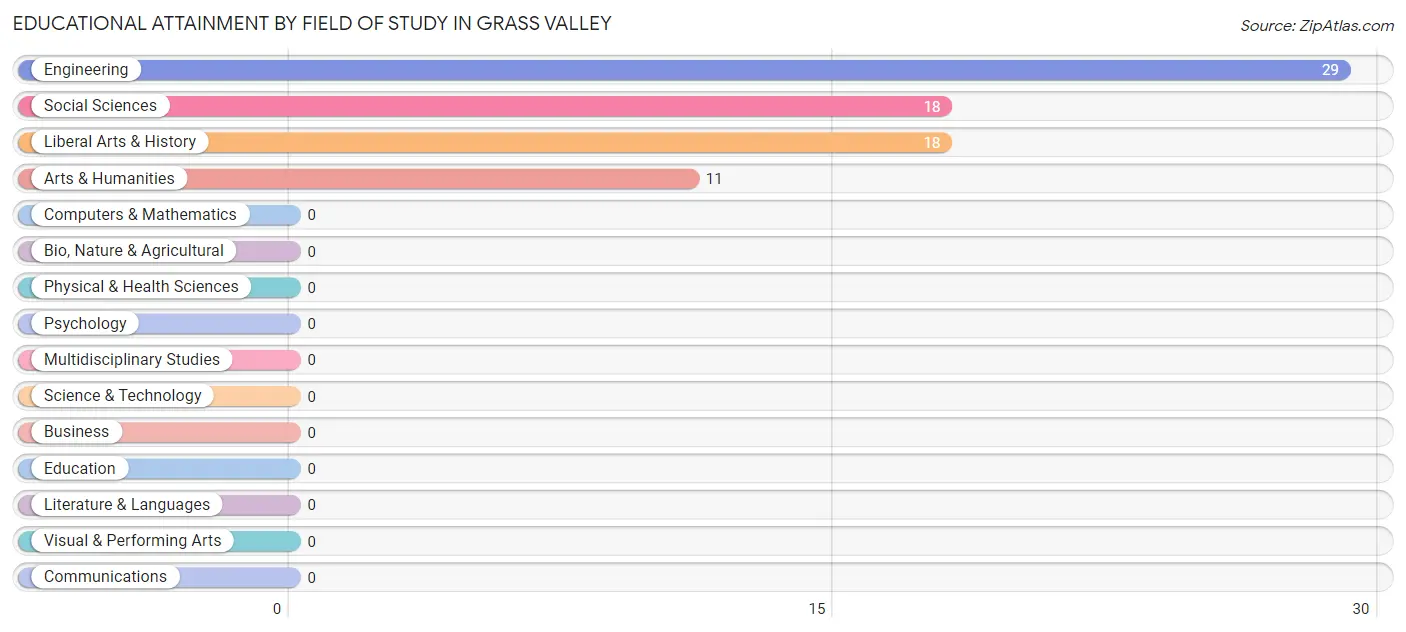
| Field of Study | # Graduates | % Graduates |
| Computers & Mathematics | 0 | 0.0% |
| Bio, Nature & Agricultural | 0 | 0.0% |
| Physical & Health Sciences | 0 | 0.0% |
| Psychology | 0 | 0.0% |
| Social Sciences | 18 | 23.7% |
| Engineering | 29 | 38.2% |
| Multidisciplinary Studies | 0 | 0.0% |
| Science & Technology | 0 | 0.0% |
| Business | 0 | 0.0% |
| Education | 0 | 0.0% |
| Literature & Languages | 0 | 0.0% |
| Liberal Arts & History | 18 | 23.7% |
| Visual & Performing Arts | 0 | 0.0% |
| Communications | 0 | 0.0% |
| Arts & Humanities | 11 | 14.5% |
| Total | 76 | 100.0% |
Transportation & Commute in Grass Valley
Vehicle Availability by Sex in Grass Valley
The most prevalent vehicle ownership categories in Grass Valley are males with 5 or more vehicles (123, accounting for 36.8%) and females with 5 or more vehicles (39, making up 61.5%).
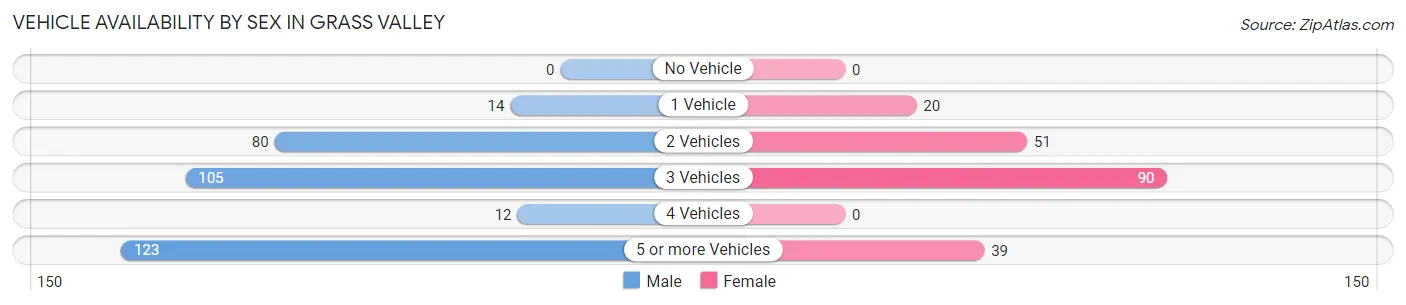
| Vehicles Available | Male | Female |
| No Vehicle | 0 (0.0%) | 0 (0.0%) |
| 1 Vehicle | 14 (4.2%) | 20 (10.0%) |
| 2 Vehicles | 80 (23.9%) | 51 (25.5%) |
| 3 Vehicles | 105 (31.4%) | 90 (45.0%) |
| 4 Vehicles | 12 (3.6%) | 0 (0.0%) |
| 5 or more Vehicles | 123 (36.8%) | 39 (19.5%) |
| Total | 334 (100.0%) | 200 (100.0%) |
Commute Time in Grass Valley
The most frequently occuring commute durations in Grass Valley are 15 to 19 minutes (140 commuters, 29.2%), 20 to 24 minutes (118 commuters, 24.6%), and 60 to 89 minutes (94 commuters, 19.6%).
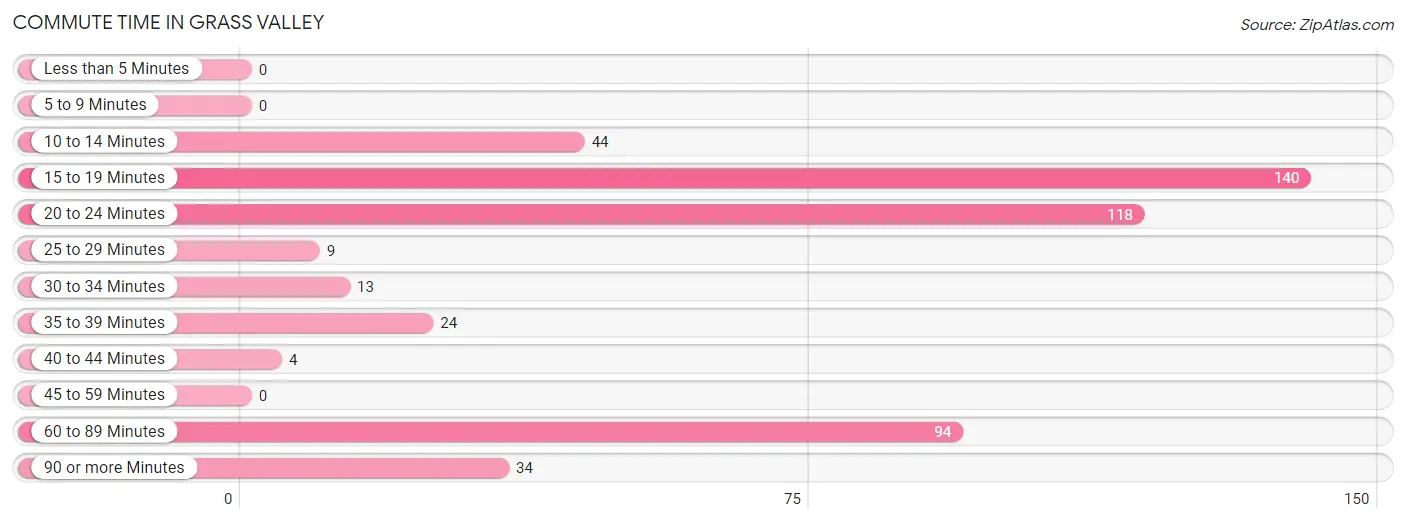
| Commute Time | # Commuters | % Commuters |
| Less than 5 Minutes | 0 | 0.0% |
| 5 to 9 Minutes | 0 | 0.0% |
| 10 to 14 Minutes | 44 | 9.2% |
| 15 to 19 Minutes | 140 | 29.2% |
| 20 to 24 Minutes | 118 | 24.6% |
| 25 to 29 Minutes | 9 | 1.9% |
| 30 to 34 Minutes | 13 | 2.7% |
| 35 to 39 Minutes | 24 | 5.0% |
| 40 to 44 Minutes | 4 | 0.8% |
| 45 to 59 Minutes | 0 | 0.0% |
| 60 to 89 Minutes | 94 | 19.6% |
| 90 or more Minutes | 34 | 7.1% |
Commute Time by Sex in Grass Valley
The most common commute times in Grass Valley are 15 to 19 minutes (135 commuters, 48.2%) for males and 20 to 24 minutes (94 commuters, 47.0%) for females.
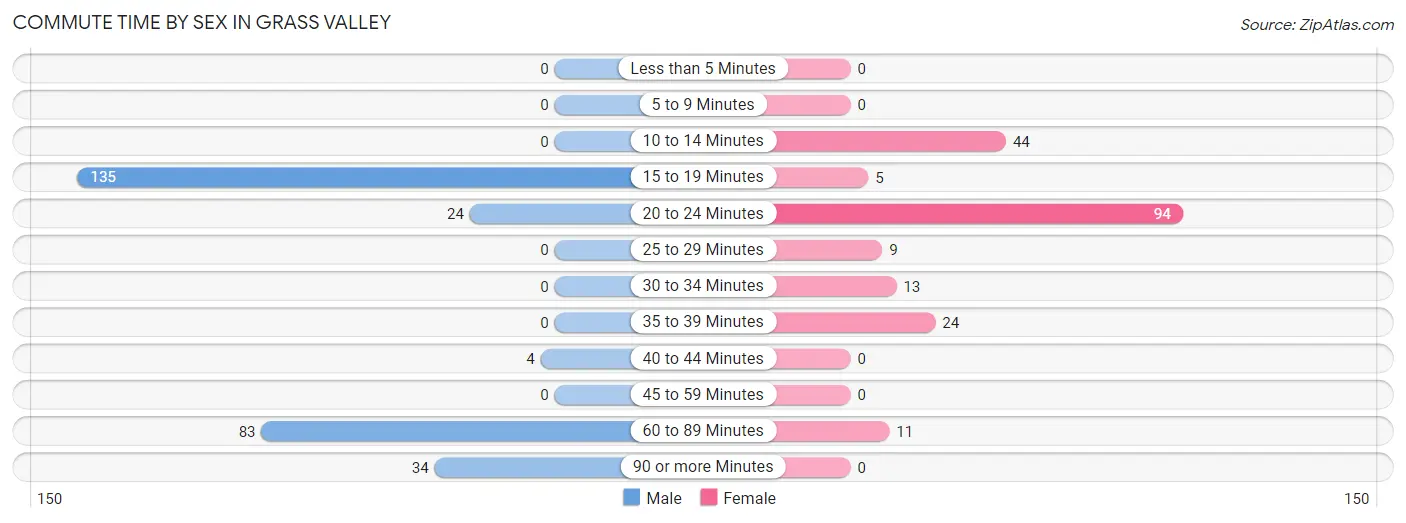
| Commute Time | Male | Female |
| Less than 5 Minutes | 0 (0.0%) | 0 (0.0%) |
| 5 to 9 Minutes | 0 (0.0%) | 0 (0.0%) |
| 10 to 14 Minutes | 0 (0.0%) | 44 (22.0%) |
| 15 to 19 Minutes | 135 (48.2%) | 5 (2.5%) |
| 20 to 24 Minutes | 24 (8.6%) | 94 (47.0%) |
| 25 to 29 Minutes | 0 (0.0%) | 9 (4.5%) |
| 30 to 34 Minutes | 0 (0.0%) | 13 (6.5%) |
| 35 to 39 Minutes | 0 (0.0%) | 24 (12.0%) |
| 40 to 44 Minutes | 4 (1.4%) | 0 (0.0%) |
| 45 to 59 Minutes | 0 (0.0%) | 0 (0.0%) |
| 60 to 89 Minutes | 83 (29.6%) | 11 (5.5%) |
| 90 or more Minutes | 34 (12.1%) | 0 (0.0%) |
Time of Departure to Work by Sex in Grass Valley
The most frequent times of departure to work in Grass Valley are 12:00 AM to 4:59 AM (138, 49.3%) for males and 9:00 AM to 9:59 AM (50, 25.0%) for females.
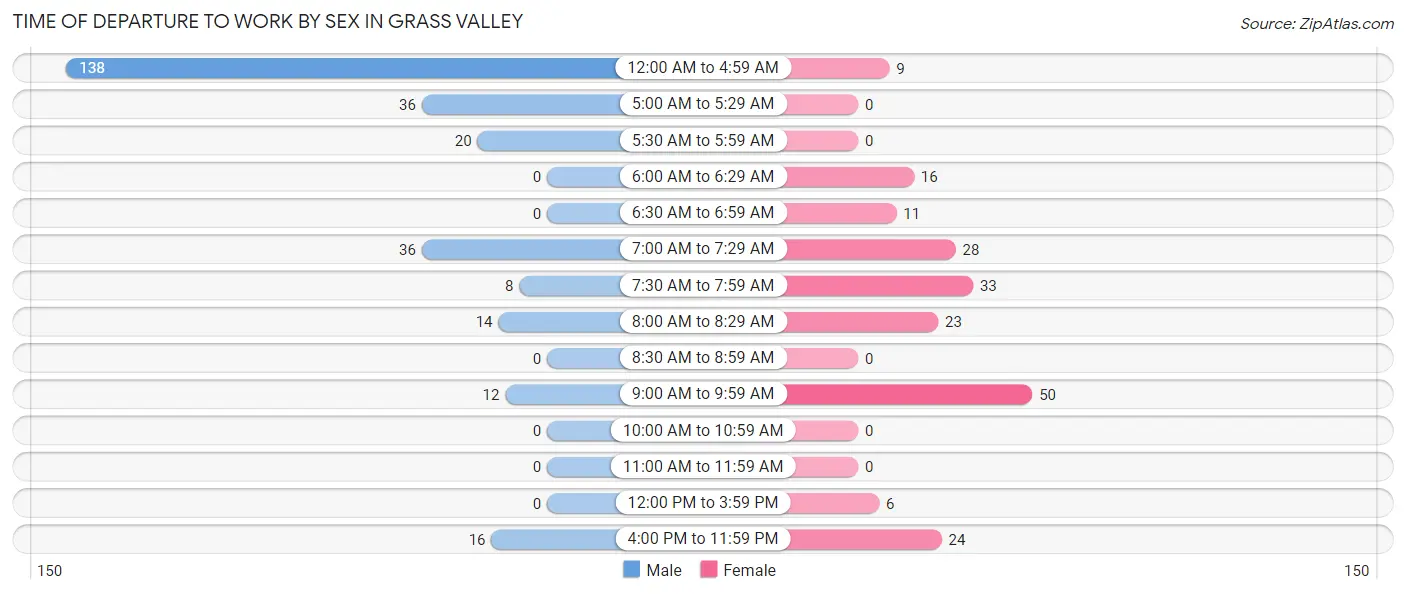
| Time of Departure | Male | Female |
| 12:00 AM to 4:59 AM | 138 (49.3%) | 9 (4.5%) |
| 5:00 AM to 5:29 AM | 36 (12.9%) | 0 (0.0%) |
| 5:30 AM to 5:59 AM | 20 (7.1%) | 0 (0.0%) |
| 6:00 AM to 6:29 AM | 0 (0.0%) | 16 (8.0%) |
| 6:30 AM to 6:59 AM | 0 (0.0%) | 11 (5.5%) |
| 7:00 AM to 7:29 AM | 36 (12.9%) | 28 (14.0%) |
| 7:30 AM to 7:59 AM | 8 (2.9%) | 33 (16.5%) |
| 8:00 AM to 8:29 AM | 14 (5.0%) | 23 (11.5%) |
| 8:30 AM to 8:59 AM | 0 (0.0%) | 0 (0.0%) |
| 9:00 AM to 9:59 AM | 12 (4.3%) | 50 (25.0%) |
| 10:00 AM to 10:59 AM | 0 (0.0%) | 0 (0.0%) |
| 11:00 AM to 11:59 AM | 0 (0.0%) | 0 (0.0%) |
| 12:00 PM to 3:59 PM | 0 (0.0%) | 6 (3.0%) |
| 4:00 PM to 11:59 PM | 16 (5.7%) | 24 (12.0%) |
| Total | 280 (100.0%) | 200 (100.0%) |
Housing Occupancy in Grass Valley
Occupancy by Ownership in Grass Valley
Of the total 358 dwellings in Grass Valley, owner-occupied units account for 338 (94.4%), while renter-occupied units make up 20 (5.6%).
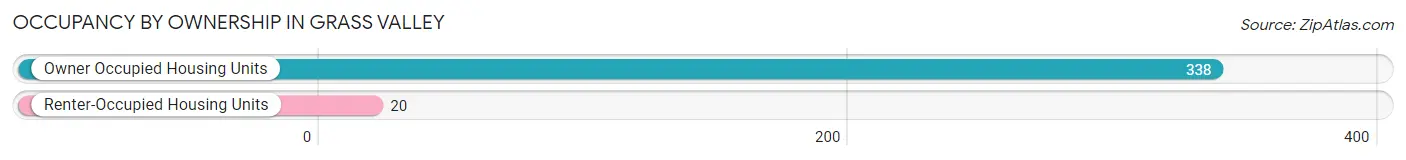
| Occupancy | # Housing Units | % Housing Units |
| Owner Occupied Housing Units | 338 | 94.4% |
| Renter-Occupied Housing Units | 20 | 5.6% |
| Total Occupied Housing Units | 358 | 100.0% |
Occupancy by Household Size in Grass Valley
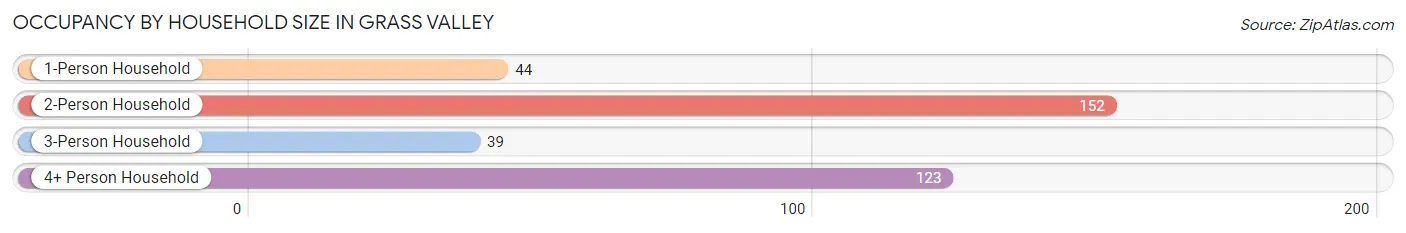
| Household Size | # Housing Units | % Housing Units |
| 1-Person Household | 44 | 12.3% |
| 2-Person Household | 152 | 42.5% |
| 3-Person Household | 39 | 10.9% |
| 4+ Person Household | 123 | 34.4% |
| Total Housing Units | 358 | 100.0% |
Occupancy by Ownership by Household Size in Grass Valley
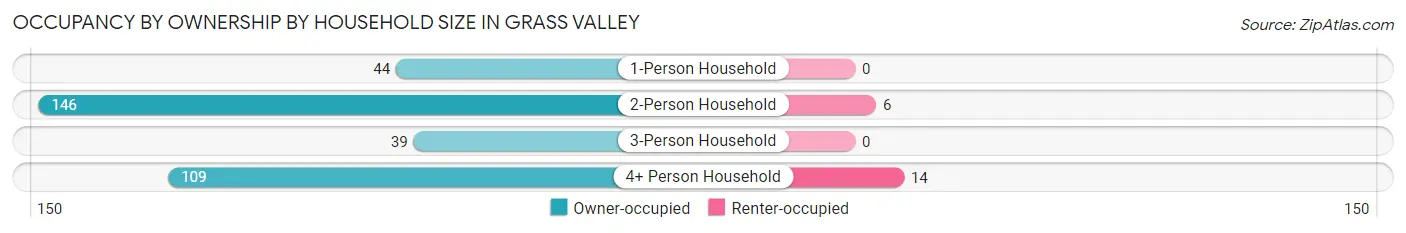
| Household Size | Owner-occupied | Renter-occupied |
| 1-Person Household | 44 (100.0%) | 0 (0.0%) |
| 2-Person Household | 146 (96.1%) | 6 (4.0%) |
| 3-Person Household | 39 (100.0%) | 0 (0.0%) |
| 4+ Person Household | 109 (88.6%) | 14 (11.4%) |
| Total Housing Units | 338 (94.4%) | 20 (5.6%) |
Occupancy by Educational Attainment in Grass Valley
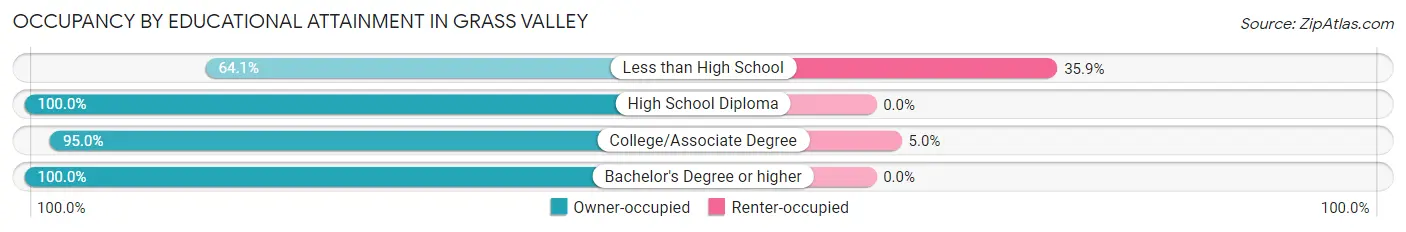
| Household Size | Owner-occupied | Renter-occupied |
| Less than High School | 25 (64.1%) | 14 (35.9%) |
| High School Diploma | 146 (100.0%) | 0 (0.0%) |
| College/Associate Degree | 113 (95.0%) | 6 (5.0%) |
| Bachelor's Degree or higher | 54 (100.0%) | 0 (0.0%) |
Occupancy by Age of Householder in Grass Valley
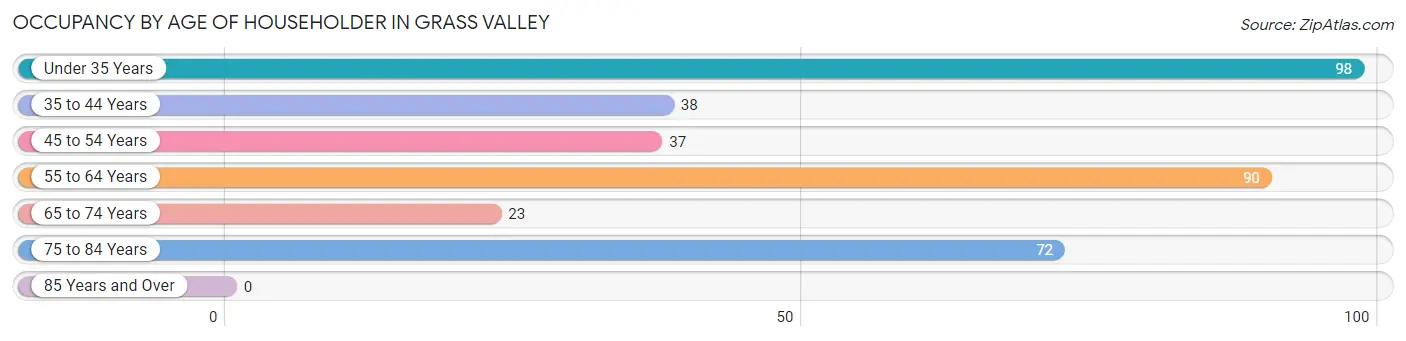
| Age Bracket | # Households | % Households |
| Under 35 Years | 98 | 27.4% |
| 35 to 44 Years | 38 | 10.6% |
| 45 to 54 Years | 37 | 10.3% |
| 55 to 64 Years | 90 | 25.1% |
| 65 to 74 Years | 23 | 6.4% |
| 75 to 84 Years | 72 | 20.1% |
| 85 Years and Over | 0 | 0.0% |
| Total | 358 | 100.0% |
Housing Finances in Grass Valley
Median Income by Occupancy in Grass Valley
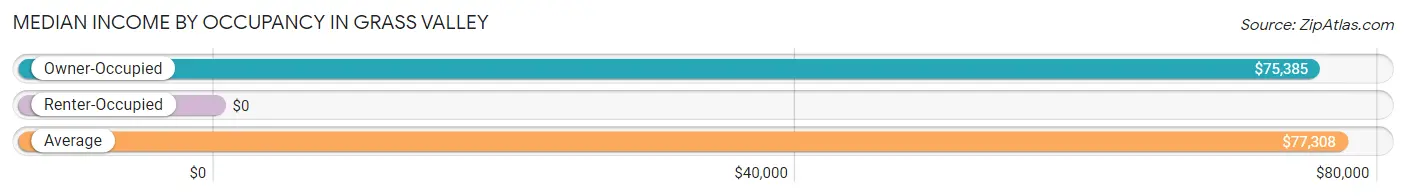
| Occupancy Type | # Households | Median Income |
| Owner-Occupied | 338 (94.4%) | $75,385 |
| Renter-Occupied | 20 (5.6%) | $0 |
| Average | 358 (100.0%) | $77,308 |
Occupancy by Householder Income Bracket in Grass Valley
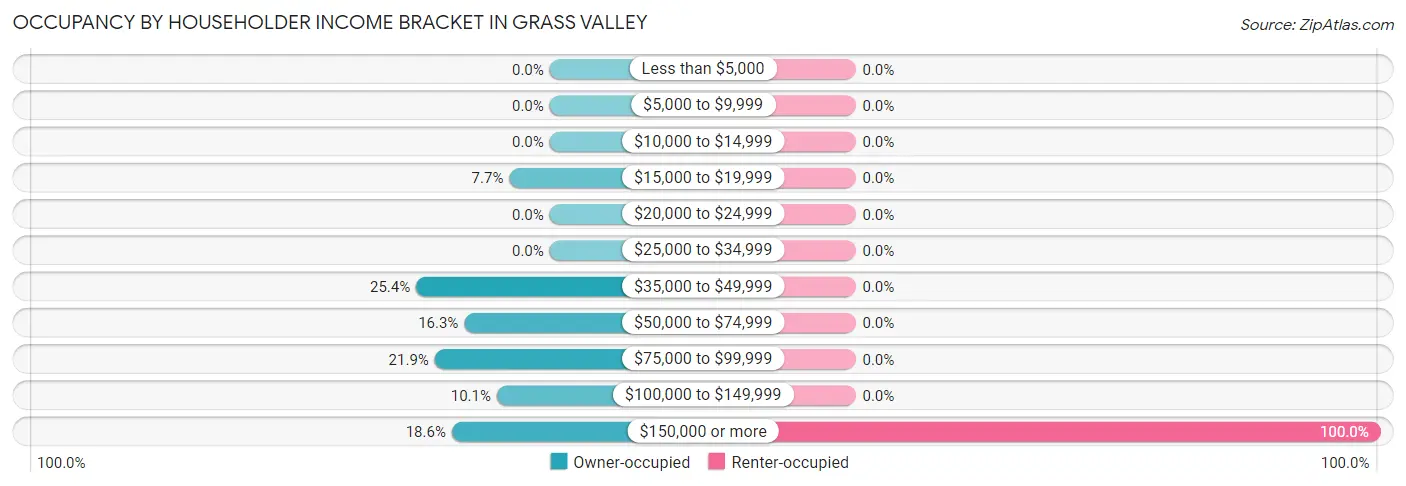
| Income Bracket | Owner-occupied | Renter-occupied |
| Less than $5,000 | 0 (0.0%) | 0 (0.0%) |
| $5,000 to $9,999 | 0 (0.0%) | 0 (0.0%) |
| $10,000 to $14,999 | 0 (0.0%) | 0 (0.0%) |
| $15,000 to $19,999 | 26 (7.7%) | 0 (0.0%) |
| $20,000 to $24,999 | 0 (0.0%) | 0 (0.0%) |
| $25,000 to $34,999 | 0 (0.0%) | 0 (0.0%) |
| $35,000 to $49,999 | 86 (25.4%) | 0 (0.0%) |
| $50,000 to $74,999 | 55 (16.3%) | 0 (0.0%) |
| $75,000 to $99,999 | 74 (21.9%) | 0 (0.0%) |
| $100,000 to $149,999 | 34 (10.1%) | 0 (0.0%) |
| $150,000 or more | 63 (18.6%) | 20 (100.0%) |
| Total | 338 (100.0%) | 20 (100.0%) |
Monthly Housing Cost Tiers in Grass Valley
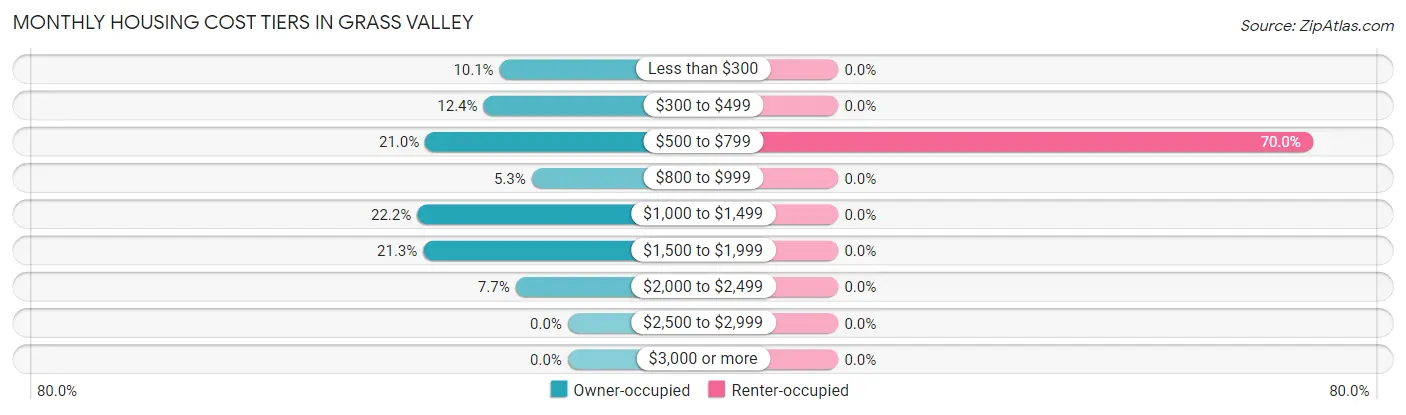
| Monthly Cost | Owner-occupied | Renter-occupied |
| Less than $300 | 34 (10.1%) | 0 (0.0%) |
| $300 to $499 | 42 (12.4%) | 0 (0.0%) |
| $500 to $799 | 71 (21.0%) | 14 (70.0%) |
| $800 to $999 | 18 (5.3%) | 0 (0.0%) |
| $1,000 to $1,499 | 75 (22.2%) | 0 (0.0%) |
| $1,500 to $1,999 | 72 (21.3%) | 0 (0.0%) |
| $2,000 to $2,499 | 26 (7.7%) | 0 (0.0%) |
| $2,500 to $2,999 | 0 (0.0%) | 0 (0.0%) |
| $3,000 or more | 0 (0.0%) | 0 (0.0%) |
| Total | 338 (100.0%) | 20 (100.0%) |
Physical Housing Characteristics in Grass Valley
Housing Structures in Grass Valley
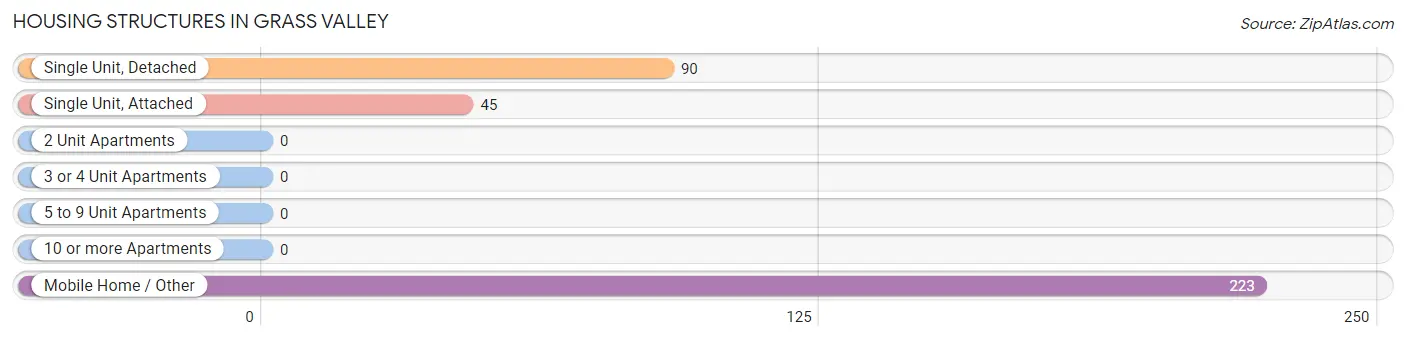
| Structure Type | # Housing Units | % Housing Units |
| Single Unit, Detached | 90 | 25.1% |
| Single Unit, Attached | 45 | 12.6% |
| 2 Unit Apartments | 0 | 0.0% |
| 3 or 4 Unit Apartments | 0 | 0.0% |
| 5 to 9 Unit Apartments | 0 | 0.0% |
| 10 or more Apartments | 0 | 0.0% |
| Mobile Home / Other | 223 | 62.3% |
| Total | 358 | 100.0% |
Housing Structures by Occupancy in Grass Valley
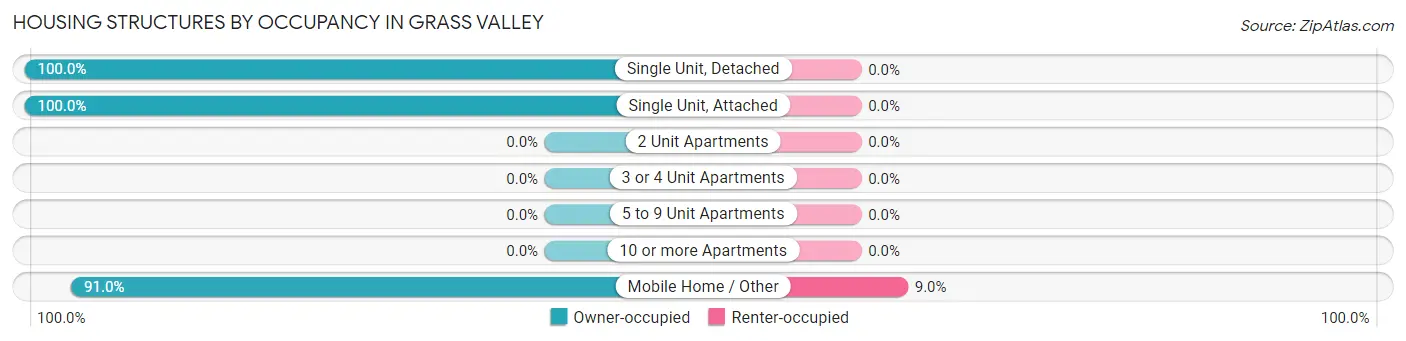
| Structure Type | Owner-occupied | Renter-occupied |
| Single Unit, Detached | 90 (100.0%) | 0 (0.0%) |
| Single Unit, Attached | 45 (100.0%) | 0 (0.0%) |
| 2 Unit Apartments | 0 (0.0%) | 0 (0.0%) |
| 3 or 4 Unit Apartments | 0 (0.0%) | 0 (0.0%) |
| 5 to 9 Unit Apartments | 0 (0.0%) | 0 (0.0%) |
| 10 or more Apartments | 0 (0.0%) | 0 (0.0%) |
| Mobile Home / Other | 203 (91.0%) | 20 (9.0%) |
| Total | 338 (94.4%) | 20 (5.6%) |
Housing Structures by Number of Rooms in Grass Valley
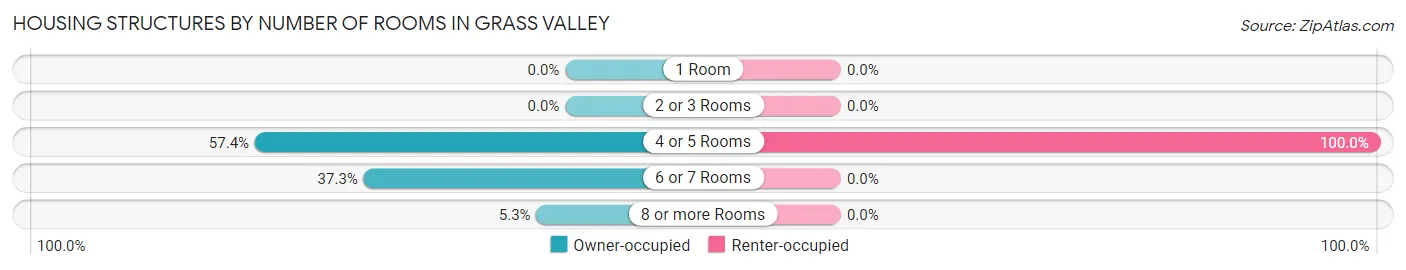
| Number of Rooms | Owner-occupied | Renter-occupied |
| 1 Room | 0 (0.0%) | 0 (0.0%) |
| 2 or 3 Rooms | 0 (0.0%) | 0 (0.0%) |
| 4 or 5 Rooms | 194 (57.4%) | 20 (100.0%) |
| 6 or 7 Rooms | 126 (37.3%) | 0 (0.0%) |
| 8 or more Rooms | 18 (5.3%) | 0 (0.0%) |
| Total | 338 (100.0%) | 20 (100.0%) |
Housing Structure by Heating Type in Grass Valley
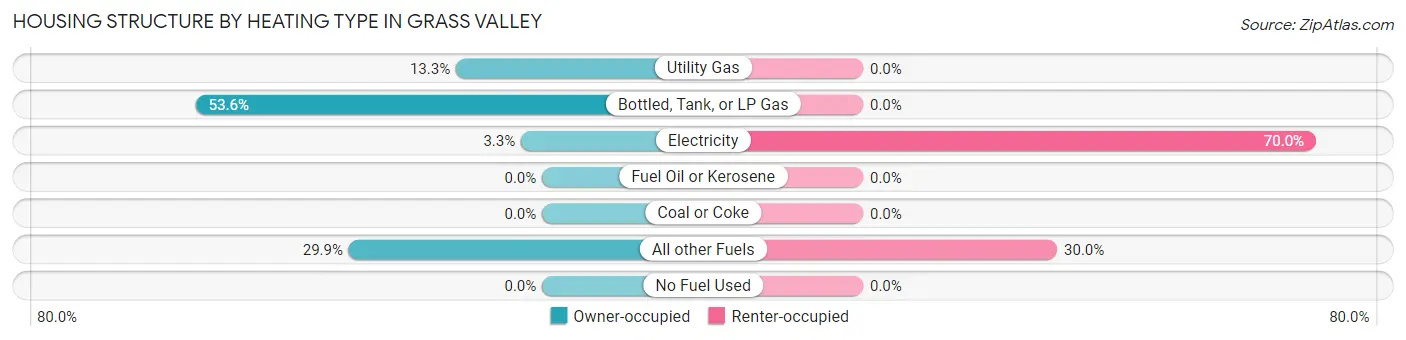
| Heating Type | Owner-occupied | Renter-occupied |
| Utility Gas | 45 (13.3%) | 0 (0.0%) |
| Bottled, Tank, or LP Gas | 181 (53.5%) | 0 (0.0%) |
| Electricity | 11 (3.3%) | 14 (70.0%) |
| Fuel Oil or Kerosene | 0 (0.0%) | 0 (0.0%) |
| Coal or Coke | 0 (0.0%) | 0 (0.0%) |
| All other Fuels | 101 (29.9%) | 6 (30.0%) |
| No Fuel Used | 0 (0.0%) | 0 (0.0%) |
| Total | 338 (100.0%) | 20 (100.0%) |
Household Vehicle Usage in Grass Valley
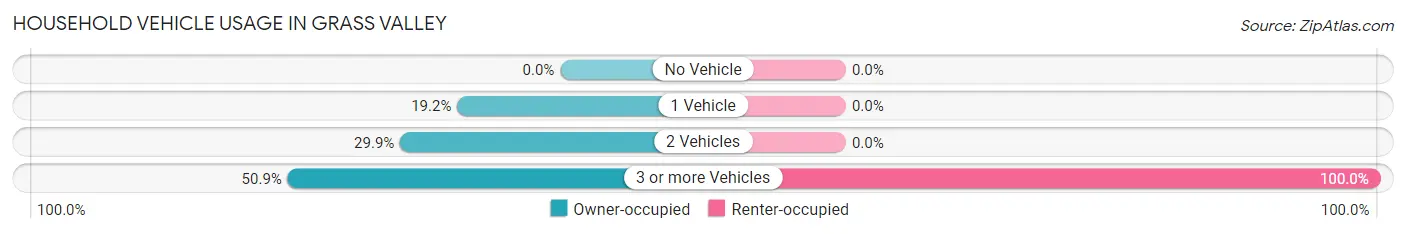
| Vehicles per Household | Owner-occupied | Renter-occupied |
| No Vehicle | 0 (0.0%) | 0 (0.0%) |
| 1 Vehicle | 65 (19.2%) | 0 (0.0%) |
| 2 Vehicles | 101 (29.9%) | 0 (0.0%) |
| 3 or more Vehicles | 172 (50.9%) | 20 (100.0%) |
| Total | 338 (100.0%) | 20 (100.0%) |
Real Estate & Mortgages in Grass Valley
Real Estate and Mortgage Overview in Grass Valley
| Characteristic | Without Mortgage | With Mortgage |
| Housing Units | 165 | 173 |
| Median Property Value | - | - |
| Median Household Income | $46,953 | $29 |
| Monthly Housing Costs | $625 | $0 |
| Real Estate Taxes | $1,292 | $12 |
Property Value by Mortgage Status in Grass Valley
| Property Value | Without Mortgage | With Mortgage |
| Less than $50,000 | 7 (4.2%) | 0 (0.0%) |
| $50,000 to $99,999 | 9 (5.4%) | 79 (45.7%) |
| $100,000 to $299,999 | 131 (79.4%) | 89 (51.4%) |
| $300,000 to $499,999 | 0 (0.0%) | 5 (2.9%) |
| $500,000 to $749,999 | 18 (10.9%) | 0 (0.0%) |
| $750,000 to $999,999 | 0 (0.0%) | 0 (0.0%) |
| $1,000,000 or more | 0 (0.0%) | 0 (0.0%) |
| Total | 165 (100.0%) | 173 (100.0%) |
Household Income by Mortgage Status in Grass Valley
| Household Income | Without Mortgage | With Mortgage |
| Less than $10,000 | 0 (0.0%) | 0 (0.0%) |
| $10,000 to $24,999 | 0 (0.0%) | 0 (0.0%) |
| $25,000 to $34,999 | 0 (0.0%) | 26 (15.0%) |
| $35,000 to $49,999 | 86 (52.1%) | 0 (0.0%) |
| $50,000 to $74,999 | 20 (12.1%) | 0 (0.0%) |
| $75,000 to $99,999 | 8 (4.9%) | 35 (20.2%) |
| $100,000 to $149,999 | 17 (10.3%) | 66 (38.2%) |
| $150,000 or more | 34 (20.6%) | 17 (9.8%) |
| Total | 165 (100.0%) | 173 (100.0%) |
Property Value to Household Income Ratio in Grass Valley
| Value-to-Income Ratio | Without Mortgage | With Mortgage |
| Less than 2.0x | 75 (45.5%) | 90,590 (52,364.2%) |
| 2.0x to 2.9x | 11 (6.7%) | 127 (73.4%) |
| 3.0x to 3.9x | 16 (9.7%) | 7 (4.1%) |
| 4.0x or more | 63 (38.2%) | 39 (22.5%) |
| Total | 165 (100.0%) | 173 (100.0%) |
Real Estate Taxes by Mortgage Status in Grass Valley
| Property Taxes | Without Mortgage | With Mortgage |
| Less than $800 | 60 (36.4%) | 0 (0.0%) |
| $800 to $1,499 | 18 (10.9%) | 99 (57.2%) |
| $800 to $1,499 | 63 (38.2%) | 62 (35.8%) |
| Total | 165 (100.0%) | 173 (100.0%) |
Health & Disability in Grass Valley
Health Insurance Coverage by Age in Grass Valley
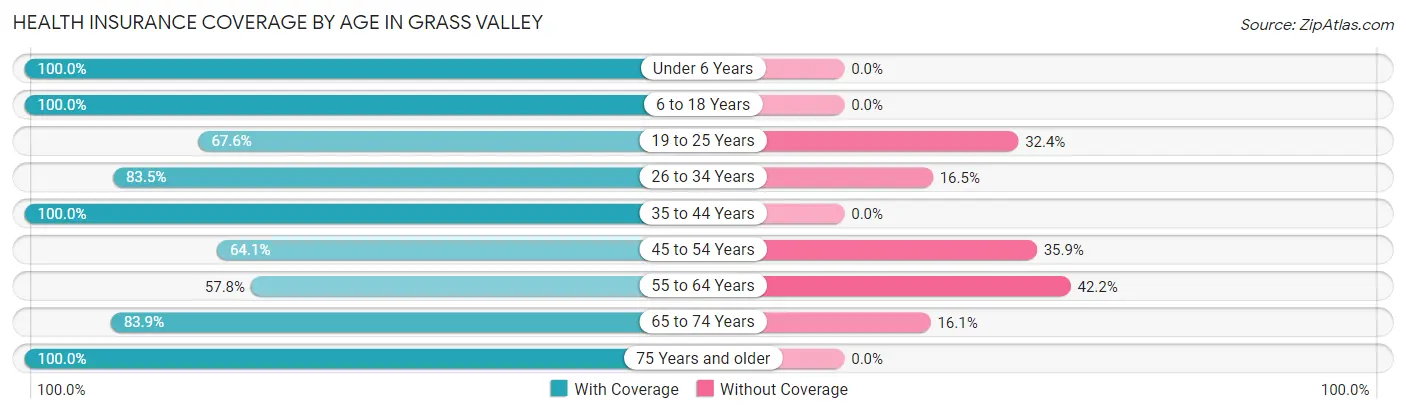
| Age Bracket | With Coverage | Without Coverage |
| Under 6 Years | 86 (100.0%) | 0 (0.0%) |
| 6 to 18 Years | 251 (100.0%) | 0 (0.0%) |
| 19 to 25 Years | 100 (67.6%) | 48 (32.4%) |
| 26 to 34 Years | 162 (83.5%) | 32 (16.5%) |
| 35 to 44 Years | 90 (100.0%) | 0 (0.0%) |
| 45 to 54 Years | 84 (64.1%) | 47 (35.9%) |
| 55 to 64 Years | 74 (57.8%) | 54 (42.2%) |
| 65 to 74 Years | 47 (83.9%) | 9 (16.1%) |
| 75 Years and older | 106 (100.0%) | 0 (0.0%) |
| Total | 1,000 (84.0%) | 190 (16.0%) |
Health Insurance Coverage by Citizenship Status in Grass Valley
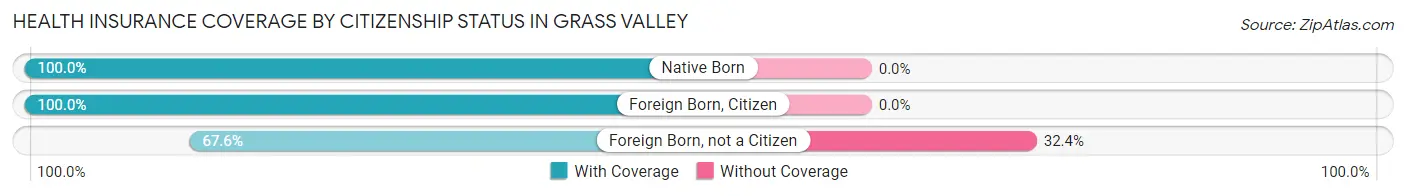
| Citizenship Status | With Coverage | Without Coverage |
| Native Born | 86 (100.0%) | 0 (0.0%) |
| Foreign Born, Citizen | 251 (100.0%) | 0 (0.0%) |
| Foreign Born, not a Citizen | 100 (67.6%) | 48 (32.4%) |
Health Insurance Coverage by Household Income in Grass Valley
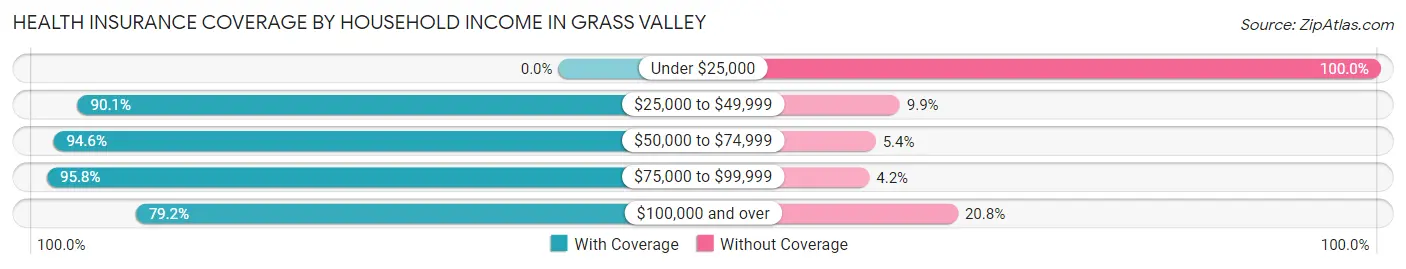
| Household Income | With Coverage | Without Coverage |
| Under $25,000 | 0 (0.0%) | 26 (100.0%) |
| $25,000 to $49,999 | 145 (90.1%) | 16 (9.9%) |
| $50,000 to $74,999 | 157 (94.6%) | 9 (5.4%) |
| $75,000 to $99,999 | 204 (95.8%) | 9 (4.2%) |
| $100,000 and over | 494 (79.2%) | 130 (20.8%) |
Public vs Private Health Insurance Coverage by Age in Grass Valley
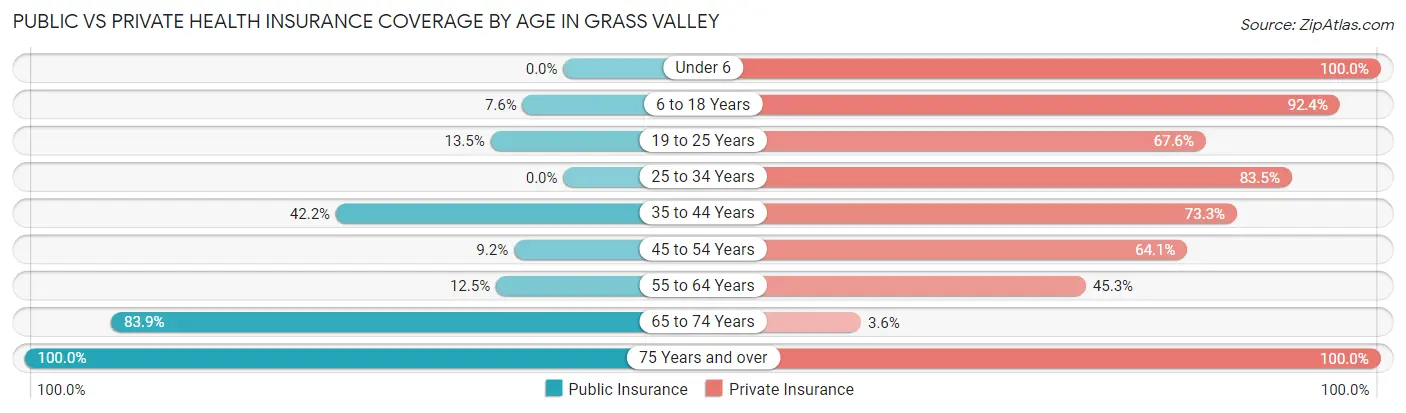
| Age Bracket | Public Insurance | Private Insurance |
| Under 6 | 0 (0.0%) | 86 (100.0%) |
| 6 to 18 Years | 19 (7.6%) | 232 (92.4%) |
| 19 to 25 Years | 20 (13.5%) | 100 (67.6%) |
| 25 to 34 Years | 0 (0.0%) | 162 (83.5%) |
| 35 to 44 Years | 38 (42.2%) | 66 (73.3%) |
| 45 to 54 Years | 12 (9.2%) | 84 (64.1%) |
| 55 to 64 Years | 16 (12.5%) | 58 (45.3%) |
| 65 to 74 Years | 47 (83.9%) | 2 (3.6%) |
| 75 Years and over | 106 (100.0%) | 106 (100.0%) |
| Total | 258 (21.7%) | 896 (75.3%) |
Disability Status by Sex by Age in Grass Valley
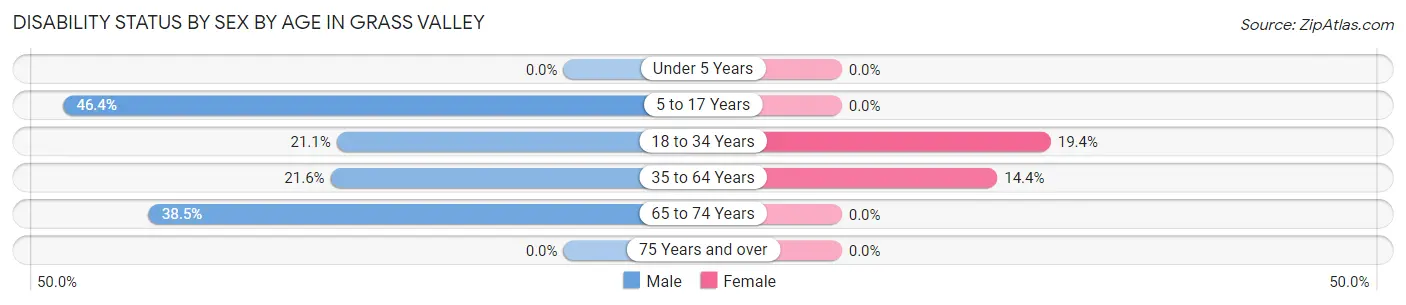
| Age Bracket | Male | Female |
| Under 5 Years | 0 (0.0%) | 0 (0.0%) |
| 5 to 17 Years | 64 (46.4%) | 0 (0.0%) |
| 18 to 34 Years | 48 (21.0%) | 26 (19.4%) |
| 35 to 64 Years | 32 (21.6%) | 29 (14.4%) |
| 65 to 74 Years | 15 (38.5%) | 0 (0.0%) |
| 75 Years and over | 0 (0.0%) | 0 (0.0%) |
Disability Class by Sex by Age in Grass Valley
Disability Class: Hearing Difficulty
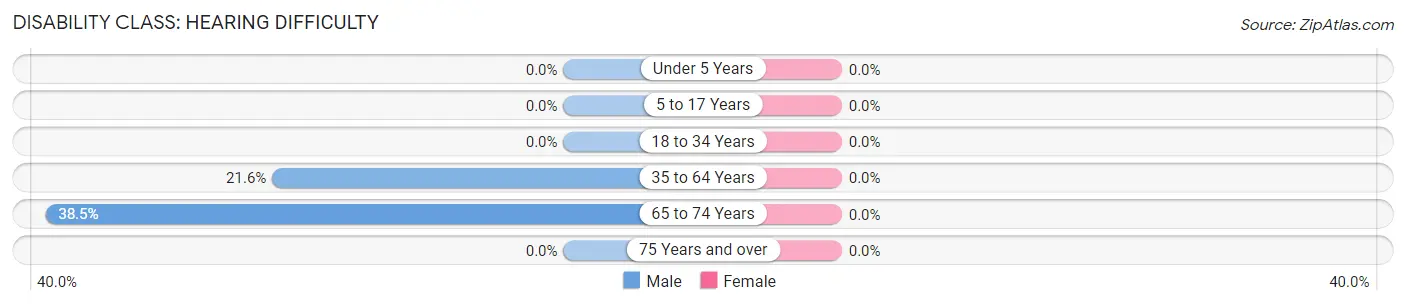
| Age Bracket | Male | Female |
| Under 5 Years | 0 (0.0%) | 0 (0.0%) |
| 5 to 17 Years | 0 (0.0%) | 0 (0.0%) |
| 18 to 34 Years | 0 (0.0%) | 0 (0.0%) |
| 35 to 64 Years | 32 (21.6%) | 0 (0.0%) |
| 65 to 74 Years | 15 (38.5%) | 0 (0.0%) |
| 75 Years and over | 0 (0.0%) | 0 (0.0%) |
Disability Class: Vision Difficulty
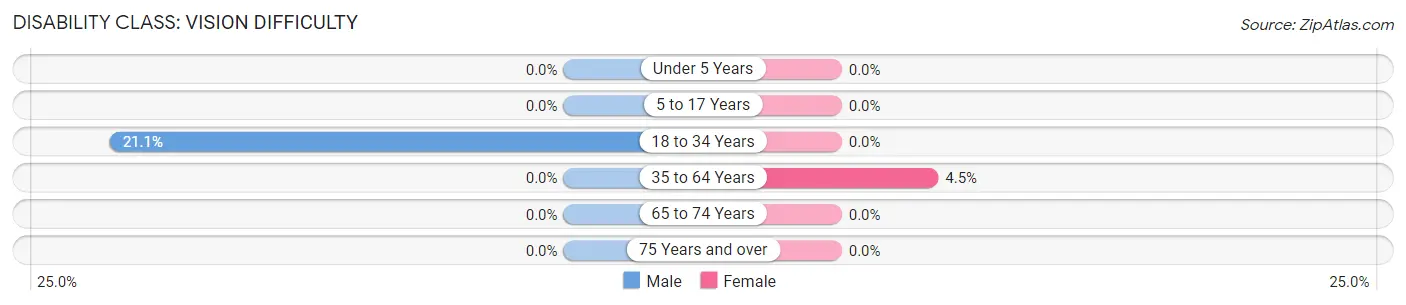
| Age Bracket | Male | Female |
| Under 5 Years | 0 (0.0%) | 0 (0.0%) |
| 5 to 17 Years | 0 (0.0%) | 0 (0.0%) |
| 18 to 34 Years | 48 (21.0%) | 0 (0.0%) |
| 35 to 64 Years | 0 (0.0%) | 9 (4.5%) |
| 65 to 74 Years | 0 (0.0%) | 0 (0.0%) |
| 75 Years and over | 0 (0.0%) | 0 (0.0%) |
Disability Class: Cognitive Difficulty
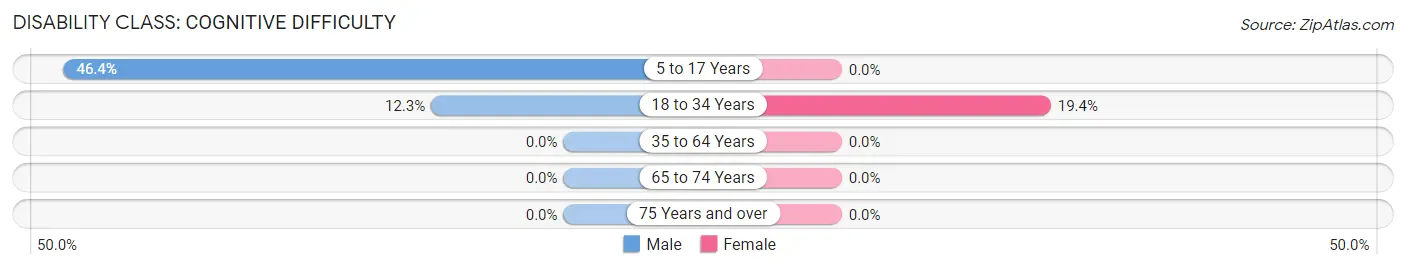
| Age Bracket | Male | Female |
| 5 to 17 Years | 64 (46.4%) | 0 (0.0%) |
| 18 to 34 Years | 28 (12.3%) | 26 (19.4%) |
| 35 to 64 Years | 0 (0.0%) | 0 (0.0%) |
| 65 to 74 Years | 0 (0.0%) | 0 (0.0%) |
| 75 Years and over | 0 (0.0%) | 0 (0.0%) |
Disability Class: Ambulatory Difficulty
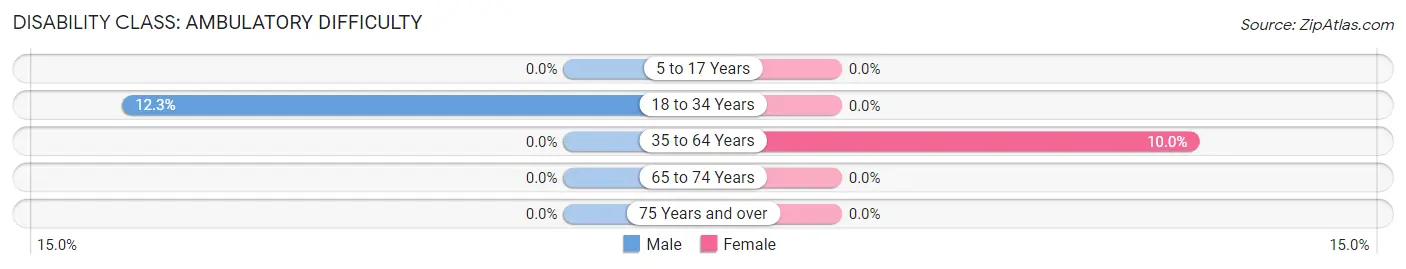
| Age Bracket | Male | Female |
| 5 to 17 Years | 0 (0.0%) | 0 (0.0%) |
| 18 to 34 Years | 28 (12.3%) | 0 (0.0%) |
| 35 to 64 Years | 0 (0.0%) | 20 (10.0%) |
| 65 to 74 Years | 0 (0.0%) | 0 (0.0%) |
| 75 Years and over | 0 (0.0%) | 0 (0.0%) |
Disability Class: Self-Care Difficulty
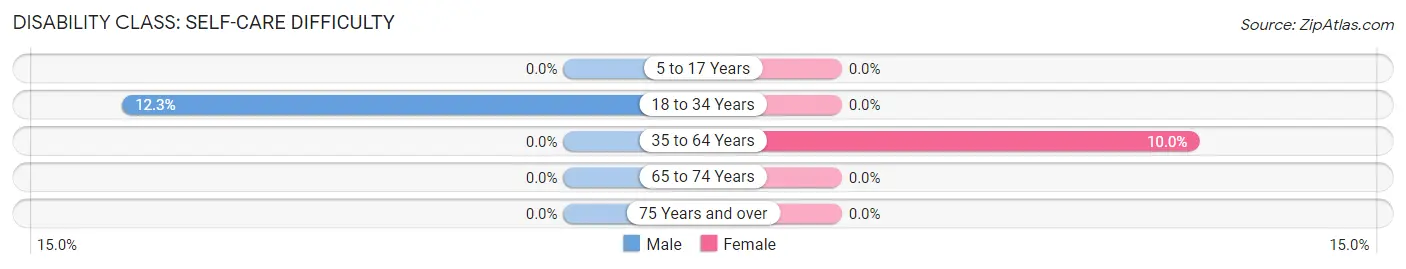
| Age Bracket | Male | Female |
| 5 to 17 Years | 0 (0.0%) | 0 (0.0%) |
| 18 to 34 Years | 28 (12.3%) | 0 (0.0%) |
| 35 to 64 Years | 0 (0.0%) | 20 (10.0%) |
| 65 to 74 Years | 0 (0.0%) | 0 (0.0%) |
| 75 Years and over | 0 (0.0%) | 0 (0.0%) |
Technology Access in Grass Valley
Computing Device Access in Grass Valley
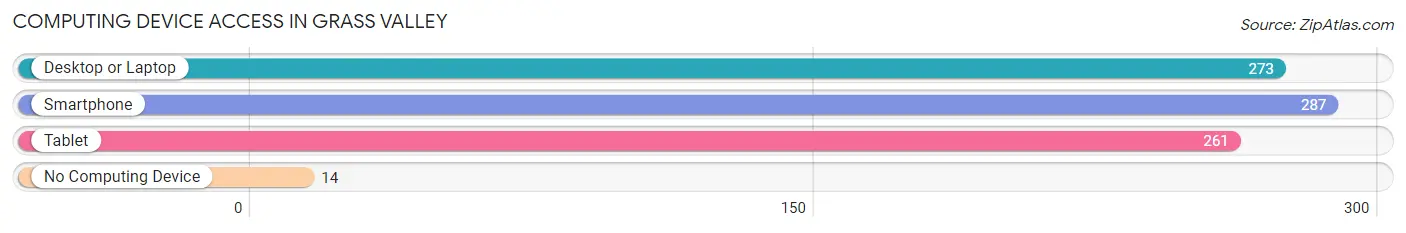
| Device Type | # Households | % Households |
| Desktop or Laptop | 273 | 76.3% |
| Smartphone | 287 | 80.2% |
| Tablet | 261 | 72.9% |
| No Computing Device | 14 | 3.9% |
| Total | 358 | 100.0% |
Internet Access in Grass Valley
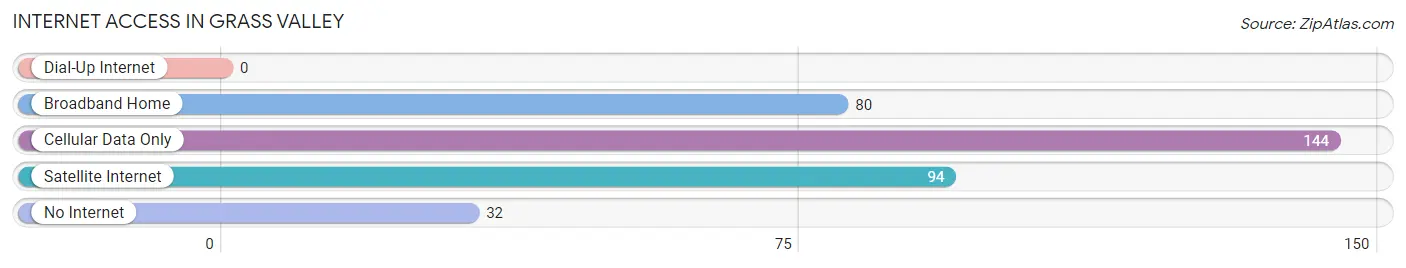
| Internet Type | # Households | % Households |
| Dial-Up Internet | 0 | 0.0% |
| Broadband Home | 80 | 22.4% |
| Cellular Data Only | 144 | 40.2% |
| Satellite Internet | 94 | 26.3% |
| No Internet | 32 | 8.9% |
| Total | 358 | 100.0% |
Grass Valley Summary
Grass Valley is a small unincorporated community located in Nevada, United States. It is situated in the northern part of the state, in the Humboldt County. The population of Grass Valley was estimated to be around 200 people in 2020.
History
Grass Valley was first settled in the late 1800s by miners who were looking for gold and silver. The town was named after the grassy meadows that surrounded it. The first post office was established in 1883.
In the early 1900s, the town was a popular stop for travelers on the stagecoach line between Winnemucca and Elko. The town also had a hotel, a saloon, and a general store.
In the 1920s, the town began to decline as the mining industry in the area declined. The post office closed in 1929 and the town was abandoned.
Geography
Grass Valley is located in the northern part of Nevada, in the Humboldt County. It is situated at an elevation of 4,890 feet above sea level. The town is surrounded by the Humboldt National Forest and is located near the Nevada-Oregon border.
The climate in Grass Valley is semi-arid, with hot summers and cold winters. The average annual temperature is around 50°F. The average annual precipitation is around 8 inches.
Economy
The economy of Grass Valley is largely based on tourism. The town is a popular destination for outdoor activities such as camping, fishing, and hunting. There are also several small businesses in the area, including a gas station, a general store, and a restaurant.
Demographics
As of 2020, the population of Grass Valley was estimated to be around 200 people. The racial makeup of the town is predominantly white, with a small percentage of Native American and Hispanic residents. The median household income in Grass Valley is around $35,000. The median age of the population is around 40 years old.
Common Questions
What is the Total Population of Grass Valley?
Total Population of Grass Valley is 1,190.
What is the Total Male Population of Grass Valley?
Total Male Population of Grass Valley is 669.
What is the Total Female Population of Grass Valley?
Total Female Population of Grass Valley is 521.
What is the Ratio of Males per 100 Females in Grass Valley?
There are 128.41 Males per 100 Females in Grass Valley.
What is the Ratio of Females per 100 Males in Grass Valley?
There are 77.88 Females per 100 Males in Grass Valley.
What is the Median Population Age in Grass Valley?
Median Population Age in Grass Valley is 27.9 Years.
What is the Average Family Size in Grass Valley
Average Family Size in Grass Valley is 3.7 People.
What is the Average Household Size in Grass Valley
Average Household Size in Grass Valley is 3.3 People.
What is Per Capita Income in Grass Valley?
Per Capita income in Grass Valley is $37,866.
What is the Median Family Income in Grass Valley?
Median Family Income in Grass Valley is $91,368.
What is the Median Household income in Grass Valley?
Median Household Income in Grass Valley is $77,308.
What is Income or Wage Gap in Grass Valley?
Income or Wage Gap in Grass Valley is 77.2%.
Women in Grass Valley earn 22.8 cents for every dollar earned by a man.
What is Inequality or Gini Index in Grass Valley?
Inequality or Gini Index in Grass Valley is 0.35.
How Large is the Labor Force in Grass Valley?
There are 608 People in the Labor Forcein in Grass Valley.
What is the Percentage of People in the Labor Force in Grass Valley?
66.2% of People are in the Labor Force in Grass Valley.
What is the Unemployment Rate in Grass Valley?
Unemployment Rate in Grass Valley is 12.2%.