Zip Codes with the Highest Percentage of Population Employed in Legal Services & Support in Gardnerville, NV
RELATED REPORTS & OPTIONS
Legal Services & Support
Gardnerville
Compare Zip Codes
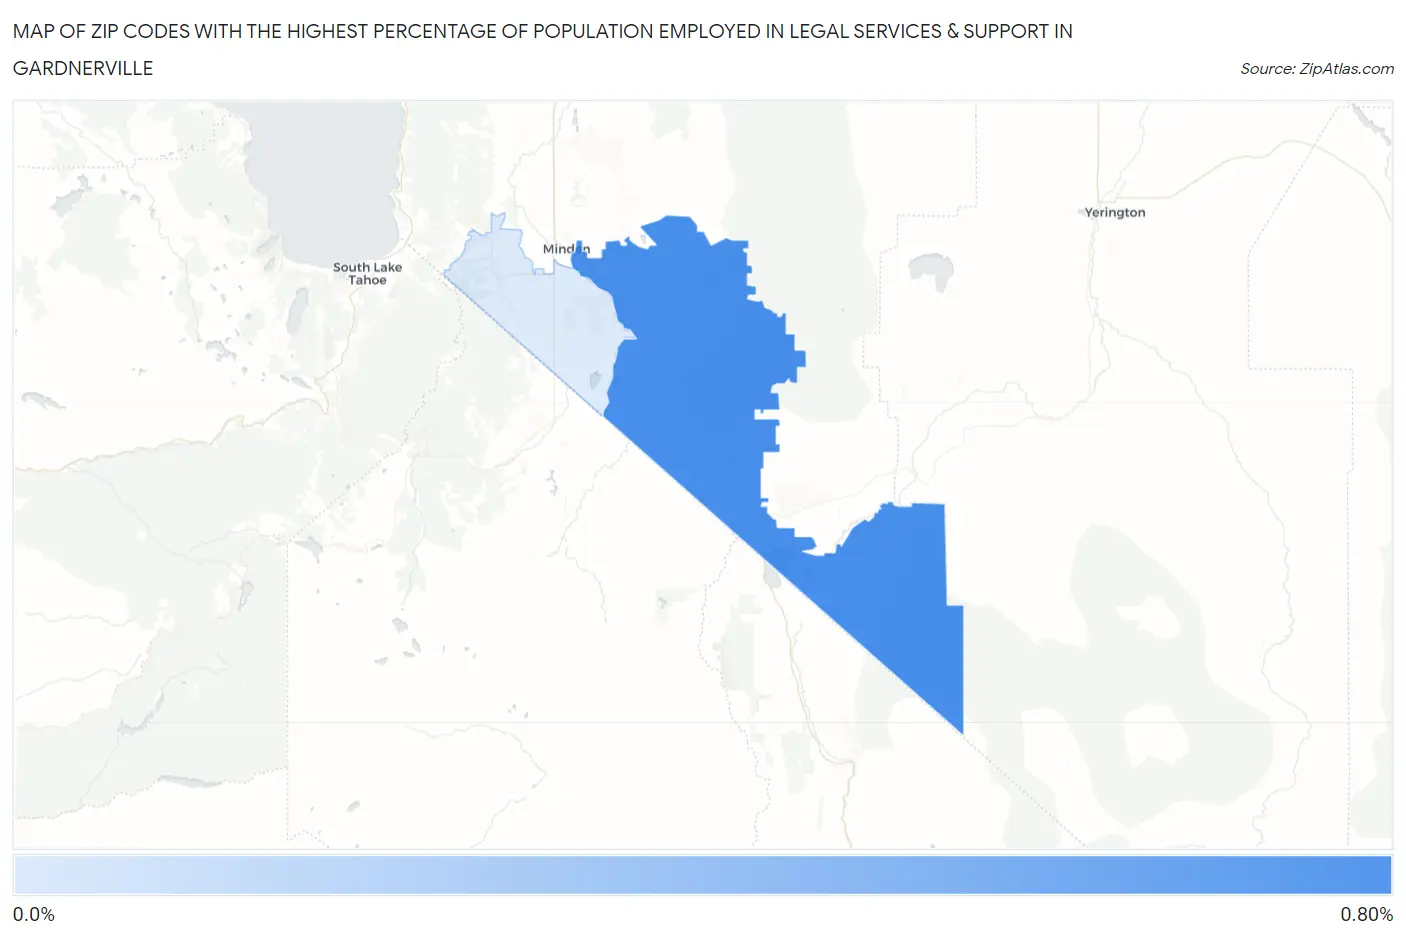
Map of Zip Codes with the Highest Percentage of Population Employed in Legal Services & Support in Gardnerville
0.0%
0.80%
Zip Codes with the Highest Percentage of Population Employed in Legal Services & Support in Gardnerville, NV
| Zip Code | % Employed | vs State | vs National | |
| 1. | 89410 | 0.66% | 0.99%(-0.331)#70 | 1.2%(-0.528)#10,882 |
| 2. | 89460 | 0.11% | 0.99%(-0.873)#103 | 1.2%(-1.07)#17,016 |
1
Common Questions
What are the Top Zip Codes with the Highest Percentage of Population Employed in Legal Services & Support in Gardnerville, NV?
Top Zip Codes with the Highest Percentage of Population Employed in Legal Services & Support in Gardnerville, NV are:
What zip code has the Highest Percentage of Population Employed in Legal Services & Support in Gardnerville, NV?
89410 has the Highest Percentage of Population Employed in Legal Services & Support in Gardnerville, NV with 0.66%.
What is the Percentage of Population Employed in Legal Services & Support in Gardnerville, NV?
Percentage of Population Employed in Legal Services & Support in Gardnerville is 0.27%.
What is the Percentage of Population Employed in Legal Services & Support in Nevada?
Percentage of Population Employed in Legal Services & Support in Nevada is 0.99%.
What is the Percentage of Population Employed in Legal Services & Support in the United States?
Percentage of Population Employed in Legal Services & Support in the United States is 1.2%.