Zip Codes with the Highest Percentage of Population Employed in Legal Services & Support in Henderson, NV
RELATED REPORTS & OPTIONS
Legal Services & Support
Henderson
Compare Zip Codes
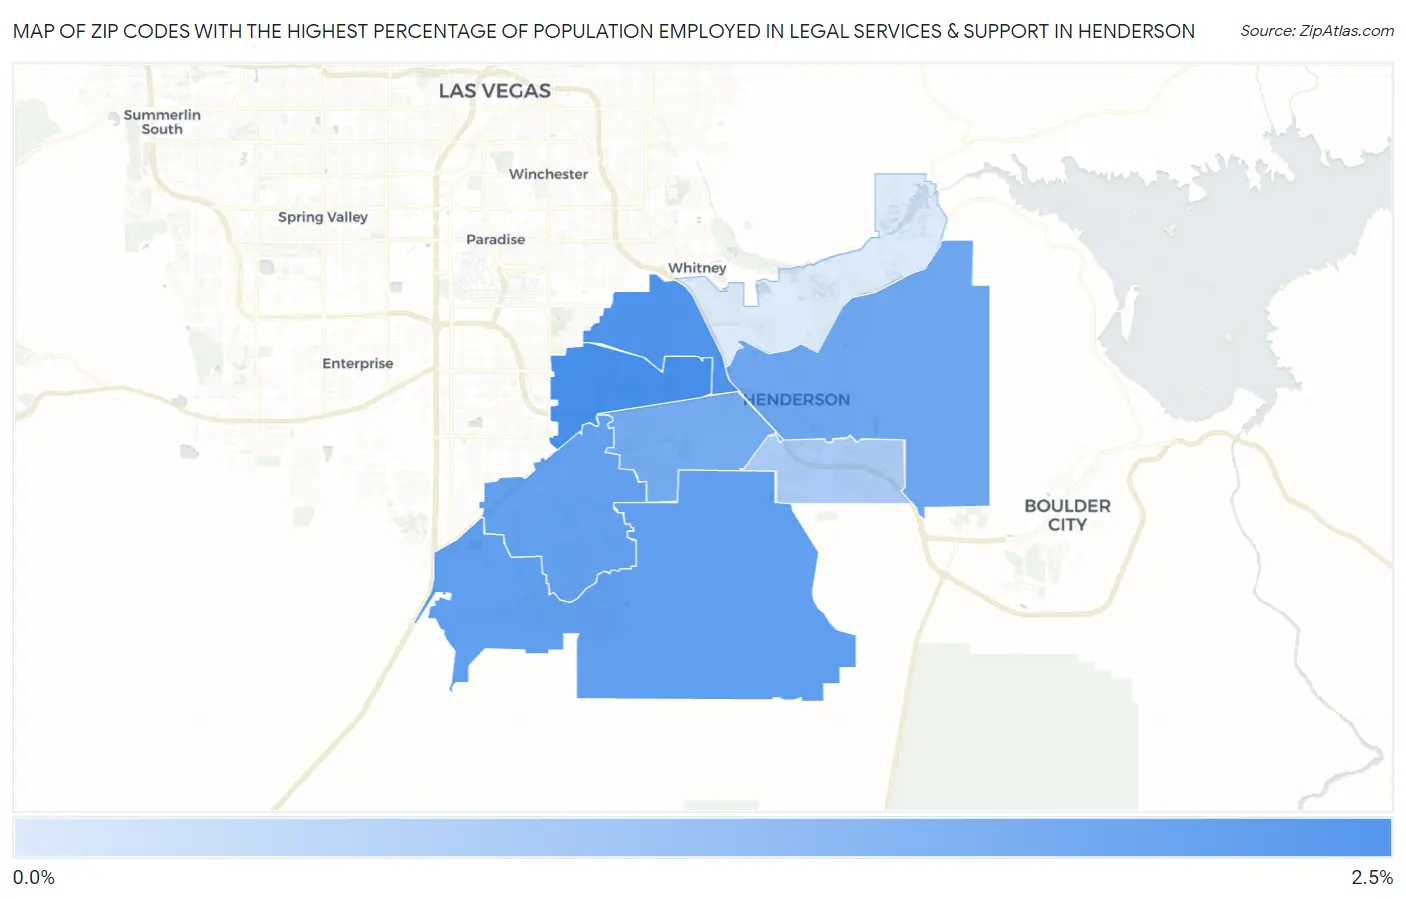
Map of Zip Codes with the Highest Percentage of Population Employed in Legal Services & Support in Henderson
0.0%
2.5%
Zip Codes with the Highest Percentage of Population Employed in Legal Services & Support in Henderson, NV
| Zip Code | % Employed | vs State | vs National | |
| 1. | 89074 | 2.1% | 0.99%(+1.15)#15 | 1.2%(+0.949)#3,173 |
| 2. | 89014 | 2.0% | 0.99%(+1.05)#17 | 1.2%(+0.855)#3,368 |
| 3. | 89044 | 1.8% | 0.99%(+0.862)#19 | 1.2%(+0.665)#3,866 |
| 4. | 89052 | 1.8% | 0.99%(+0.827)#20 | 1.2%(+0.630)#3,970 |
| 5. | 89015 | 1.7% | 0.99%(+0.718)#22 | 1.2%(+0.521)#4,302 |
| 6. | 89012 | 1.6% | 0.99%(+0.642)#26 | 1.2%(+0.445)#4,574 |
| 7. | 89002 | 1.0% | 0.99%(+0.048)#45 | 1.2%(-0.149)#7,588 |
| 8. | 89011 | 0.48% | 0.99%(-0.509)#82 | 1.2%(-0.707)#12,921 |
1
Common Questions
What are the Top 5 Zip Codes with the Highest Percentage of Population Employed in Legal Services & Support in Henderson, NV?
Top 5 Zip Codes with the Highest Percentage of Population Employed in Legal Services & Support in Henderson, NV are:
What zip code has the Highest Percentage of Population Employed in Legal Services & Support in Henderson, NV?
89074 has the Highest Percentage of Population Employed in Legal Services & Support in Henderson, NV with 2.1%.
What is the Percentage of Population Employed in Legal Services & Support in Henderson, NV?
Percentage of Population Employed in Legal Services & Support in Henderson is 1.6%.
What is the Percentage of Population Employed in Legal Services & Support in Nevada?
Percentage of Population Employed in Legal Services & Support in Nevada is 0.99%.
What is the Percentage of Population Employed in Legal Services & Support in the United States?
Percentage of Population Employed in Legal Services & Support in the United States is 1.2%.