Zip Codes with the Highest Percentage of Population Employed in Food Preparation & Serving in Vineland, NJ
RELATED REPORTS & OPTIONS
Food Preparation & Serving
Vineland
Compare Zip Codes
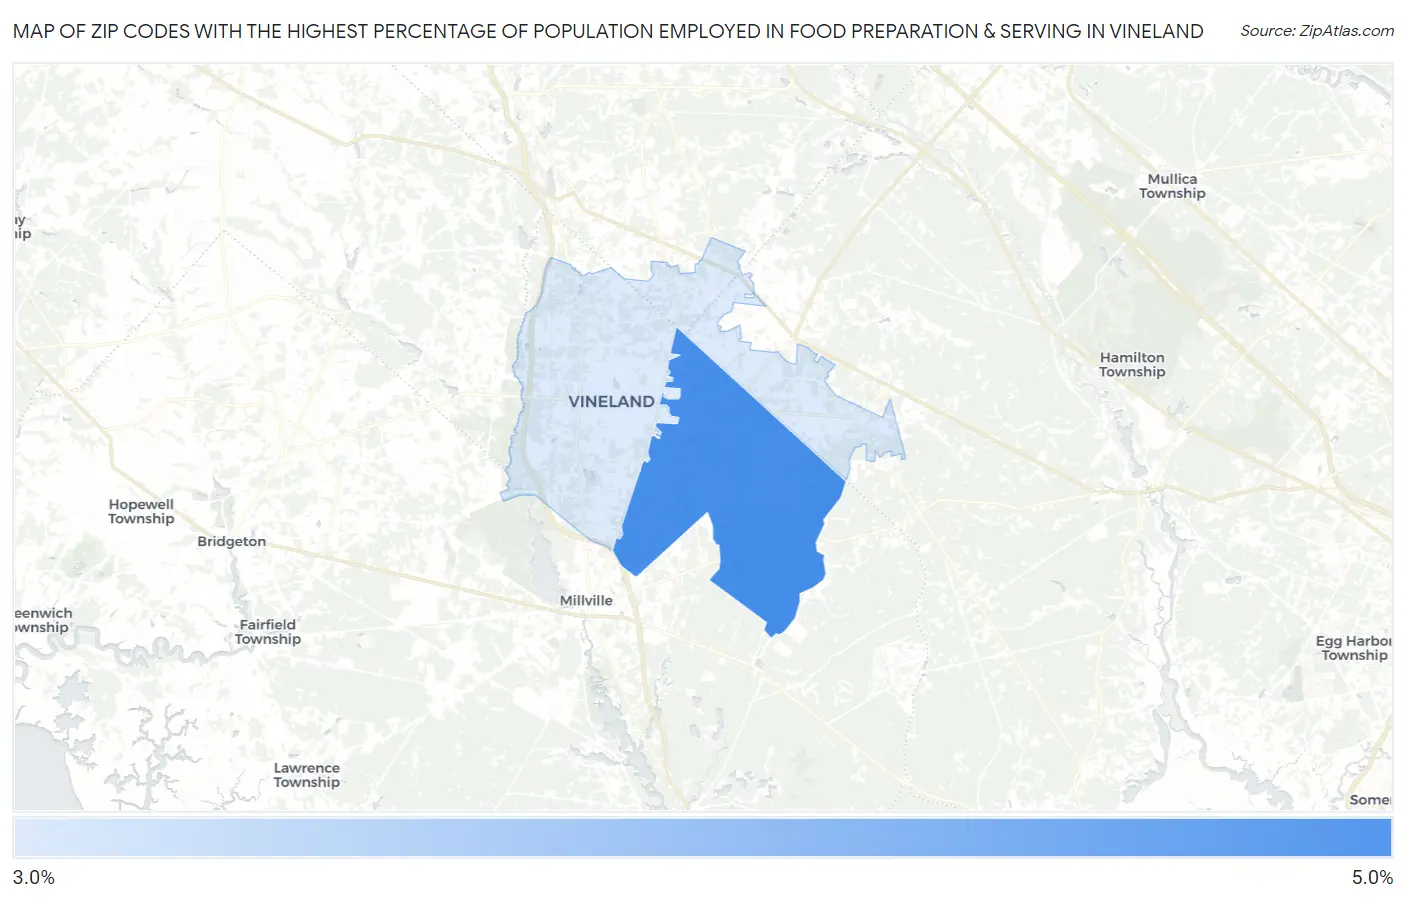
Map of Zip Codes with the Highest Percentage of Population Employed in Food Preparation & Serving in Vineland
0.0%
5.0%
Zip Codes with the Highest Percentage of Population Employed in Food Preparation & Serving in Vineland, NJ
| Zip Code | % Employed | vs State | vs National | |
| 1. | 08361 | 4.3% | 4.0%(+0.357)#189 | 5.3%(-0.966)#15,791 |
| 2. | 08360 | 3.6% | 4.0%(-0.317)#247 | 5.3%(-1.64)#18,578 |
1
Common Questions
What are the Top Zip Codes with the Highest Percentage of Population Employed in Food Preparation & Serving in Vineland, NJ?
Top Zip Codes with the Highest Percentage of Population Employed in Food Preparation & Serving in Vineland, NJ are:
What zip code has the Highest Percentage of Population Employed in Food Preparation & Serving in Vineland, NJ?
08361 has the Highest Percentage of Population Employed in Food Preparation & Serving in Vineland, NJ with 4.3%.
What is the Percentage of Population Employed in Food Preparation & Serving in Vineland, NJ?
Percentage of Population Employed in Food Preparation & Serving in Vineland is 4.3%.
What is the Percentage of Population Employed in Food Preparation & Serving in New Jersey?
Percentage of Population Employed in Food Preparation & Serving in New Jersey is 4.0%.
What is the Percentage of Population Employed in Food Preparation & Serving in the United States?
Percentage of Population Employed in Food Preparation & Serving in the United States is 5.3%.