Zip Codes with the Highest Percentage of Population Employed in Transportation & Warehousing in Vineland, NJ
RELATED REPORTS & OPTIONS
Transportation & Warehousing
Vineland
Compare Zip Codes
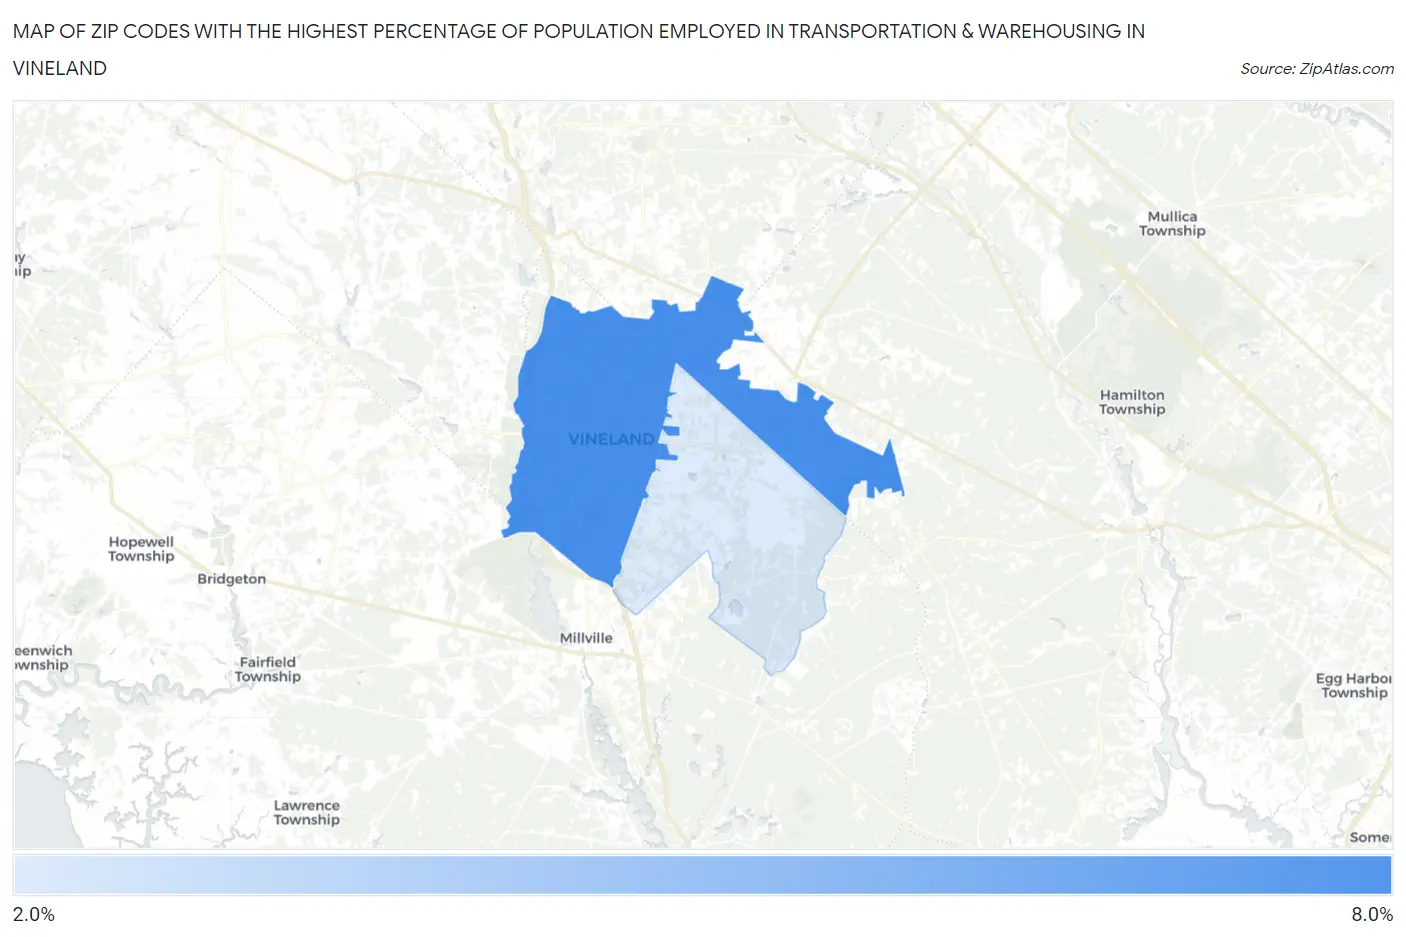
Map of Zip Codes with the Highest Percentage of Population Employed in Transportation & Warehousing in Vineland
0.0%
8.0%
Zip Codes with the Highest Percentage of Population Employed in Transportation & Warehousing in Vineland, NJ
| Zip Code | % Employed | vs State | vs National | |
| 1. | 08360 | 6.2% | 5.8%(+0.414)#162 | 4.9%(+1.23)#8,338 |
| 2. | 08361 | 2.4% | 5.8%(-3.34)#430 | 4.9%(-2.52)#22,709 |
1
Common Questions
What are the Top Zip Codes with the Highest Percentage of Population Employed in Transportation & Warehousing in Vineland, NJ?
Top Zip Codes with the Highest Percentage of Population Employed in Transportation & Warehousing in Vineland, NJ are:
What zip code has the Highest Percentage of Population Employed in Transportation & Warehousing in Vineland, NJ?
08360 has the Highest Percentage of Population Employed in Transportation & Warehousing in Vineland, NJ with 6.2%.
What is the Percentage of Population Employed in Transportation & Warehousing in Vineland, NJ?
Percentage of Population Employed in Transportation & Warehousing in Vineland is 5.1%.
What is the Percentage of Population Employed in Transportation & Warehousing in New Jersey?
Percentage of Population Employed in Transportation & Warehousing in New Jersey is 5.8%.
What is the Percentage of Population Employed in Transportation & Warehousing in the United States?
Percentage of Population Employed in Transportation & Warehousing in the United States is 4.9%.