Zip Codes with the Highest Percentage of Population with a Degree in Liberal Arts and History in Vineland, NJ
RELATED REPORTS & OPTIONS
Liberal Arts and History
Vineland
Compare Zip Codes
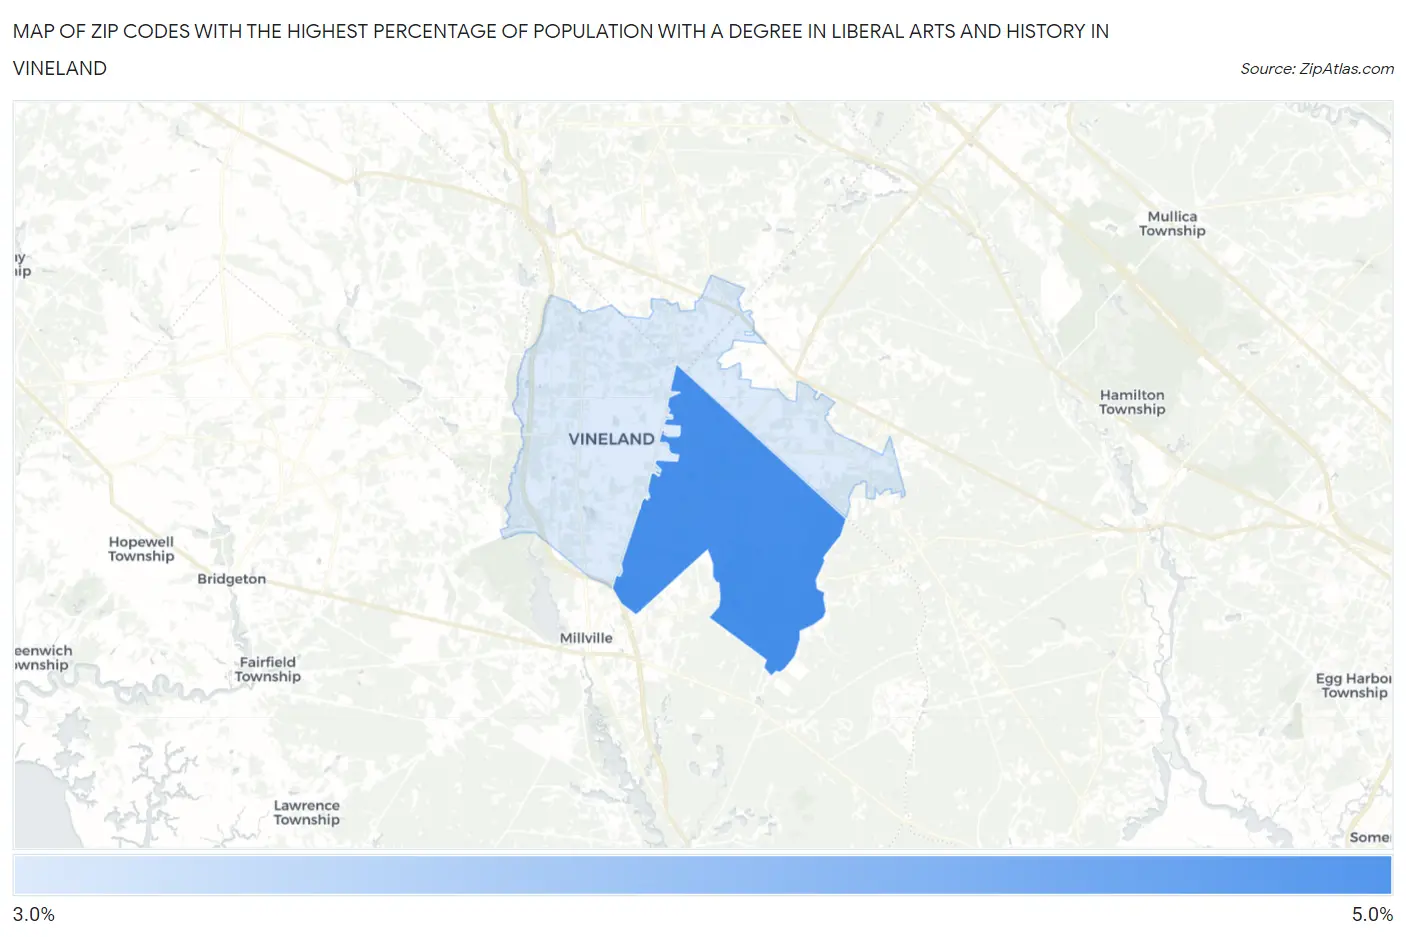
Map of Zip Codes with the Highest Percentage of Population with a Degree in Liberal Arts and History in Vineland
0.0%
5.0%
Zip Codes with the Highest Percentage of Population with a Degree in Liberal Arts and History in Vineland, NJ
| Zip Code | % Graduates | vs State | vs National | |
| 1. | 08361 | 4.6% | 4.6%(+0.018)#248 | 4.9%(-0.285)#12,675 |
| 2. | 08360 | 3.1% | 4.6%(-1.46)#401 | 4.9%(-1.76)#17,975 |
1
Common Questions
What are the Top Zip Codes with the Highest Percentage of Population with a Degree in Liberal Arts and History in Vineland, NJ?
Top Zip Codes with the Highest Percentage of Population with a Degree in Liberal Arts and History in Vineland, NJ are:
What zip code has the Highest Percentage of Population with a Degree in Liberal Arts and History in Vineland, NJ?
08361 has the Highest Percentage of Population with a Degree in Liberal Arts and History in Vineland, NJ with 4.6%.
What is the Percentage of Population with a Degree in Liberal Arts and History in Vineland, NJ?
Percentage of Population with a Degree in Liberal Arts and History in Vineland is 3.9%.
What is the Percentage of Population with a Degree in Liberal Arts and History in New Jersey?
Percentage of Population with a Degree in Liberal Arts and History in New Jersey is 4.6%.
What is the Percentage of Population with a Degree in Liberal Arts and History in the United States?
Percentage of Population with a Degree in Liberal Arts and History in the United States is 4.9%.