Zip Codes with the Highest Percentage of Population Employed in Arts, Media & Entertainment in Vineland, NJ
RELATED REPORTS & OPTIONS
Arts, Media & Entertainment
Vineland
Compare Zip Codes
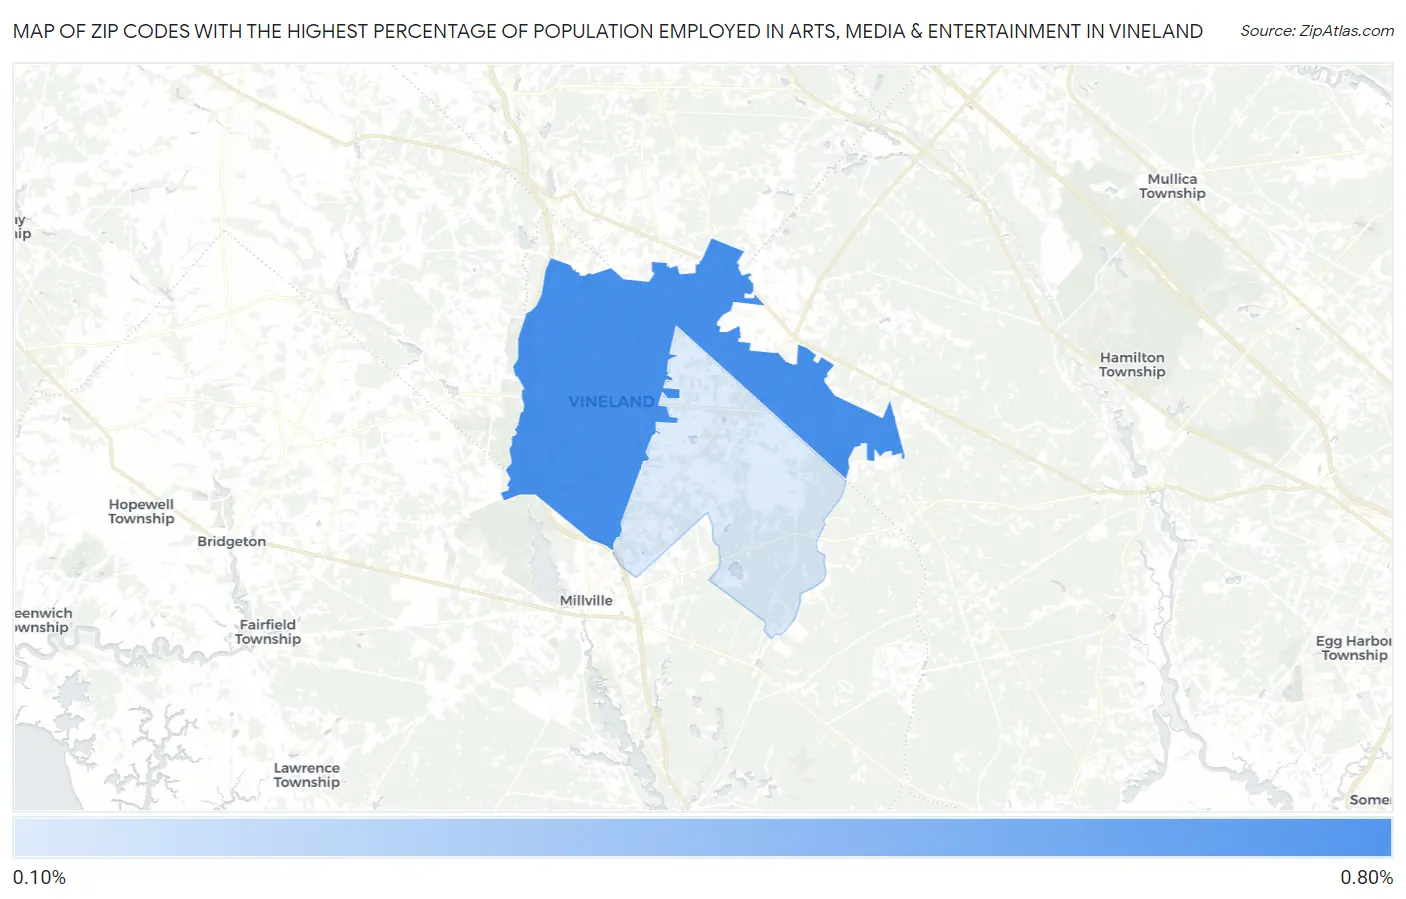
Map of Zip Codes with the Highest Percentage of Population Employed in Arts, Media & Entertainment in Vineland
0.0%
0.80%
Zip Codes with the Highest Percentage of Population Employed in Arts, Media & Entertainment in Vineland, NJ
| Zip Code | % Employed | vs State | vs National | |
| 1. | 08360 | 0.66% | 2.1%(-1.43)#483 | 2.1%(-1.40)#17,558 |
| 2. | 08361 | 0.18% | 2.1%(-1.92)#518 | 2.1%(-1.89)#21,105 |
1
Common Questions
What are the Top Zip Codes with the Highest Percentage of Population Employed in Arts, Media & Entertainment in Vineland, NJ?
Top Zip Codes with the Highest Percentage of Population Employed in Arts, Media & Entertainment in Vineland, NJ are:
What zip code has the Highest Percentage of Population Employed in Arts, Media & Entertainment in Vineland, NJ?
08360 has the Highest Percentage of Population Employed in Arts, Media & Entertainment in Vineland, NJ with 0.66%.
What is the Percentage of Population Employed in Arts, Media & Entertainment in Vineland, NJ?
Percentage of Population Employed in Arts, Media & Entertainment in Vineland is 0.47%.
What is the Percentage of Population Employed in Arts, Media & Entertainment in New Jersey?
Percentage of Population Employed in Arts, Media & Entertainment in New Jersey is 2.1%.
What is the Percentage of Population Employed in Arts, Media & Entertainment in the United States?
Percentage of Population Employed in Arts, Media & Entertainment in the United States is 2.1%.