Zip Codes with the Highest Percentage of Households with Income Above $200,000 in Vineland, NJ
RELATED REPORTS & OPTIONS
Household Income | $200k+
Vineland
Compare Zip Codes
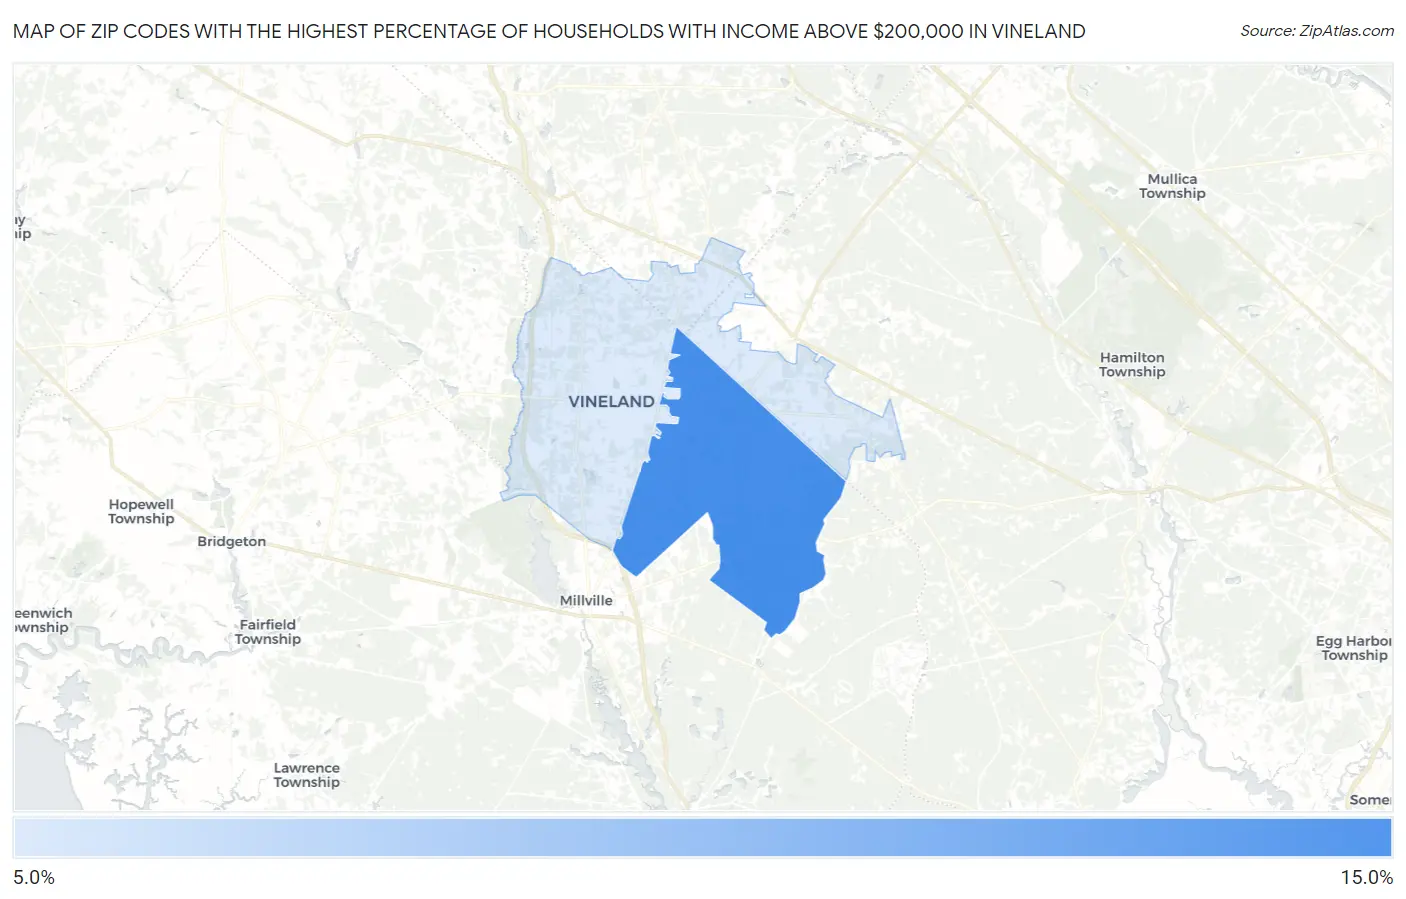
Map of Zip Codes with the Highest Percentage of Households with Income Above $200,000 in Vineland
0.0%
15.0%
Zip Codes with the Highest Percentage of Households with Income Above $200,000 in Vineland, NJ
| Zip Code | Households with Income > $200k | vs State | vs National | |
| 1. | 08361 | 10.5% | 19.2%(-8.70)#432 | 11.4%(-0.900)#7,789 |
| 2. | 08360 | 5.1% | 19.2%(-14.1)#517 | 11.4%(-6.30)#15,296 |
1
Common Questions
What are the Top Zip Codes with the Highest Percentage of Households with Income Above $200,000 in Vineland, NJ?
Top Zip Codes with the Highest Percentage of Households with Income Above $200,000 in Vineland, NJ are:
What zip code has the Highest Percentage of Households with Income Above $200,000 in Vineland, NJ?
08361 has the Highest Percentage of Households with Income Above $200,000 in Vineland, NJ with 10.5%.
What is the Percentage of Households with Income Above $200,000 in Vineland, NJ?
Percentage of Households with Income Above $200,000 in Vineland is 6.9%.
What is the Percentage of Households with Income Above $200,000 in New Jersey?
Percentage of Households with Income Above $200,000 in New Jersey is 19.2%.
What is the Percentage of Households with Income Above $200,000 in the United States?
Percentage of Households with Income Above $200,000 in the United States is 11.4%.