Zip Codes with the Highest Percentage of Population Employed in Administrative & Support Services in Vineland, NJ
RELATED REPORTS & OPTIONS
Administrative & Support Services
Vineland
Compare Zip Codes
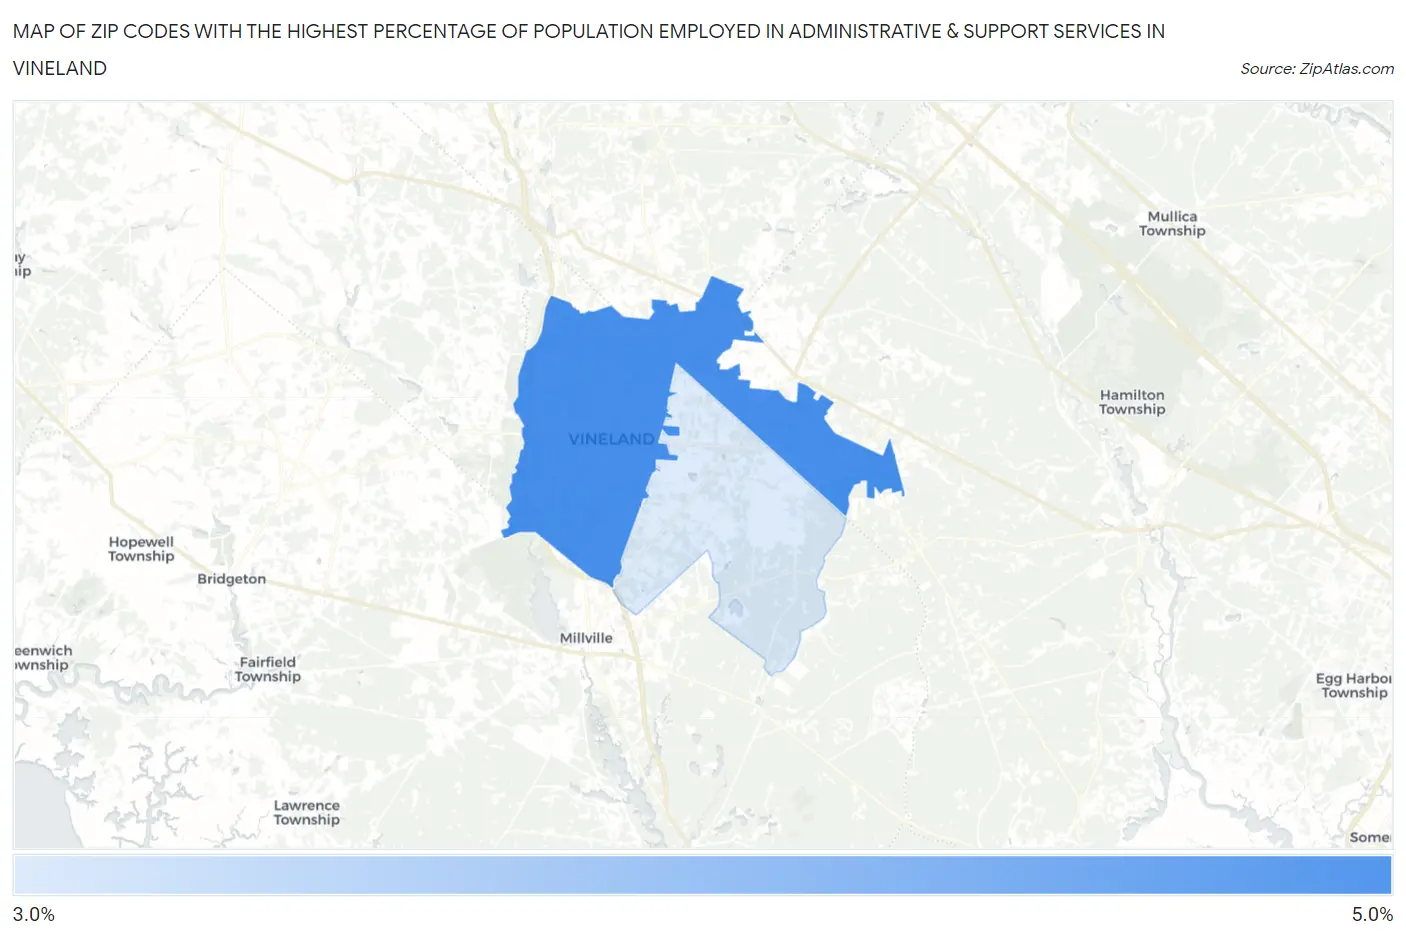
Map of Zip Codes with the Highest Percentage of Population Employed in Administrative & Support Services in Vineland
0.0%
5.0%
Zip Codes with the Highest Percentage of Population Employed in Administrative & Support Services in Vineland, NJ
| Zip Code | % Employed | vs State | vs National | |
| 1. | 08360 | 4.1% | 3.9%(+0.195)#177 | 4.1%(-0.006)#10,066 |
| 2. | 08361 | 3.5% | 3.9%(-0.493)#256 | 4.1%(-0.694)#13,181 |
1
Common Questions
What are the Top Zip Codes with the Highest Percentage of Population Employed in Administrative & Support Services in Vineland, NJ?
Top Zip Codes with the Highest Percentage of Population Employed in Administrative & Support Services in Vineland, NJ are:
What zip code has the Highest Percentage of Population Employed in Administrative & Support Services in Vineland, NJ?
08360 has the Highest Percentage of Population Employed in Administrative & Support Services in Vineland, NJ with 4.1%.
What is the Percentage of Population Employed in Administrative & Support Services in Vineland, NJ?
Percentage of Population Employed in Administrative & Support Services in Vineland is 4.0%.
What is the Percentage of Population Employed in Administrative & Support Services in New Jersey?
Percentage of Population Employed in Administrative & Support Services in New Jersey is 3.9%.
What is the Percentage of Population Employed in Administrative & Support Services in the United States?
Percentage of Population Employed in Administrative & Support Services in the United States is 4.1%.