Zip Codes with the Highest Percentage of Population Employed in Food Preparation & Serving in Toms River, NJ
RELATED REPORTS & OPTIONS
Food Preparation & Serving
Toms River
Compare Zip Codes
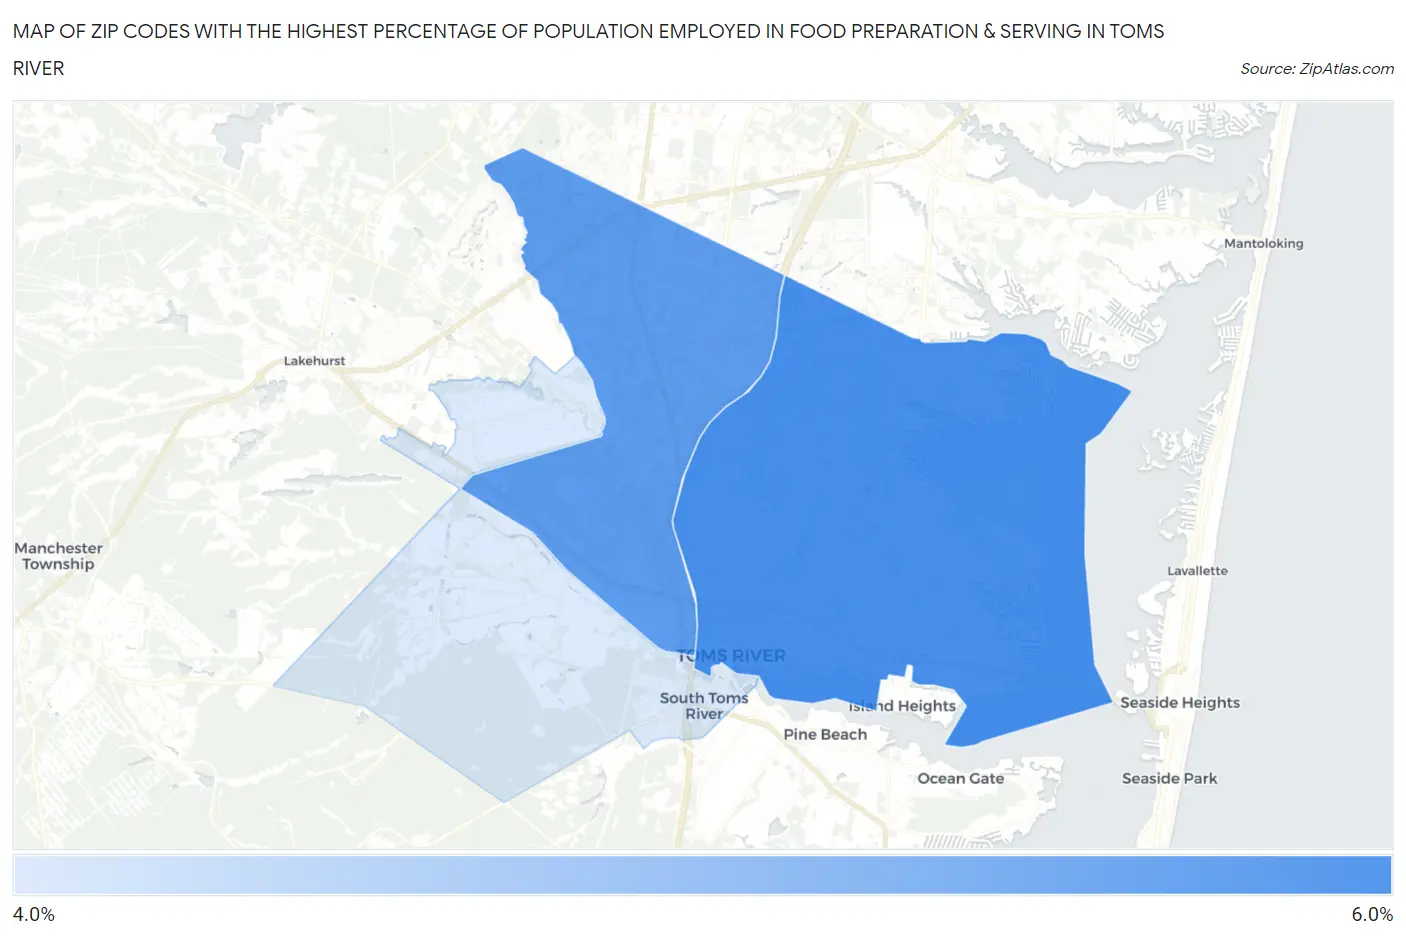
Map of Zip Codes with the Highest Percentage of Population Employed in Food Preparation & Serving in Toms River
0.0%
6.0%
Zip Codes with the Highest Percentage of Population Employed in Food Preparation & Serving in Toms River, NJ
| Zip Code | % Employed | vs State | vs National | |
| 1. | 08753 | 5.8% | 4.0%(+1.82)#95 | 5.3%(+0.499)#10,071 |
| 2. | 08755 | 5.7% | 4.0%(+1.70)#99 | 5.3%(+0.380)#10,469 |
| 3. | 08757 | 4.8% | 4.0%(+0.810)#148 | 5.3%(-0.513)#13,852 |
1
Common Questions
What are the Top Zip Codes with the Highest Percentage of Population Employed in Food Preparation & Serving in Toms River, NJ?
Top Zip Codes with the Highest Percentage of Population Employed in Food Preparation & Serving in Toms River, NJ are:
What zip code has the Highest Percentage of Population Employed in Food Preparation & Serving in Toms River, NJ?
08753 has the Highest Percentage of Population Employed in Food Preparation & Serving in Toms River, NJ with 5.8%.
What is the Percentage of Population Employed in Food Preparation & Serving in Toms River, NJ?
Percentage of Population Employed in Food Preparation & Serving in Toms River is 5.8%.
What is the Percentage of Population Employed in Food Preparation & Serving in New Jersey?
Percentage of Population Employed in Food Preparation & Serving in New Jersey is 4.0%.
What is the Percentage of Population Employed in Food Preparation & Serving in the United States?
Percentage of Population Employed in Food Preparation & Serving in the United States is 5.3%.