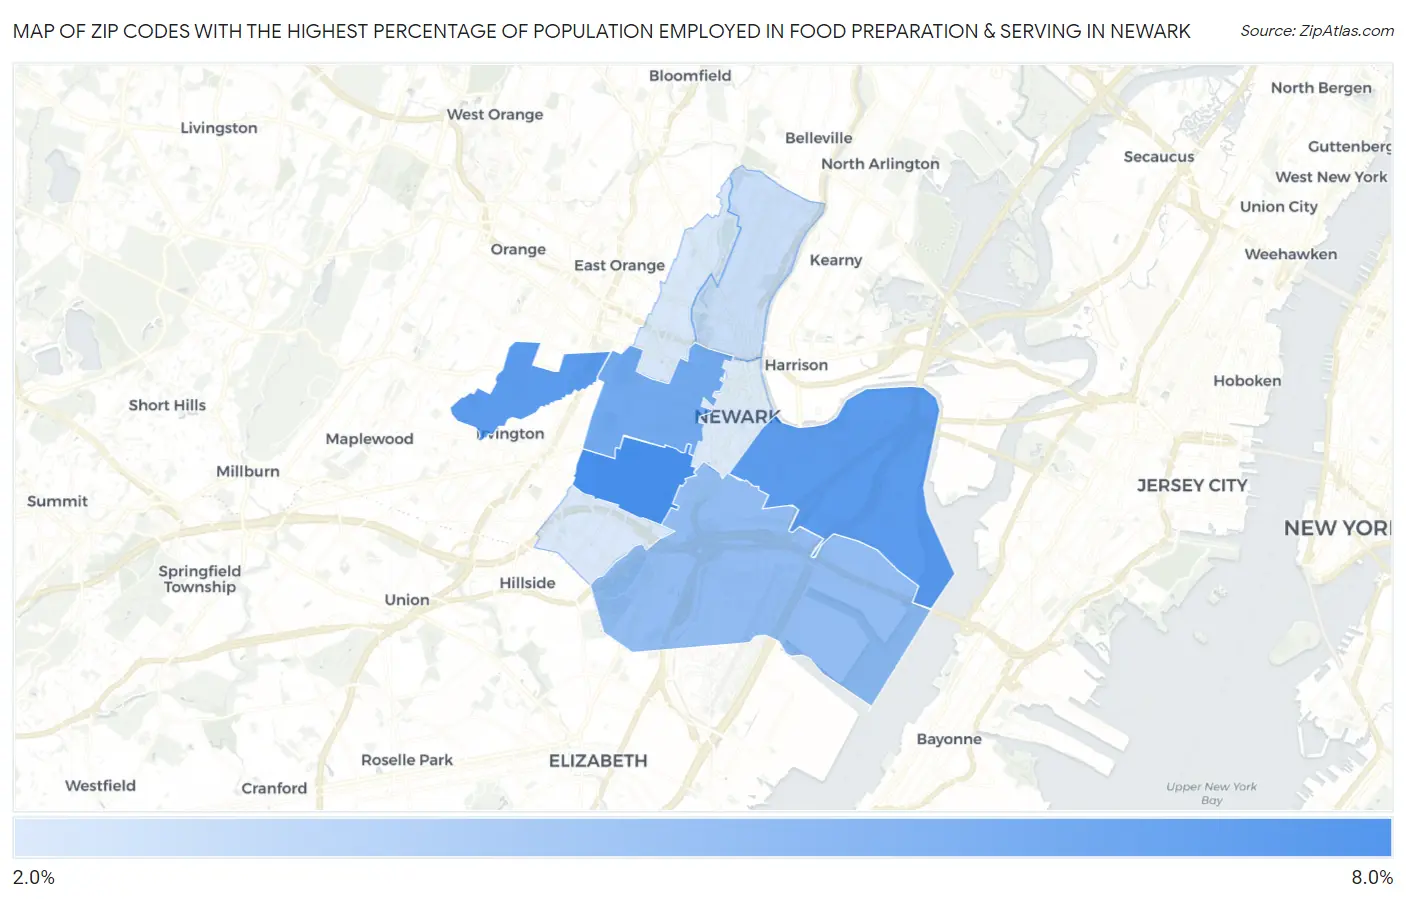
Zip Codes with the Highest Percentage of Population Employed in Food Preparation & Serving in Newark, NJ
RELATED REPORTS & OPTIONS
Food Preparation & Serving
Newark
Compare Zip Codes
Map of Zip Codes with the Highest Percentage of Population Employed in Food Preparation & Serving in Newark
0.0%
8.0%
Zip Codes with the Highest Percentage of Population Employed in Food Preparation & Serving in Newark, NJ
| Zip Code | % Employed | vs State | vs National | |
| 1. | 07108 | 7.0% | 4.0%(+3.00)#55 | 5.3%(+1.68)#6,652 |
| 2. | 07105 | 6.5% | 4.0%(+2.49)#68 | 5.3%(+1.17)#7,989 |
| 3. | 07106 | 6.4% | 4.0%(+2.42)#71 | 5.3%(+1.10)#8,172 |
| 4. | 07103 | 5.8% | 4.0%(+1.80)#97 | 5.3%(+0.472)#10,157 |
| 5. | 07114 | 4.9% | 4.0%(+0.933)#140 | 5.3%(-0.391)#13,375 |
| 6. | 07104 | 3.4% | 4.0%(-0.518)#272 | 5.3%(-1.84)#19,434 |
| 7. | 07107 | 3.0% | 4.0%(-0.941)#334 | 5.3%(-2.26)#21,180 |
| 8. | 07112 | 3.0% | 4.0%(-0.991)#337 | 5.3%(-2.31)#21,361 |
| 9. | 07102 | 2.9% | 4.0%(-1.08)#351 | 5.3%(-2.40)#21,717 |
1
Common Questions
What are the Top 5 Zip Codes with the Highest Percentage of Population Employed in Food Preparation & Serving in Newark, NJ?
Top 5 Zip Codes with the Highest Percentage of Population Employed in Food Preparation & Serving in Newark, NJ are:
What zip code has the Highest Percentage of Population Employed in Food Preparation & Serving in Newark, NJ?
07108 has the Highest Percentage of Population Employed in Food Preparation & Serving in Newark, NJ with 7.0%.
What is the Percentage of Population Employed in Food Preparation & Serving in Newark, NJ?
Percentage of Population Employed in Food Preparation & Serving in Newark is 4.9%.
What is the Percentage of Population Employed in Food Preparation & Serving in New Jersey?
Percentage of Population Employed in Food Preparation & Serving in New Jersey is 4.0%.
What is the Percentage of Population Employed in Food Preparation & Serving in the United States?
Percentage of Population Employed in Food Preparation & Serving in the United States is 5.3%.