Cities with the Lowest Percentage of Renter-Occupied Units in New Hampshire
RELATED REPORTS & OPTIONS
Lowest Renter-Occupied
New Hampshire
Compare Cities
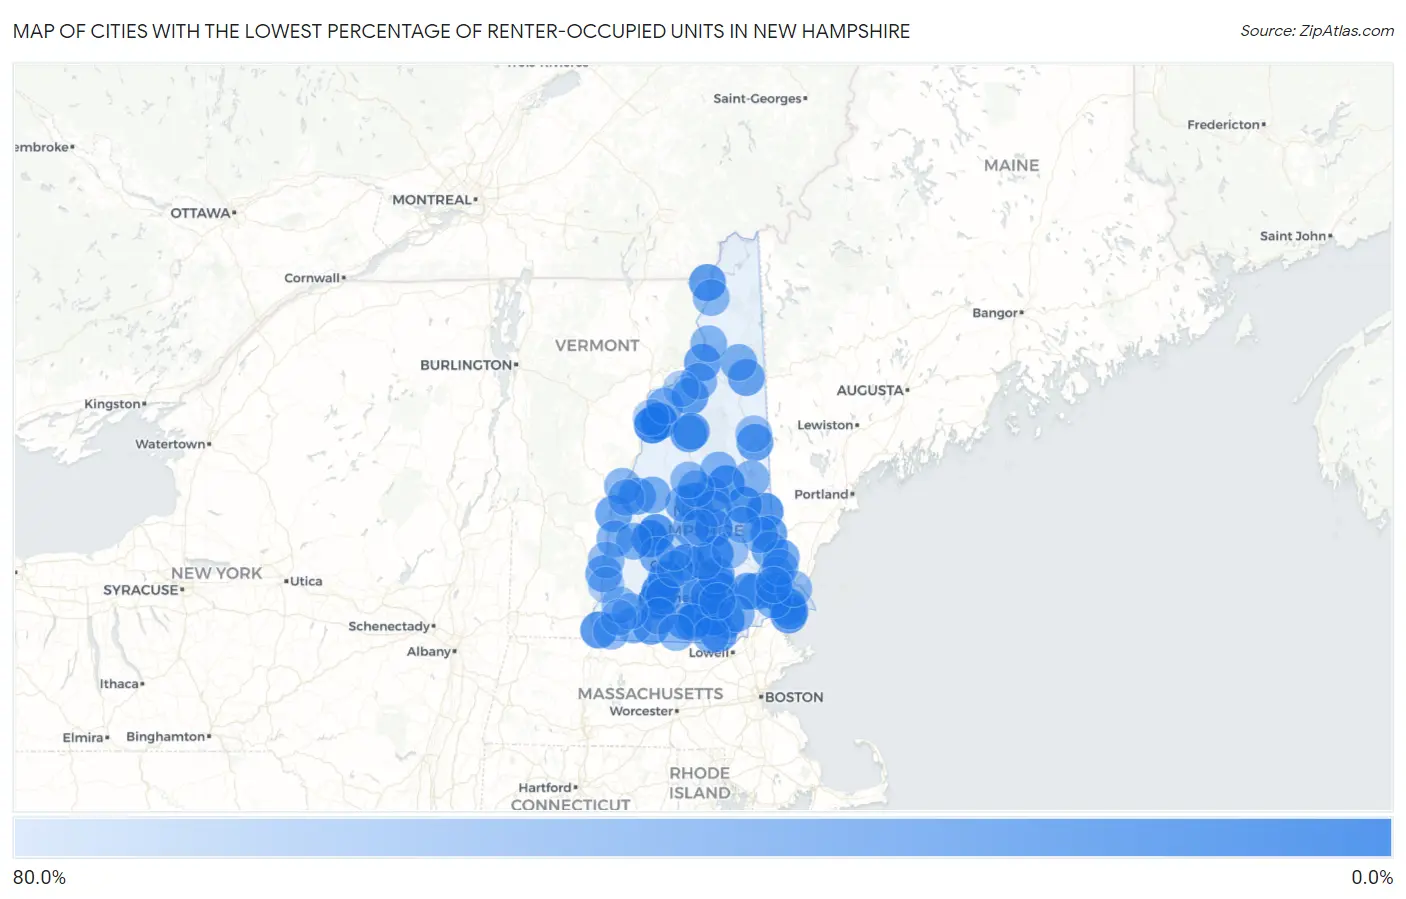
Map of Cities with the Lowest Percentage of Renter-Occupied Units in New Hampshire
80.0%
0.0%
Cities with the Lowest Percentage of Renter-Occupied Units in New Hampshire
| City | % Renter-Occupied | vs State | vs National | |
| 1. | Mountain Lakes | 2.9% | 27.7%(-24.8)#1 | 35.2%(-32.3)#479 |
| 2. | Amherst | 8.7% | 27.7%(-19.0)#2 | 35.2%(-26.5)#2,866 |
| 3. | North Haverhill | 9.6% | 27.7%(-18.1)#3 | 35.2%(-25.6)#3,387 |
| 4. | Goffstown | 11.5% | 27.7%(-16.2)#4 | 35.2%(-23.7)#4,384 |
| 5. | Hancock | 11.7% | 27.7%(-16.0)#5 | 35.2%(-23.5)#4,519 |
| 6. | Newfields | 12.1% | 27.7%(-15.6)#6 | 35.2%(-23.0)#4,760 |
| 7. | Contoocook | 13.4% | 27.7%(-14.4)#7 | 35.2%(-21.8)#5,516 |
| 8. | Blodgett Landing | 14.3% | 27.7%(-13.4)#8 | 35.2%(-20.9)#6,110 |
| 9. | Belmont | 14.4% | 27.7%(-13.3)#9 | 35.2%(-20.8)#6,195 |
| 10. | South Hooksett | 14.9% | 27.7%(-12.8)#10 | 35.2%(-20.2)#6,513 |
| 11. | Suissevale | 16.6% | 27.7%(-11.2)#11 | 35.2%(-18.6)#7,486 |
| 12. | Loudon | 17.0% | 27.7%(-10.7)#12 | 35.2%(-18.2)#7,808 |
| 13. | Londonderry | 17.7% | 27.7%(-10.00)#13 | 35.2%(-17.4)#8,319 |
| 14. | Sanbornville | 18.2% | 27.7%(-9.49)#14 | 35.2%(-16.9)#8,654 |
| 15. | Wolfeboro | 18.2% | 27.7%(-9.48)#15 | 35.2%(-16.9)#8,658 |
| 16. | Hinsdale | 19.6% | 27.7%(-8.16)#16 | 35.2%(-15.6)#9,505 |
| 17. | Antrim | 20.1% | 27.7%(-7.65)#17 | 35.2%(-15.1)#9,878 |
| 18. | New London | 20.7% | 27.7%(-7.08)#18 | 35.2%(-14.5)#10,225 |
| 19. | New Hampton | 21.0% | 27.7%(-6.74)#19 | 35.2%(-14.2)#10,443 |
| 20. | New Boston | 21.9% | 27.7%(-5.81)#20 | 35.2%(-13.3)#11,079 |
| 21. | Epping | 22.2% | 27.7%(-5.58)#21 | 35.2%(-13.0)#11,233 |
| 22. | Hillsborough | 22.5% | 27.7%(-5.23)#22 | 35.2%(-12.7)#11,481 |
| 23. | Hampton | 22.8% | 27.7%(-4.89)#23 | 35.2%(-12.3)#11,688 |
| 24. | Seabrook Beach | 23.4% | 27.7%(-4.29)#24 | 35.2%(-11.7)#12,104 |
| 25. | West Stewartstown | 24.0% | 27.7%(-3.76)#25 | 35.2%(-11.2)#12,482 |
| 26. | Hudson | 24.1% | 27.7%(-3.63)#26 | 35.2%(-11.1)#12,572 |
| 27. | Klondike Corner | 24.7% | 27.7%(-3.03)#27 | 35.2%(-10.5)#12,967 |
| 28. | Bethlehem | 25.0% | 27.7%(-2.73)#28 | 35.2%(-10.2)#13,147 |
| 29. | North Woodstock | 25.4% | 27.7%(-2.32)#29 | 35.2%(-9.77)#13,447 |
| 30. | Milton | 25.6% | 27.7%(-2.12)#30 | 35.2%(-9.57)#13,570 |
| 31. | Conway | 25.8% | 27.7%(-1.94)#31 | 35.2%(-9.39)#13,671 |
| 32. | Wilton | 27.1% | 27.7%(-0.661)#32 | 35.2%(-8.11)#14,549 |
| 33. | Lancaster | 27.4% | 27.7%(-0.290)#33 | 35.2%(-7.74)#14,811 |
| 34. | Jaffrey | 28.3% | 27.7%(+0.543)#34 | 35.2%(-6.91)#15,361 |
| 35. | Plainfield | 28.9% | 27.7%(+1.18)#35 | 35.2%(-6.27)#15,783 |
| 36. | Gorham | 29.5% | 27.7%(+1.75)#36 | 35.2%(-5.70)#16,200 |
| 37. | Raymond | 29.9% | 27.7%(+2.12)#37 | 35.2%(-5.33)#16,438 |
| 38. | Lincoln | 30.1% | 27.7%(+2.33)#38 | 35.2%(-5.12)#16,591 |
| 39. | East Merrimack | 30.8% | 27.7%(+3.04)#39 | 35.2%(-4.41)#17,059 |
| 40. | North Walpole | 33.1% | 27.7%(+5.32)#40 | 35.2%(-2.13)#18,401 |
| 41. | Bennington | 33.1% | 27.7%(+5.33)#41 | 35.2%(-2.13)#18,410 |
| 42. | Hooksett | 33.6% | 27.7%(+5.86)#42 | 35.2%(-1.60)#18,765 |
| 43. | Enfield | 33.9% | 27.7%(+6.16)#43 | 35.2%(-1.29)#18,909 |
| 44. | Rochester | 34.0% | 27.7%(+6.30)#44 | 35.2%(-1.15)#18,989 |
| 45. | Bradford | 34.3% | 27.7%(+6.61)#45 | 35.2%(-0.846)#19,156 |
| 46. | Lisbon | 34.7% | 27.7%(+6.96)#46 | 35.2%(-0.495)#19,339 |
| 47. | Somersworth | 35.2% | 27.7%(+7.51)#47 | 35.2%(+0.061)#19,648 |
| 48. | Pinardville | 35.7% | 27.7%(+7.94)#48 | 35.2%(+0.493)#19,883 |
| 49. | Suncook | 35.8% | 27.7%(+8.07)#49 | 35.2%(+0.613)#19,952 |
| 50. | Hampton Beach | 36.0% | 27.7%(+8.25)#50 | 35.2%(+0.798)#20,044 |
| 51. | Franklin | 37.9% | 27.7%(+10.2)#51 | 35.2%(+2.72)#21,129 |
| 52. | Bristol | 38.3% | 27.7%(+10.6)#52 | 35.2%(+3.14)#21,337 |
| 53. | Canaan | 39.0% | 27.7%(+11.3)#53 | 35.2%(+3.84)#21,642 |
| 54. | Exeter | 40.6% | 27.7%(+12.8)#54 | 35.2%(+5.39)#22,404 |
| 55. | Berlin | 40.6% | 27.7%(+12.9)#55 | 35.2%(+5.42)#22,419 |
| 56. | Claremont | 40.8% | 27.7%(+13.0)#56 | 35.2%(+5.58)#22,499 |
| 57. | Meredith | 41.1% | 27.7%(+13.4)#57 | 35.2%(+5.91)#22,632 |
| 58. | Laconia | 41.2% | 27.7%(+13.5)#58 | 35.2%(+6.02)#22,685 |
| 59. | Center Sandwich | 41.3% | 27.7%(+13.6)#59 | 35.2%(+6.15)#22,729 |
| 60. | Derry | 42.0% | 27.7%(+14.2)#60 | 35.2%(+6.77)#22,996 |
| 61. | Concord | 42.8% | 27.7%(+15.0)#61 | 35.2%(+7.59)#23,344 |
| 62. | Newport | 42.9% | 27.7%(+15.2)#62 | 35.2%(+7.74)#23,414 |
| 63. | Whitefield | 43.4% | 27.7%(+15.7)#63 | 35.2%(+8.24)#23,607 |
| 64. | Milford | 43.5% | 27.7%(+15.8)#64 | 35.2%(+8.30)#23,631 |
| 65. | Hanover | 43.7% | 27.7%(+16.0)#65 | 35.2%(+8.50)#23,717 |
| 66. | Center Ossipee | 43.9% | 27.7%(+16.2)#66 | 35.2%(+8.71)#23,806 |
| 67. | Groveton | 44.2% | 27.7%(+16.5)#67 | 35.2%(+9.02)#23,917 |
| 68. | Nashua | 44.5% | 27.7%(+16.7)#68 | 35.2%(+9.27)#24,032 |
| 69. | Troy | 44.5% | 27.7%(+16.8)#69 | 35.2%(+9.35)#24,050 |
| 70. | Ashland | 44.6% | 27.7%(+16.9)#70 | 35.2%(+9.46)#24,089 |
| 71. | Colebrook | 45.4% | 27.7%(+17.7)#71 | 35.2%(+10.2)#24,373 |
| 72. | Durham | 45.9% | 27.7%(+18.1)#72 | 35.2%(+10.7)#24,514 |
| 73. | Peterborough | 46.0% | 27.7%(+18.2)#73 | 35.2%(+10.8)#24,549 |
| 74. | Winchester | 47.0% | 27.7%(+19.3)#74 | 35.2%(+11.9)#24,898 |
| 75. | Charlestown | 47.2% | 27.7%(+19.4)#75 | 35.2%(+12.0)#24,944 |
| 76. | Farmington | 47.2% | 27.7%(+19.5)#76 | 35.2%(+12.0)#24,948 |
| 77. | Plymouth | 47.6% | 27.7%(+19.8)#77 | 35.2%(+12.4)#25,082 |
| 78. | Lebanon | 47.7% | 27.7%(+20.0)#78 | 35.2%(+12.5)#25,121 |
| 79. | Portsmouth | 47.8% | 27.7%(+20.1)#79 | 35.2%(+12.6)#25,169 |
| 80. | Dover | 48.1% | 27.7%(+20.3)#80 | 35.2%(+12.9)#25,244 |
| 81. | Greenville | 48.4% | 27.7%(+20.7)#81 | 35.2%(+13.2)#25,358 |
| 82. | Keene | 48.6% | 27.7%(+20.8)#82 | 35.2%(+13.4)#25,399 |
| 83. | Manchester | 51.8% | 27.7%(+24.1)#83 | 35.2%(+16.6)#26,281 |
| 84. | Henniker | 51.8% | 27.7%(+24.1)#84 | 35.2%(+16.7)#26,288 |
| 85. | North Conway | 52.3% | 27.7%(+24.6)#85 | 35.2%(+17.1)#26,381 |
| 86. | Marlborough | 52.8% | 27.7%(+25.1)#86 | 35.2%(+17.6)#26,484 |
| 87. | Pittsfield | 53.2% | 27.7%(+25.5)#87 | 35.2%(+18.1)#26,580 |
| 88. | Alton | 53.5% | 27.7%(+25.8)#88 | 35.2%(+18.4)#26,641 |
| 89. | Tilton Northfield | 55.4% | 27.7%(+27.6)#89 | 35.2%(+20.2)#26,936 |
| 90. | Newmarket | 57.2% | 27.7%(+29.5)#90 | 35.2%(+22.0)#27,201 |
| 91. | Littleton | 59.5% | 27.7%(+31.8)#91 | 35.2%(+24.3)#27,477 |
| 92. | Woodsville | 59.6% | 27.7%(+31.9)#92 | 35.2%(+24.4)#27,488 |
| 93. | Walpole | 60.2% | 27.7%(+32.5)#93 | 35.2%(+25.0)#27,560 |
| 94. | West Swanzey | 61.8% | 27.7%(+34.0)#94 | 35.2%(+26.6)#27,702 |
| 95. | Warner | 71.4% | 27.7%(+43.7)#95 | 35.2%(+36.2)#28,253 |
1
Common Questions
What are the Top 10 Cities with the Lowest Percentage of Renter-Occupied Units in New Hampshire?
Top 10 Cities with the Lowest Percentage of Renter-Occupied Units in New Hampshire are:
#1
0.0%
#2
0.0%
#3
0.0%
#4
0.0%
#5
2.9%
#6
8.7%
#7
9.6%
#8
11.5%
#9
11.7%
#10
12.1%
What city has the Lowest Percentage of Renter-Occupied Units in New Hampshire?
Mountain Lakes has the Lowest Percentage of Renter-Occupied Units in New Hampshire with 2.9%.
What is the Percentage of Renter-Occupied Units in the State of New Hampshire?
Percentage of Renter-Occupied Units in New Hampshire is 27.7%.
What is the Percentage of Renter-Occupied Units in the United States?
Percentage of Renter-Occupied Units in the United States is 35.2%.