Jackson, NE
Jackson Map
Jackson Overview
258
TOTAL POPULATION
136
MALE POPULATION
122
FEMALE POPULATION
111.48
MALES / 100 FEMALES
89.71
FEMALES / 100 MALES
27.7
MEDIAN AGE
4.7
AVG FAMILY SIZE
3.6
AVG HOUSEHOLD SIZE
$24,169
PER CAPITA INCOME
$84,107
AVG FAMILY INCOME
$71,250
AVG HOUSEHOLD INCOME
15.4%
WAGE / INCOME GAP [ % ]
84.6¢/ $1
WAGE / INCOME GAP [ $ ]
0.39
INEQUALITY / GINI INDEX
107
LABOR FORCE [ PEOPLE ]
63.3%
PERCENT IN LABOR FORCE
7.5%
UNEMPLOYMENT RATE
Jackson Zip Codes
Jackson Area Codes
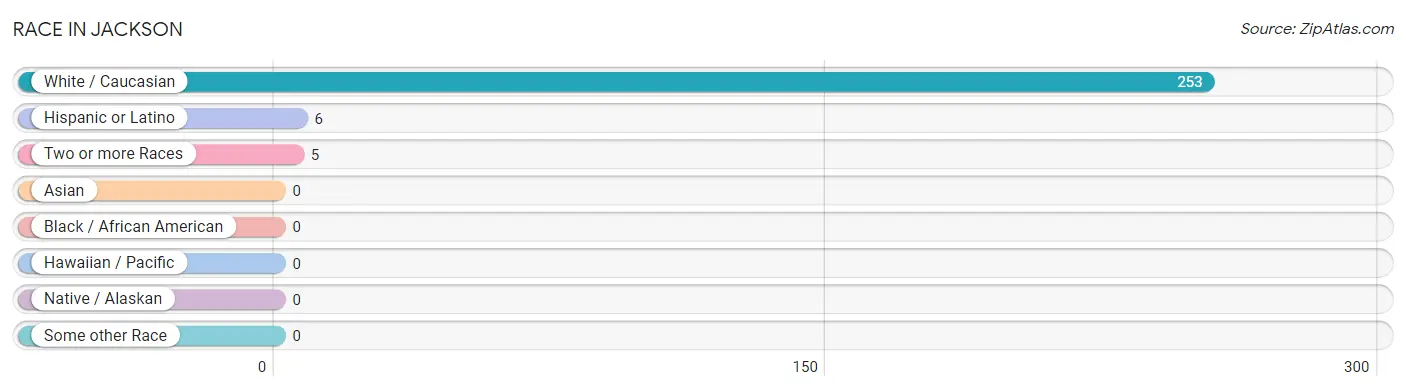
Race in Jackson
The most populous races in Jackson are White / Caucasian (253 | 98.1%), Hispanic or Latino (6 | 2.3%), and Two or more Races (5 | 1.9%).
| Race | # Population | % Population |
| Asian | 0 | 0.0% |
| Black / African American | 0 | 0.0% |
| Hawaiian / Pacific | 0 | 0.0% |
| Hispanic or Latino | 6 | 2.3% |
| Native / Alaskan | 0 | 0.0% |
| White / Caucasian | 253 | 98.1% |
| Two or more Races | 5 | 1.9% |
| Some other Race | 0 | 0.0% |
| Total | 258 | 100.0% |
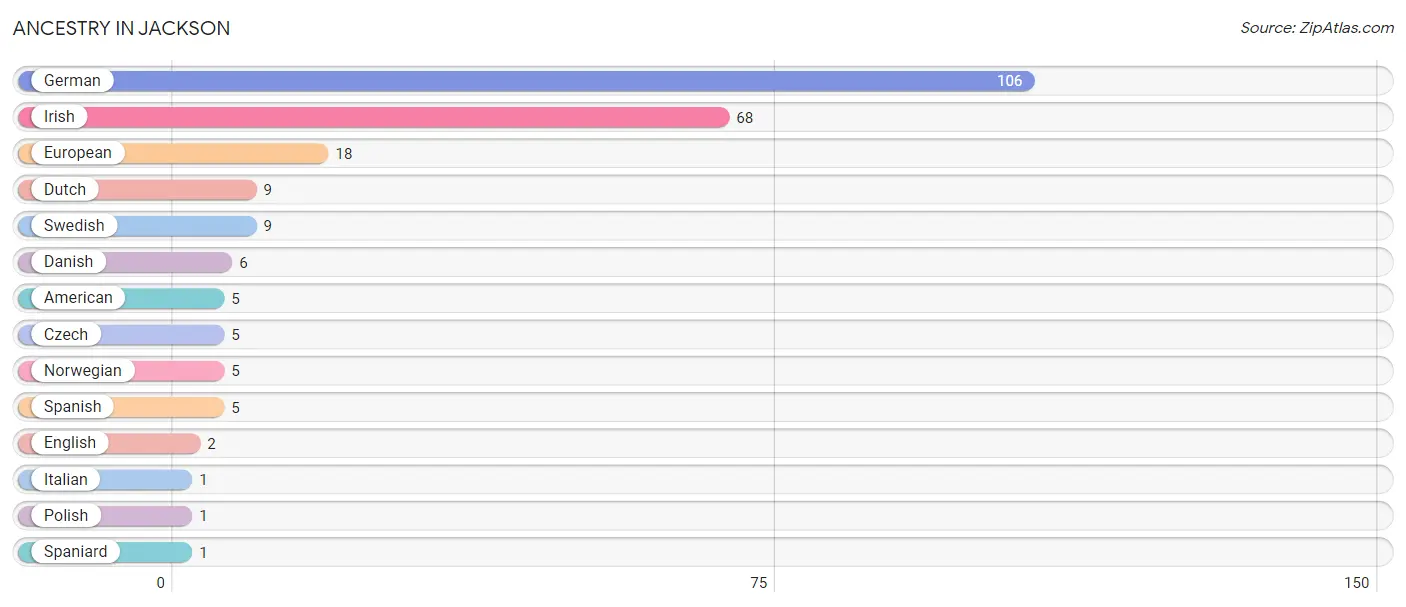
Ancestry in Jackson
The most populous ancestries reported in Jackson are German (106 | 41.1%), Irish (68 | 26.4%), European (18 | 7.0%), Dutch (9 | 3.5%), and Swedish (9 | 3.5%), together accounting for 81.4% of all Jackson residents.
| Ancestry | # Population | % Population |
| American | 5 | 1.9% |
| Czech | 5 | 1.9% |
| Danish | 6 | 2.3% |
| Dutch | 9 | 3.5% |
| English | 2 | 0.8% |
| European | 18 | 7.0% |
| German | 106 | 41.1% |
| Irish | 68 | 26.4% |
| Italian | 1 | 0.4% |
| Norwegian | 5 | 1.9% |
| Polish | 1 | 0.4% |
| Spaniard | 1 | 0.4% |
| Spanish | 5 | 1.9% |
| Swedish | 9 | 3.5% | View All 14 Rows |
Immigrants in Jackson

| Immigration Origin | # Population | % Population | View All 0 Rows |
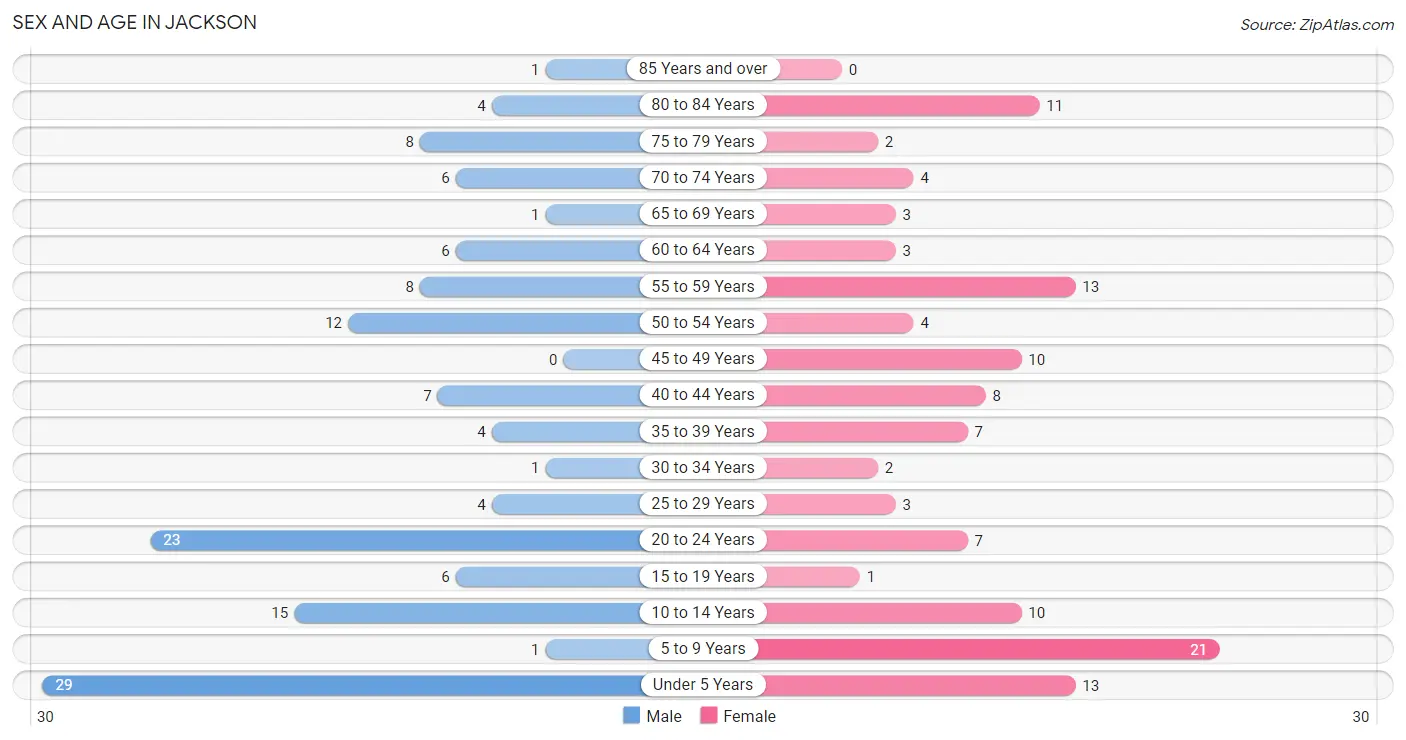
Sex and Age in Jackson
Sex and Age in Jackson
The most populous age groups in Jackson are Under 5 Years (29 | 21.3%) for men and 5 to 9 Years (21 | 17.2%) for women.
| Age Bracket | Male | Female |
| Under 5 Years | 29 (21.3%) | 13 (10.7%) |
| 5 to 9 Years | 1 (0.7%) | 21 (17.2%) |
| 10 to 14 Years | 15 (11.0%) | 10 (8.2%) |
| 15 to 19 Years | 6 (4.4%) | 1 (0.8%) |
| 20 to 24 Years | 23 (16.9%) | 7 (5.7%) |
| 25 to 29 Years | 4 (2.9%) | 3 (2.5%) |
| 30 to 34 Years | 1 (0.7%) | 2 (1.6%) |
| 35 to 39 Years | 4 (2.9%) | 7 (5.7%) |
| 40 to 44 Years | 7 (5.1%) | 8 (6.6%) |
| 45 to 49 Years | 0 (0.0%) | 10 (8.2%) |
| 50 to 54 Years | 12 (8.8%) | 4 (3.3%) |
| 55 to 59 Years | 8 (5.9%) | 13 (10.7%) |
| 60 to 64 Years | 6 (4.4%) | 3 (2.5%) |
| 65 to 69 Years | 1 (0.7%) | 3 (2.5%) |
| 70 to 74 Years | 6 (4.4%) | 4 (3.3%) |
| 75 to 79 Years | 8 (5.9%) | 2 (1.6%) |
| 80 to 84 Years | 4 (2.9%) | 11 (9.0%) |
| 85 Years and over | 1 (0.7%) | 0 (0.0%) |
| Total | 136 (100.0%) | 122 (100.0%) |
Families and Households in Jackson
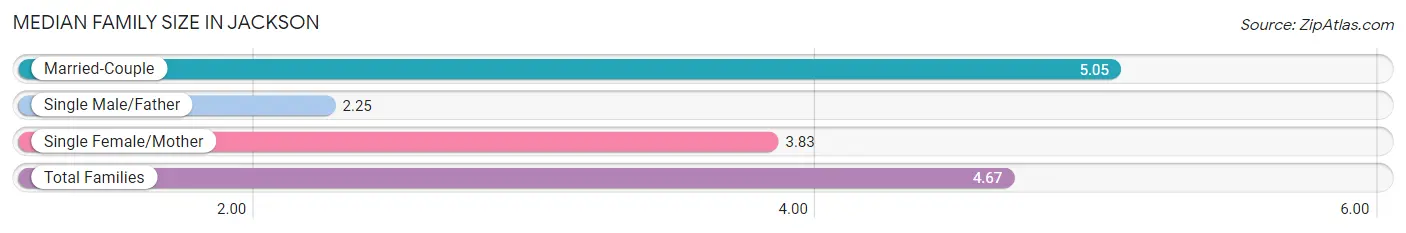
Median Family Size in Jackson
The median family size in Jackson is 4.67 persons per family, with married-couple families (39 | 79.6%) accounting for the largest median family size of 5.05 persons per family. On the other hand, single male/father families (4 | 8.2%) represent the smallest median family size with 2.25 persons per family.
| Family Type | # Families | Family Size |
| Married-Couple | 39 (79.6%) | 5.05 |
| Single Male/Father | 4 (8.2%) | 2.25 |
| Single Female/Mother | 6 (12.2%) | 3.83 |
| Total Families | 49 (100.0%) | 4.67 |
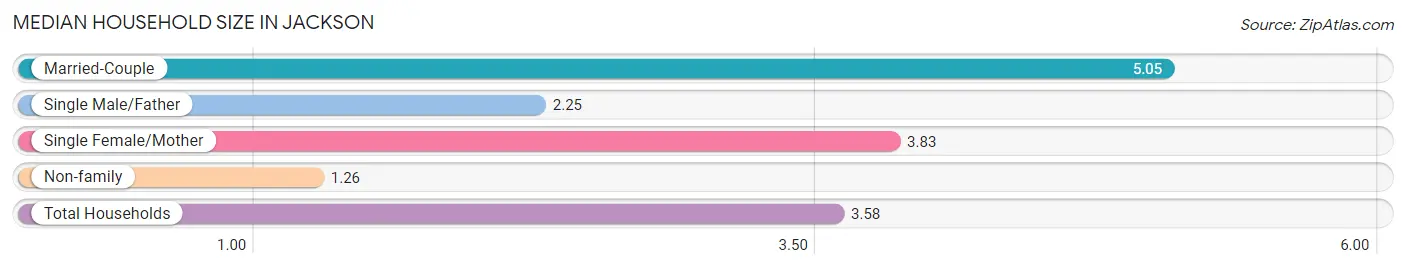
Median Household Size in Jackson
The median household size in Jackson is 3.58 persons per household, with married-couple households (39 | 54.2%) accounting for the largest median household size of 5.05 persons per household. non-family households (23 | 31.9%) represent the smallest median household size with 1.26 persons per household.
| Household Type | # Households | Household Size |
| Married-Couple | 39 (54.2%) | 5.05 |
| Single Male/Father | 4 (5.6%) | 2.25 |
| Single Female/Mother | 6 (8.3%) | 3.83 |
| Non-family | 23 (31.9%) | 1.26 |
| Total Households | 72 (100.0%) | 3.58 |
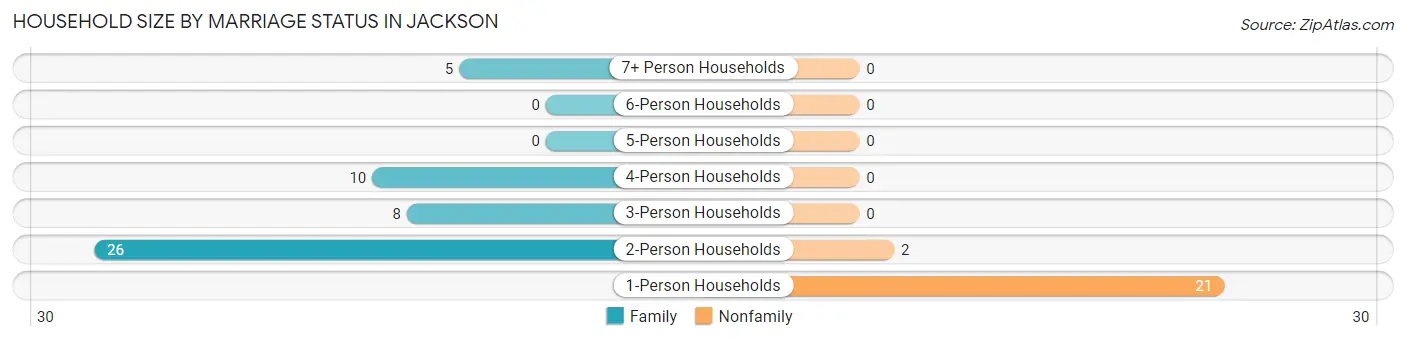
Household Size by Marriage Status in Jackson
Out of a total of 72 households in Jackson, 49 (68.1%) are family households, while 23 (31.9%) are nonfamily households. The most numerous type of family households are 2-person households, comprising 26, and the most common type of nonfamily households are 1-person households, comprising 21.
| Household Size | Family Households | Nonfamily Households |
| 1-Person Households | - | 21 (29.2%) |
| 2-Person Households | 26 (36.1%) | 2 (2.8%) |
| 3-Person Households | 8 (11.1%) | 0 (0.0%) |
| 4-Person Households | 10 (13.9%) | 0 (0.0%) |
| 5-Person Households | 0 (0.0%) | 0 (0.0%) |
| 6-Person Households | 0 (0.0%) | 0 (0.0%) |
| 7+ Person Households | 5 (6.9%) | 0 (0.0%) |
| Total | 49 (68.1%) | 23 (31.9%) |
Female Fertility in Jackson
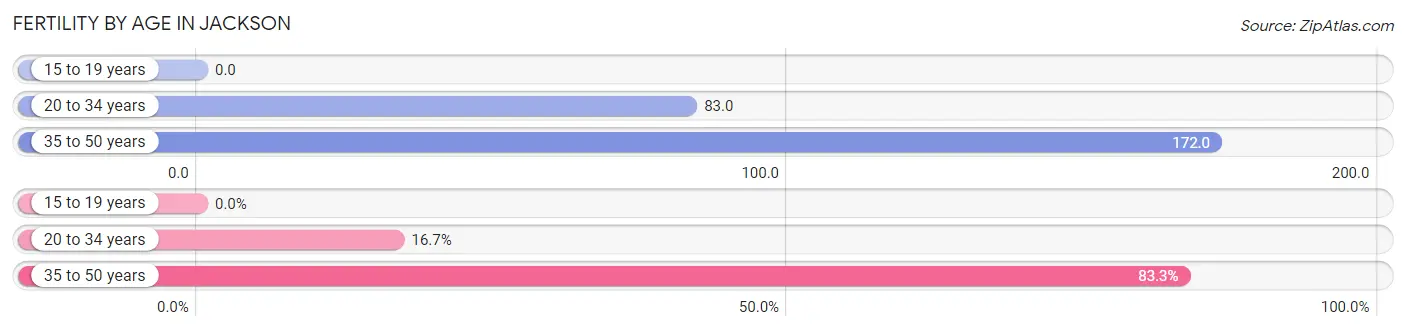
Fertility by Age in Jackson
Average fertility rate in Jackson is 143.0 births per 1,000 women. Women in the age bracket of 35 to 50 years have the highest fertility rate with 172.0 births per 1,000 women. Women in the age bracket of 35 to 50 years acount for 83.3% of all women with births.
| Age Bracket | Women with Births | Births / 1,000 Women |
| 15 to 19 years | 0 (0.0%) | 0.0 |
| 20 to 34 years | 1 (16.7%) | 83.0 |
| 35 to 50 years | 5 (83.3%) | 172.0 |
| Total | 6 (100.0%) | 143.0 |
Fertility by Age by Marriage Status in Jackson
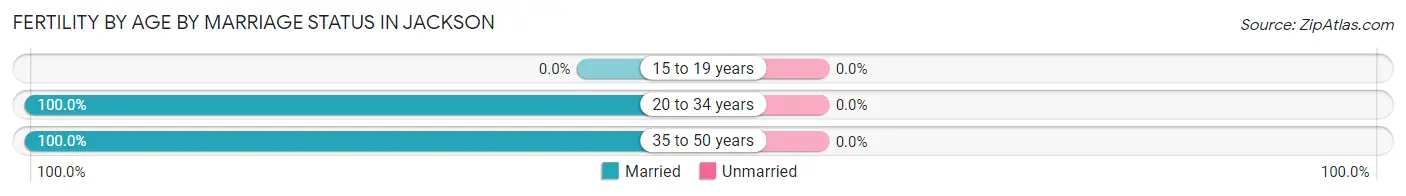
| Age Bracket | Married | Unmarried |
| 15 to 19 years | 0 (0.0%) | 0 (0.0%) |
| 20 to 34 years | 1 (100.0%) | 0 (0.0%) |
| 35 to 50 years | 5 (100.0%) | 0 (0.0%) |
| Total | 6 (100.0%) | 0 (0.0%) |
Fertility by Education in Jackson
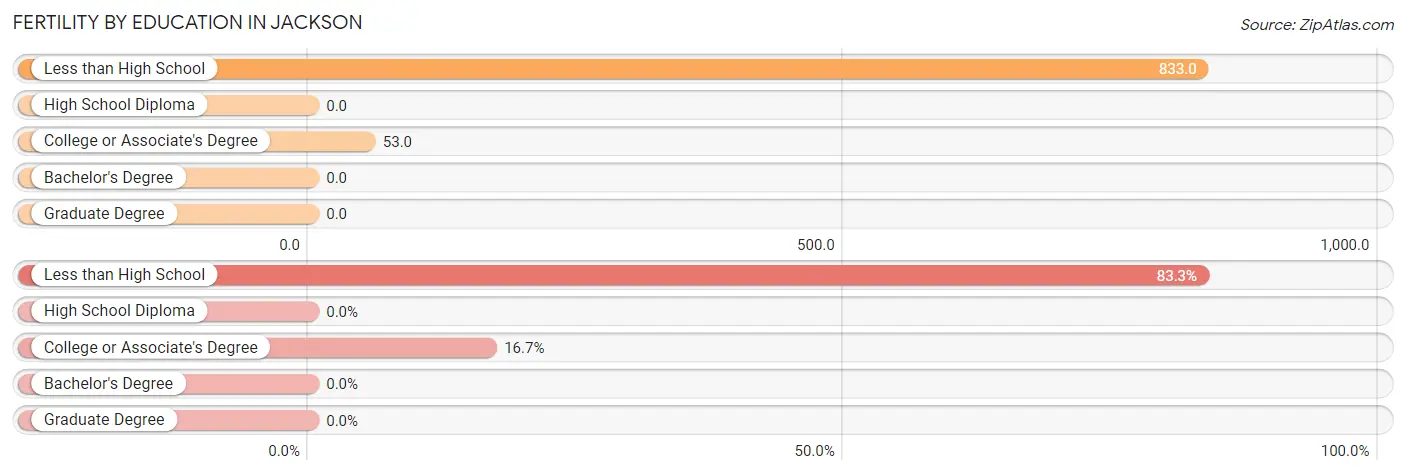
| Educational Attainment | Women with Births | Births / 1,000 Women |
| Less than High School | 5 (83.3%) | 833.0 |
| High School Diploma | 0 (0.0%) | 0.0 |
| College or Associate's Degree | 1 (16.7%) | 53.0 |
| Bachelor's Degree | 0 (0.0%) | 0.0 |
| Graduate Degree | 0 (0.0%) | 0.0 |
| Total | 6 (100.0%) | 143.0 |
Fertility by Education by Marriage Status in Jackson
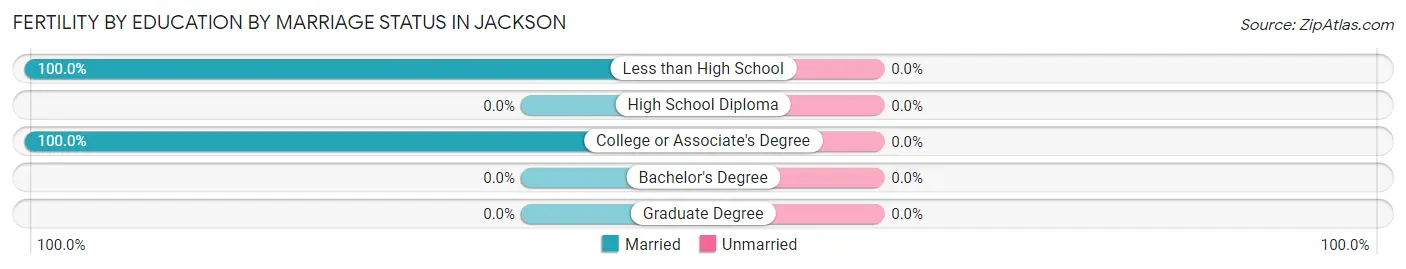
| Educational Attainment | Married | Unmarried |
| Less than High School | 5 (100.0%) | 0 (0.0%) |
| High School Diploma | 0 (0.0%) | 0 (0.0%) |
| College or Associate's Degree | 1 (100.0%) | 0 (0.0%) |
| Bachelor's Degree | 0 (0.0%) | 0 (0.0%) |
| Graduate Degree | 0 (0.0%) | 0 (0.0%) |
| Total | 6 (100.0%) | 0 (0.0%) |
Income in Jackson
Income Overview in Jackson
Per Capita Income in Jackson is $24,169, while median incomes of families and households are $84,107 and $71,250 respectively.
| Characteristic | Number | Measure |
| Per Capita Income | 258 | $24,169 |
| Median Family Income | 49 | $84,107 |
| Mean Family Income | 49 | $95,006 |
| Median Household Income | 72 | $71,250 |
| Mean Household Income | 72 | $77,801 |
| Income Deficit | 49 | $0 |
| Wage / Income Gap (%) | 258 | 15.39% |
| Wage / Income Gap ($) | 258 | 84.61¢ per $1 |
| Gini / Inequality Index | 258 | 0.39 |
Earnings by Sex in Jackson
Average Earnings in Jackson are $40,469, $34,750 for men and $41,071 for women, a difference of 15.4%.

| Sex | Number | Average Earnings |
| Male | 67 (61.5%) | $34,750 |
| Female | 42 (38.5%) | $41,071 |
| Total | 109 (100.0%) | $40,469 |
Earnings by Sex by Income Bracket in Jackson
The most common earnings brackets in Jackson are $2,499 or less for men (15 | 22.4%) and $40,000 to $44,999 for women (7 | 16.7%).
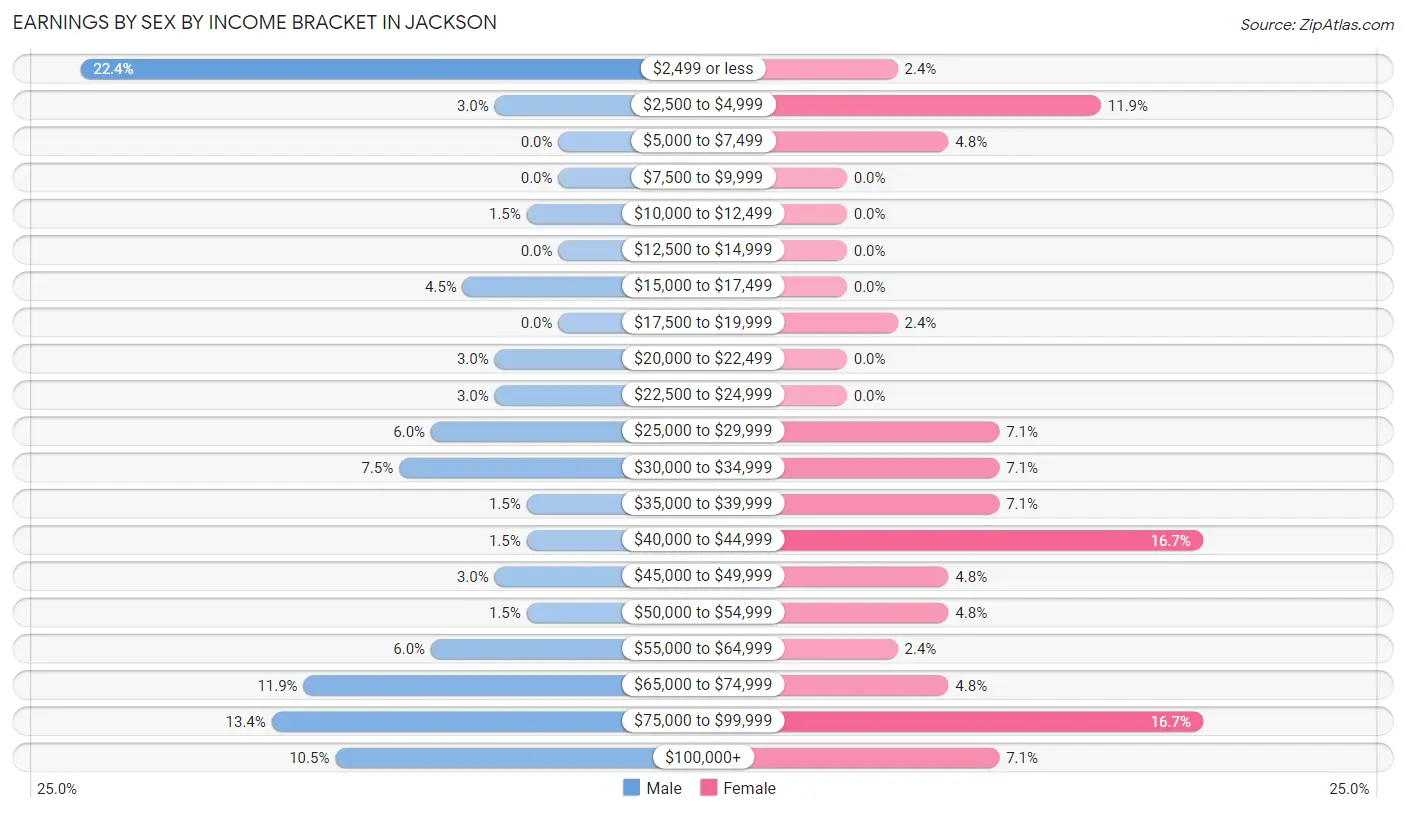
| Income | Male | Female |
| $2,499 or less | 15 (22.4%) | 1 (2.4%) |
| $2,500 to $4,999 | 2 (3.0%) | 5 (11.9%) |
| $5,000 to $7,499 | 0 (0.0%) | 2 (4.8%) |
| $7,500 to $9,999 | 0 (0.0%) | 0 (0.0%) |
| $10,000 to $12,499 | 1 (1.5%) | 0 (0.0%) |
| $12,500 to $14,999 | 0 (0.0%) | 0 (0.0%) |
| $15,000 to $17,499 | 3 (4.5%) | 0 (0.0%) |
| $17,500 to $19,999 | 0 (0.0%) | 1 (2.4%) |
| $20,000 to $22,499 | 2 (3.0%) | 0 (0.0%) |
| $22,500 to $24,999 | 2 (3.0%) | 0 (0.0%) |
| $25,000 to $29,999 | 4 (6.0%) | 3 (7.1%) |
| $30,000 to $34,999 | 5 (7.5%) | 3 (7.1%) |
| $35,000 to $39,999 | 1 (1.5%) | 3 (7.1%) |
| $40,000 to $44,999 | 1 (1.5%) | 7 (16.7%) |
| $45,000 to $49,999 | 2 (3.0%) | 2 (4.8%) |
| $50,000 to $54,999 | 1 (1.5%) | 2 (4.8%) |
| $55,000 to $64,999 | 4 (6.0%) | 1 (2.4%) |
| $65,000 to $74,999 | 8 (11.9%) | 2 (4.8%) |
| $75,000 to $99,999 | 9 (13.4%) | 7 (16.7%) |
| $100,000+ | 7 (10.4%) | 3 (7.1%) |
| Total | 67 (100.0%) | 42 (100.0%) |
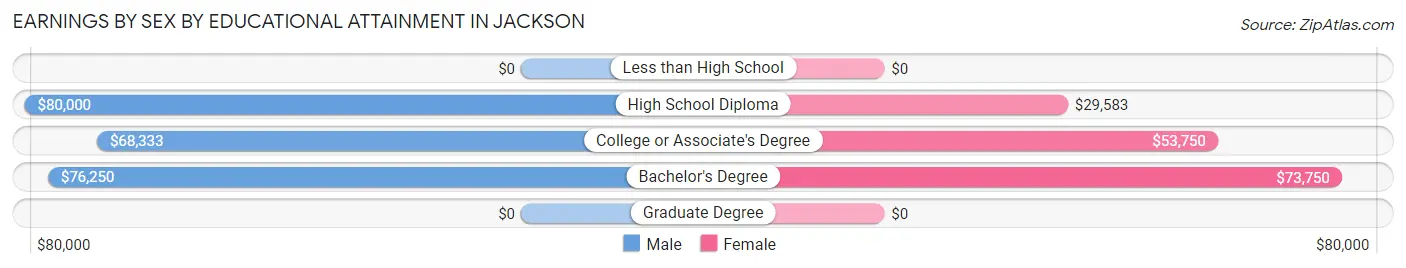
Earnings by Sex by Educational Attainment in Jackson
Average earnings in Jackson are $69,063 for men and $43,750 for women, a difference of 36.6%. Men with an educational attainment of high school diploma enjoy the highest average annual earnings of $80,000, while those with college or associate's degree education earn the least with $68,333. Women with an educational attainment of bachelor's degree earn the most with the average annual earnings of $73,750, while those with high school diploma education have the smallest earnings of $29,583.
| Educational Attainment | Male Income | Female Income |
| Less than High School | - | - |
| High School Diploma | $80,000 | $29,583 |
| College or Associate's Degree | $68,333 | $53,750 |
| Bachelor's Degree | $76,250 | $73,750 |
| Graduate Degree | - | - |
| Total | $69,063 | $43,750 |
Family Income in Jackson
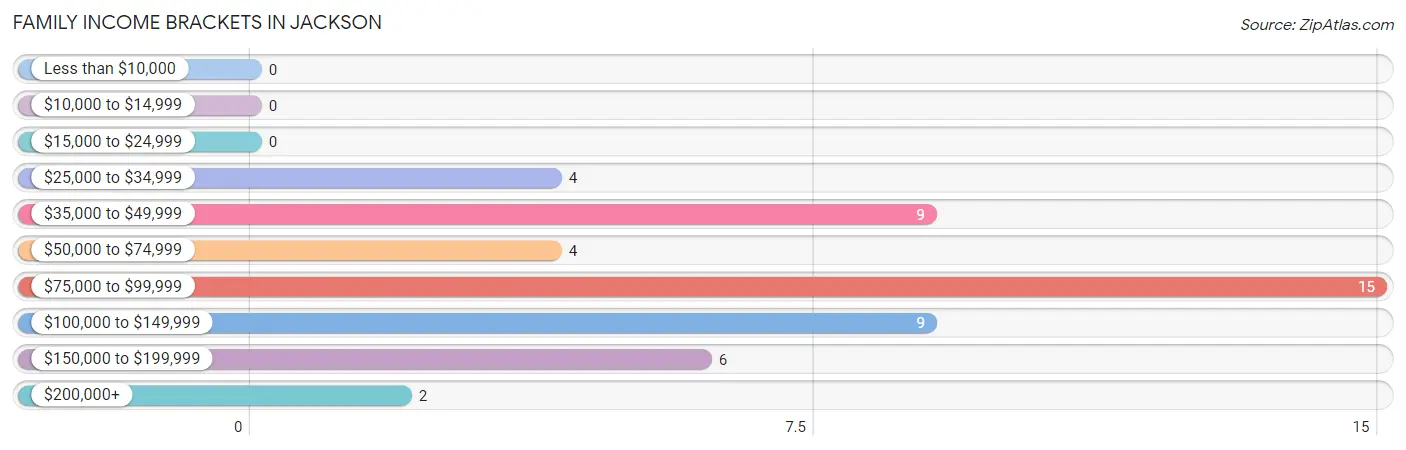
Family Income Brackets in Jackson
According to the Jackson family income data, there are 15 families falling into the $75,000 to $99,999 income range, which is the most common income bracket and makes up 30.6% of all families.
| Income Bracket | # Families | % Families |
| Less than $10,000 | 0 | 0.0% |
| $10,000 to $14,999 | 0 | 0.0% |
| $15,000 to $24,999 | 0 | 0.0% |
| $25,000 to $34,999 | 4 | 8.2% |
| $35,000 to $49,999 | 9 | 18.4% |
| $50,000 to $74,999 | 4 | 8.2% |
| $75,000 to $99,999 | 15 | 30.6% |
| $100,000 to $149,999 | 9 | 18.4% |
| $150,000 to $199,999 | 6 | 12.2% |
| $200,000+ | 2 | 4.1% |
Family Income by Famaliy Size in Jackson
4-person families (10 | 20.4%) account for the highest median family income in Jackson with $147,500 per family, while 2-person families (26 | 53.1%) have the highest median income of $41,250 per family member.

| Income Bracket | # Families | Median Income |
| 2-Person Families | 26 (53.1%) | $82,500 |
| 3-Person Families | 8 (16.3%) | $0 |
| 4-Person Families | 10 (20.4%) | $147,500 |
| 5-Person Families | 0 (0.0%) | $0 |
| 6-Person Families | 0 (0.0%) | $0 |
| 7+ Person Families | 5 (10.2%) | $0 |
| Total | 49 (100.0%) | $84,107 |
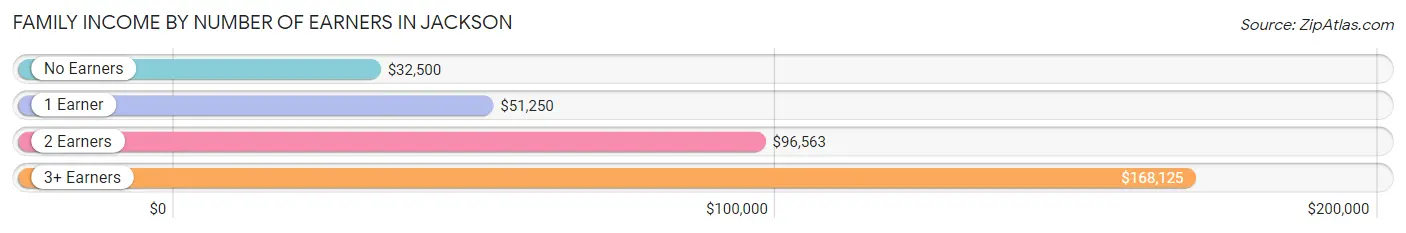
Family Income by Number of Earners in Jackson
The median family income in Jackson is $84,107, with families comprising 3+ earners (6) having the highest median family income of $168,125, while families with no earners (8) have the lowest median family income of $32,500, accounting for 12.2% and 16.3% of families, respectively.
| Number of Earners | # Families | Median Income |
| No Earners | 8 (16.3%) | $32,500 |
| 1 Earner | 12 (24.5%) | $51,250 |
| 2 Earners | 23 (46.9%) | $96,563 |
| 3+ Earners | 6 (12.2%) | $168,125 |
| Total | 49 (100.0%) | $84,107 |
Household Income in Jackson
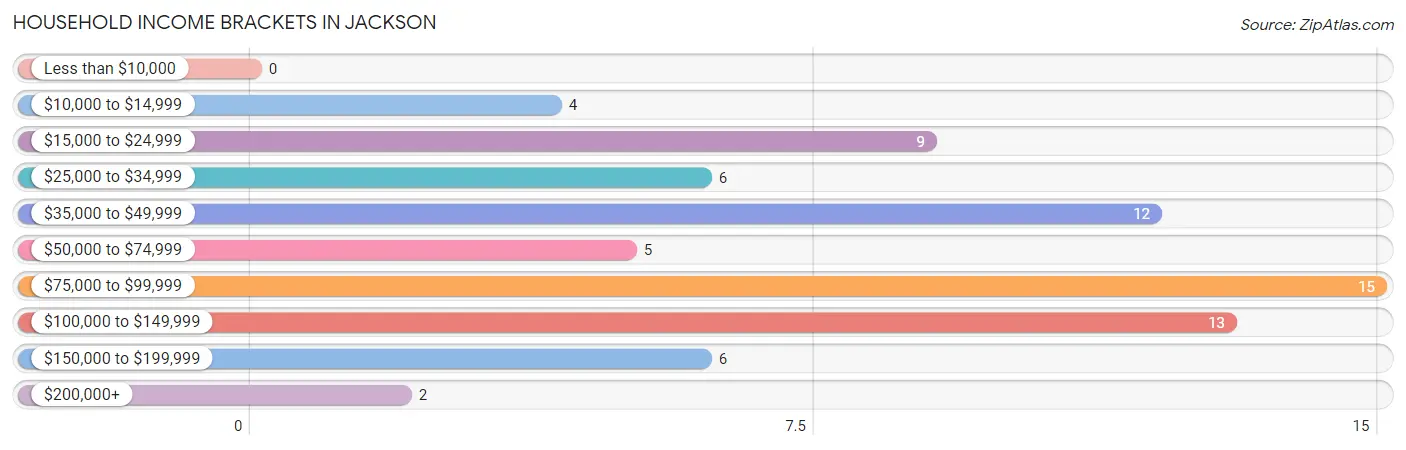
Household Income Brackets in Jackson
With 15 households falling in the category, the $75,000 to $99,999 income range is the most frequent in Jackson, accounting for 20.8% of all households.
| Income Bracket | # Households | % Households |
| Less than $10,000 | 0 | 0.0% |
| $10,000 to $14,999 | 4 | 5.6% |
| $15,000 to $24,999 | 9 | 12.5% |
| $25,000 to $34,999 | 6 | 8.3% |
| $35,000 to $49,999 | 12 | 16.7% |
| $50,000 to $74,999 | 5 | 6.9% |
| $75,000 to $99,999 | 15 | 20.8% |
| $100,000 to $149,999 | 13 | 18.1% |
| $150,000 to $199,999 | 6 | 8.3% |
| $200,000+ | 2 | 2.8% |
Household Income by Householder Age in Jackson
The median household income in Jackson is $71,250, with the highest median household income of $106,250 found in the 45 to 64 years age bracket for the primary householder. A total of 24 households (33.3%) fall into this category. Meanwhile, the 15 to 24 years age bracket for the primary householder has the lowest median household income of $0, with 2 households (2.8%) in this group.
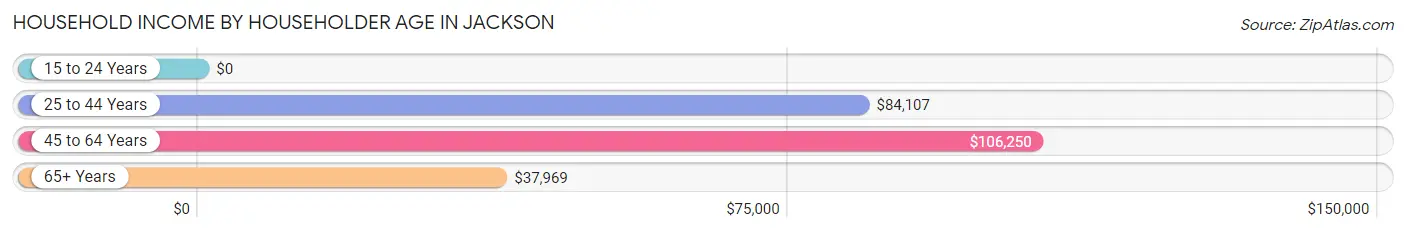
| Income Bracket | # Households | Median Income |
| 15 to 24 Years | 2 (2.8%) | $0 |
| 25 to 44 Years | 15 (20.8%) | $84,107 |
| 45 to 64 Years | 24 (33.3%) | $106,250 |
| 65+ Years | 31 (43.1%) | $37,969 |
| Total | 72 (100.0%) | $71,250 |
Poverty in Jackson
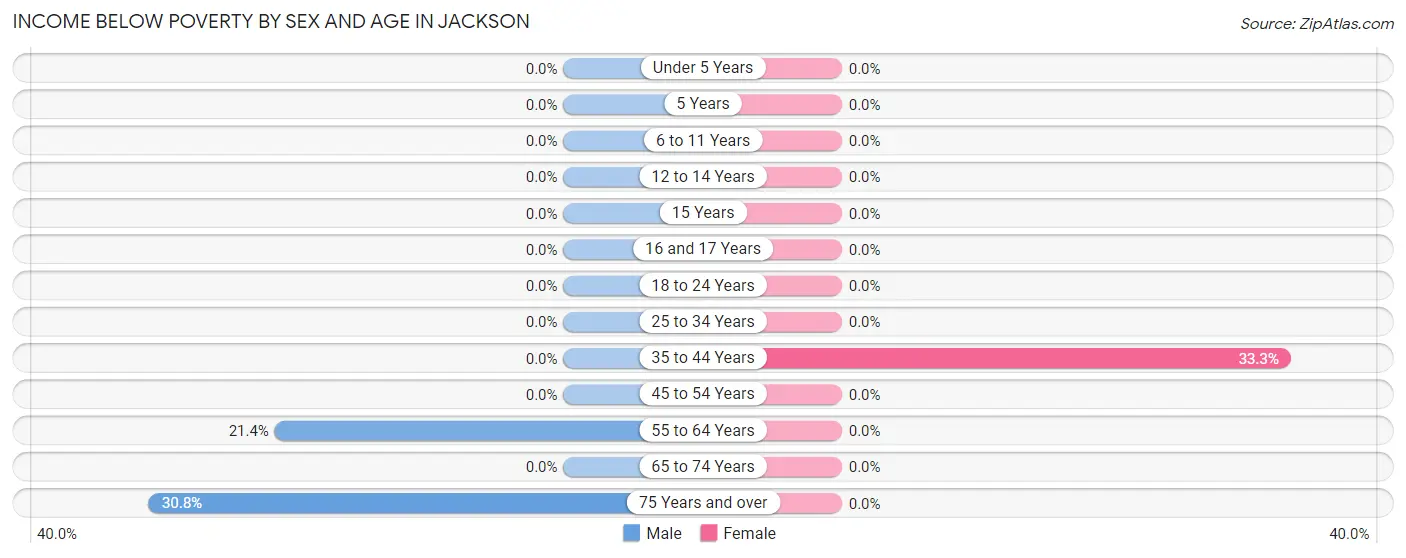
Income Below Poverty by Sex and Age in Jackson
With 5.1% poverty level for males and 4.1% for females among the residents of Jackson, 75 year old and over males and 35 to 44 year old females are the most vulnerable to poverty, with 4 males (30.8%) and 5 females (33.3%) in their respective age groups living below the poverty level.
| Age Bracket | Male | Female |
| Under 5 Years | 0 (0.0%) | 0 (0.0%) |
| 5 Years | 0 (0.0%) | 0 (0.0%) |
| 6 to 11 Years | 0 (0.0%) | 0 (0.0%) |
| 12 to 14 Years | 0 (0.0%) | 0 (0.0%) |
| 15 Years | 0 (0.0%) | 0 (0.0%) |
| 16 and 17 Years | 0 (0.0%) | 0 (0.0%) |
| 18 to 24 Years | 0 (0.0%) | 0 (0.0%) |
| 25 to 34 Years | 0 (0.0%) | 0 (0.0%) |
| 35 to 44 Years | 0 (0.0%) | 5 (33.3%) |
| 45 to 54 Years | 0 (0.0%) | 0 (0.0%) |
| 55 to 64 Years | 3 (21.4%) | 0 (0.0%) |
| 65 to 74 Years | 0 (0.0%) | 0 (0.0%) |
| 75 Years and over | 4 (30.8%) | 0 (0.0%) |
| Total | 7 (5.1%) | 5 (4.1%) |
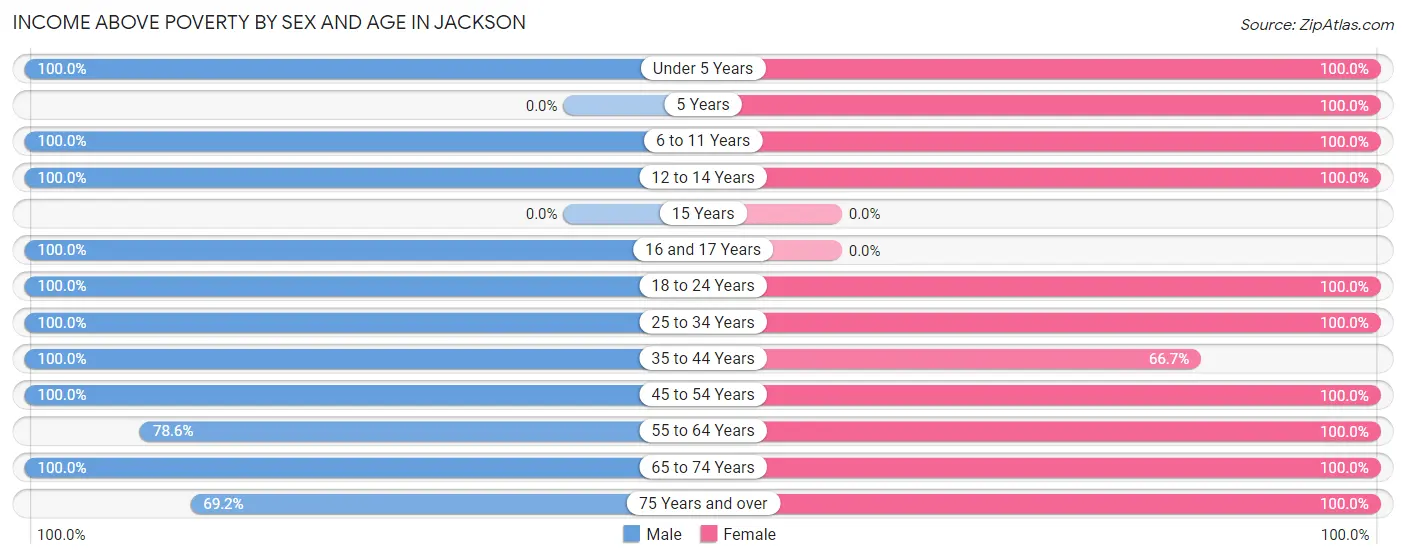
Income Above Poverty by Sex and Age in Jackson
According to the poverty statistics in Jackson, males aged under 5 years and females aged under 5 years are the age groups that are most secure financially, with 100.0% of males and 100.0% of females in these age groups living above the poverty line.
| Age Bracket | Male | Female |
| Under 5 Years | 29 (100.0%) | 13 (100.0%) |
| 5 Years | 0 (0.0%) | 2 (100.0%) |
| 6 to 11 Years | 3 (100.0%) | 19 (100.0%) |
| 12 to 14 Years | 13 (100.0%) | 10 (100.0%) |
| 15 Years | 0 (0.0%) | 0 (0.0%) |
| 16 and 17 Years | 5 (100.0%) | 0 (0.0%) |
| 18 to 24 Years | 24 (100.0%) | 8 (100.0%) |
| 25 to 34 Years | 5 (100.0%) | 5 (100.0%) |
| 35 to 44 Years | 11 (100.0%) | 10 (66.7%) |
| 45 to 54 Years | 12 (100.0%) | 14 (100.0%) |
| 55 to 64 Years | 11 (78.6%) | 16 (100.0%) |
| 65 to 74 Years | 7 (100.0%) | 7 (100.0%) |
| 75 Years and over | 9 (69.2%) | 13 (100.0%) |
| Total | 129 (94.9%) | 117 (95.9%) |
Income Below Poverty Among Married-Couple Families in Jackson

| Children | Above Poverty | Below Poverty |
| No Children | 28 (100.0%) | 0 (0.0%) |
| 1 or 2 Children | 6 (100.0%) | 0 (0.0%) |
| 3 or 4 Children | 0 (0.0%) | 0 (0.0%) |
| 5 or more Children | 5 (100.0%) | 0 (0.0%) |
| Total | 39 (100.0%) | 0 (0.0%) |
Income Below Poverty Among Single-Parent Households in Jackson
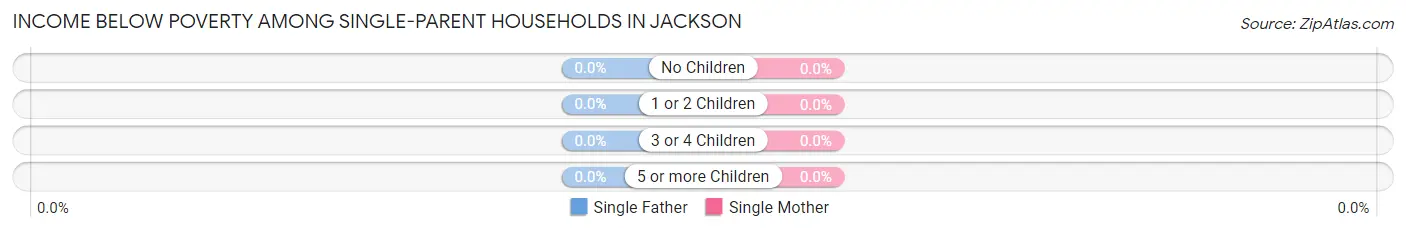
| Children | Single Father | Single Mother |
| No Children | 0 (0.0%) | 0 (0.0%) |
| 1 or 2 Children | 0 (0.0%) | 0 (0.0%) |
| 3 or 4 Children | 0 (0.0%) | 0 (0.0%) |
| 5 or more Children | 0 (0.0%) | 0 (0.0%) |
| Total | 0 (0.0%) | 0 (0.0%) |
Income Below Poverty Among Married-Couple vs Single-Parent Households in Jackson
| Children | Married-Couple Families | Single-Parent Households |
| No Children | 0 (0.0%) | 0 (0.0%) |
| 1 or 2 Children | 0 (0.0%) | 0 (0.0%) |
| 3 or 4 Children | 0 (0.0%) | 0 (0.0%) |
| 5 or more Children | 0 (0.0%) | 0 (0.0%) |
| Total | 0 (0.0%) | 0 (0.0%) |
Employment Characteristics in Jackson
Employment by Class of Employer in Jackson
Among the 98 employed individuals in Jackson, private company employees (79 | 80.6%), local government employees (9 | 9.2%), and self-employed (not incorporated) (4 | 4.1%) make up the most common classes of employment.
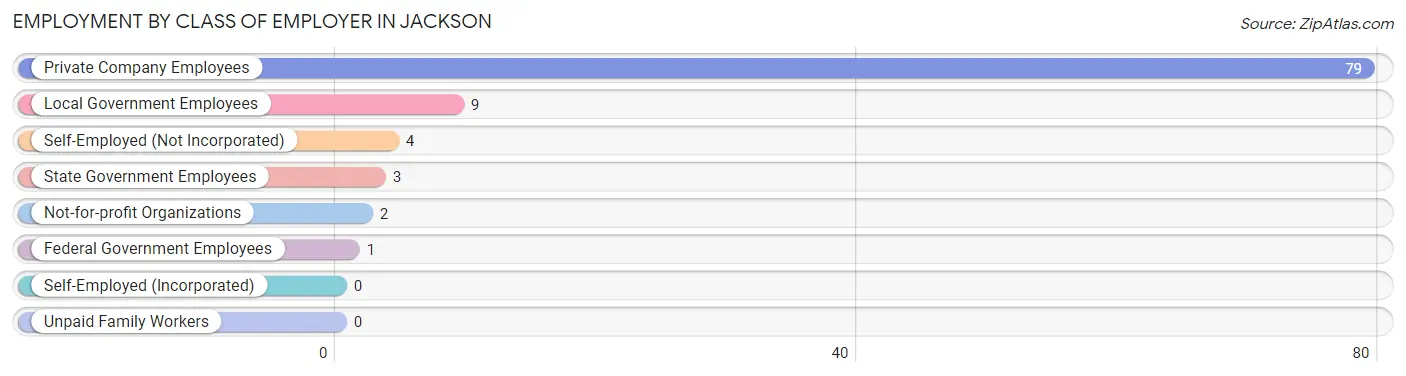
| Employer Class | # Employees | % Employees |
| Private Company Employees | 79 | 80.6% |
| Self-Employed (Incorporated) | 0 | 0.0% |
| Self-Employed (Not Incorporated) | 4 | 4.1% |
| Not-for-profit Organizations | 2 | 2.0% |
| Local Government Employees | 9 | 9.2% |
| State Government Employees | 3 | 3.1% |
| Federal Government Employees | 1 | 1.0% |
| Unpaid Family Workers | 0 | 0.0% |
| Total | 98 | 100.0% |
Employment Status by Age in Jackson
According to the labor force statistics for Jackson, out of the total population over 16 years of age (169), 63.3% or 107 individuals are in the labor force, with 7.5% or 8 of them unemployed. The age group with the highest labor force participation rate is 20 to 24 years, with 100.0% or 30 individuals in the labor force. Within the labor force, the 20 to 24 years age range has the highest percentage of unemployed individuals, with 26.7% or 8 of them being unemployed.
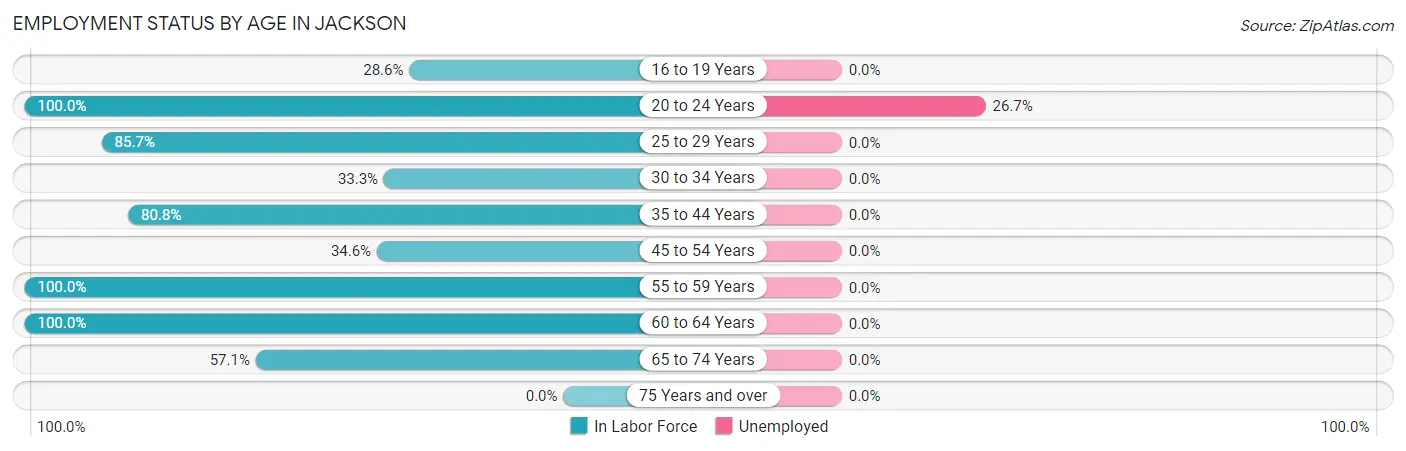
| Age Bracket | In Labor Force | Unemployed |
| 16 to 19 Years | 2 (28.6%) | 0 (0.0%) |
| 20 to 24 Years | 30 (100.0%) | 8 (26.7%) |
| 25 to 29 Years | 6 (85.7%) | 0 (0.0%) |
| 30 to 34 Years | 1 (33.3%) | 0 (0.0%) |
| 35 to 44 Years | 21 (80.8%) | 0 (0.0%) |
| 45 to 54 Years | 9 (34.6%) | 0 (0.0%) |
| 55 to 59 Years | 21 (100.0%) | 0 (0.0%) |
| 60 to 64 Years | 9 (100.0%) | 0 (0.0%) |
| 65 to 74 Years | 8 (57.1%) | 0 (0.0%) |
| 75 Years and over | 0 (0.0%) | 0 (0.0%) |
| Total | 107 (63.3%) | 8 (7.5%) |
Employment Status by Educational Attainment in Jackson
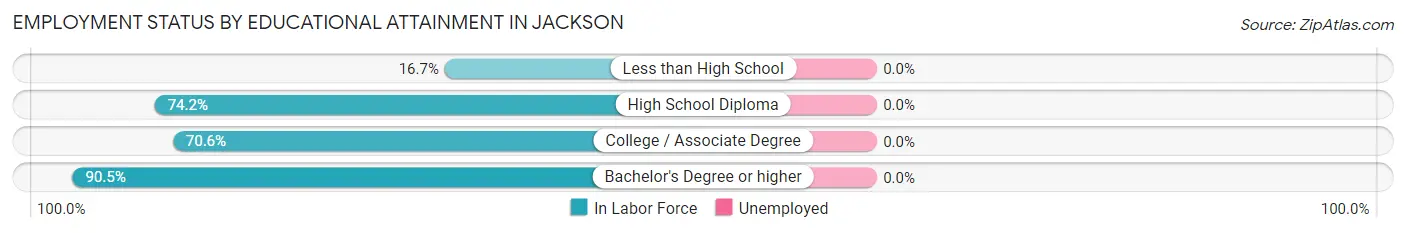
| Educational Attainment | In Labor Force | Unemployed |
| Less than High School | 1 (16.7%) | 0 (0.0%) |
| High School Diploma | 23 (74.2%) | 0 (0.0%) |
| College / Associate Degree | 24 (70.6%) | 0 (0.0%) |
| Bachelor's Degree or higher | 19 (90.5%) | 0 (0.0%) |
| Total | 67 (72.8%) | 0 (0.0%) |
Employment Occupations by Sex in Jackson
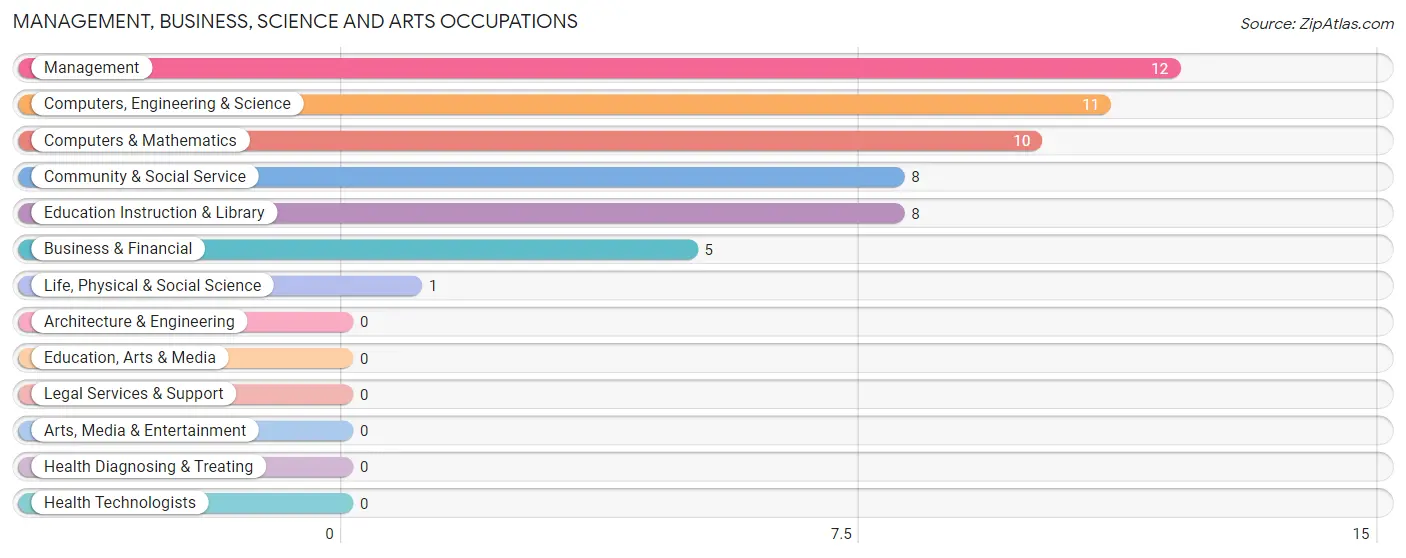
Management, Business, Science and Arts Occupations
The most common Management, Business, Science and Arts occupations in Jackson are Management (12 | 12.1%), Computers, Engineering & Science (11 | 11.1%), Computers & Mathematics (10 | 10.1%), Community & Social Service (8 | 8.1%), and Education Instruction & Library (8 | 8.1%).
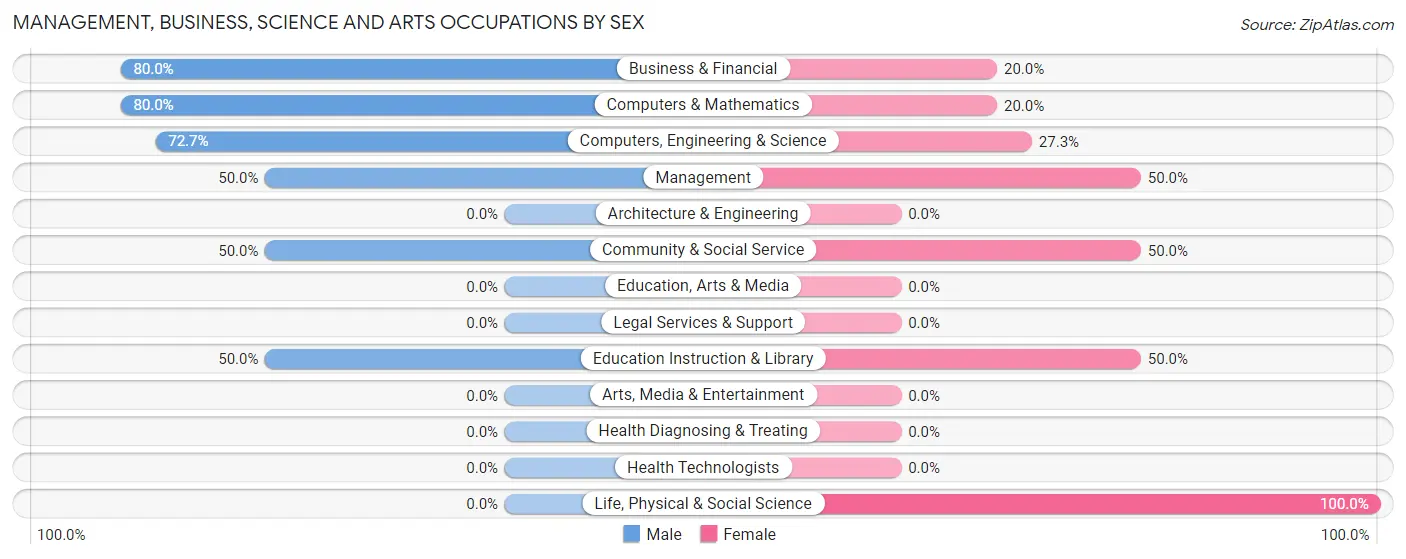
Management, Business, Science and Arts Occupations by Sex
Within the Management, Business, Science and Arts occupations in Jackson, the most male-oriented occupations are Business & Financial (80.0%), Computers & Mathematics (80.0%), and Computers, Engineering & Science (72.7%), while the most female-oriented occupations are Life, Physical & Social Science (100.0%), Management (50.0%), and Community & Social Service (50.0%).
| Occupation | Male | Female |
| Management | 6 (50.0%) | 6 (50.0%) |
| Business & Financial | 4 (80.0%) | 1 (20.0%) |
| Computers, Engineering & Science | 8 (72.7%) | 3 (27.3%) |
| Computers & Mathematics | 8 (80.0%) | 2 (20.0%) |
| Architecture & Engineering | 0 (0.0%) | 0 (0.0%) |
| Life, Physical & Social Science | 0 (0.0%) | 1 (100.0%) |
| Community & Social Service | 4 (50.0%) | 4 (50.0%) |
| Education, Arts & Media | 0 (0.0%) | 0 (0.0%) |
| Legal Services & Support | 0 (0.0%) | 0 (0.0%) |
| Education Instruction & Library | 4 (50.0%) | 4 (50.0%) |
| Arts, Media & Entertainment | 0 (0.0%) | 0 (0.0%) |
| Health Diagnosing & Treating | 0 (0.0%) | 0 (0.0%) |
| Health Technologists | 0 (0.0%) | 0 (0.0%) |
| Total (Category) | 22 (61.1%) | 14 (38.9%) |
| Total (Overall) | 58 (58.6%) | 41 (41.4%) |
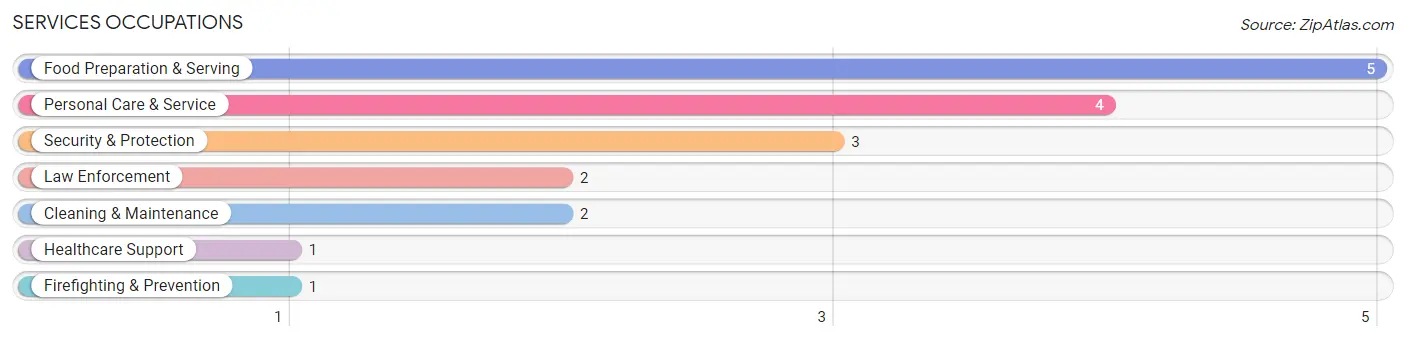
Services Occupations
The most common Services occupations in Jackson are Food Preparation & Serving (5 | 5.1%), Personal Care & Service (4 | 4.0%), Security & Protection (3 | 3.0%), Law Enforcement (2 | 2.0%), and Cleaning & Maintenance (2 | 2.0%).
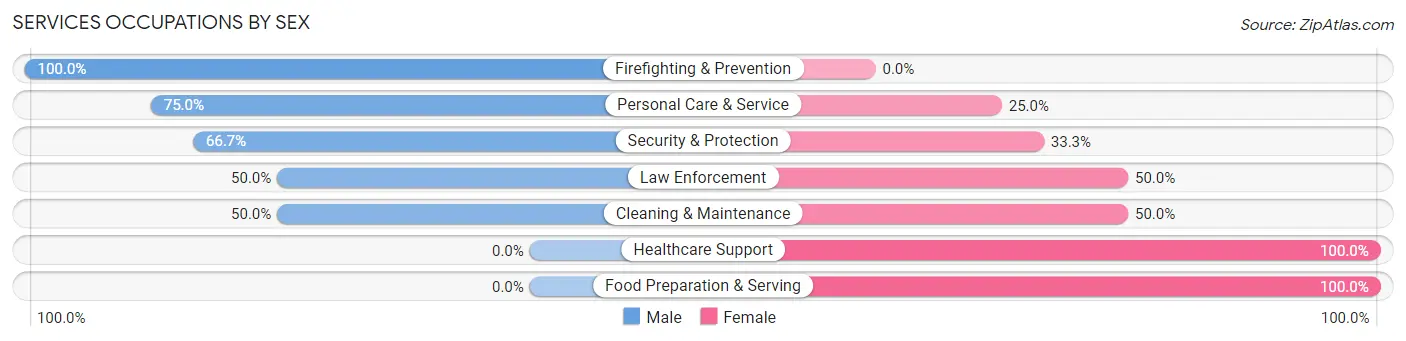
Services Occupations by Sex
Within the Services occupations in Jackson, the most male-oriented occupations are Firefighting & Prevention (100.0%), Personal Care & Service (75.0%), and Security & Protection (66.7%), while the most female-oriented occupations are Healthcare Support (100.0%), Food Preparation & Serving (100.0%), and Law Enforcement (50.0%).
| Occupation | Male | Female |
| Healthcare Support | 0 (0.0%) | 1 (100.0%) |
| Security & Protection | 2 (66.7%) | 1 (33.3%) |
| Firefighting & Prevention | 1 (100.0%) | 0 (0.0%) |
| Law Enforcement | 1 (50.0%) | 1 (50.0%) |
| Food Preparation & Serving | 0 (0.0%) | 5 (100.0%) |
| Cleaning & Maintenance | 1 (50.0%) | 1 (50.0%) |
| Personal Care & Service | 3 (75.0%) | 1 (25.0%) |
| Total (Category) | 6 (40.0%) | 9 (60.0%) |
| Total (Overall) | 58 (58.6%) | 41 (41.4%) |
Sales and Office Occupations
The most common Sales and Office occupations in Jackson are Office & Administration (8 | 8.1%), and Sales & Related (1 | 1.0%).
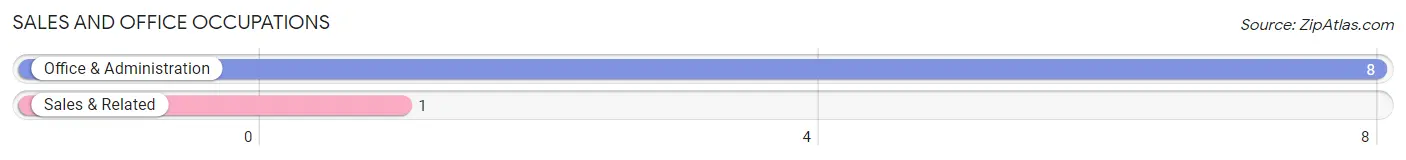
Sales and Office Occupations by Sex
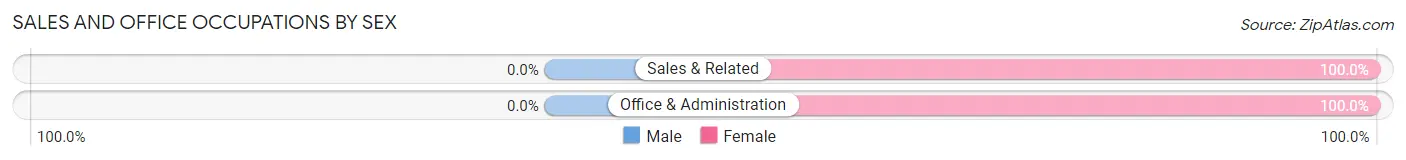
| Occupation | Male | Female |
| Sales & Related | 0 (0.0%) | 1 (100.0%) |
| Office & Administration | 0 (0.0%) | 8 (100.0%) |
| Total (Category) | 0 (0.0%) | 9 (100.0%) |
| Total (Overall) | 58 (58.6%) | 41 (41.4%) |
Natural Resources, Construction and Maintenance Occupations
The most common Natural Resources, Construction and Maintenance occupations in Jackson are Installation, Maintenance & Repair (7 | 7.1%), and Construction & Extraction (2 | 2.0%).
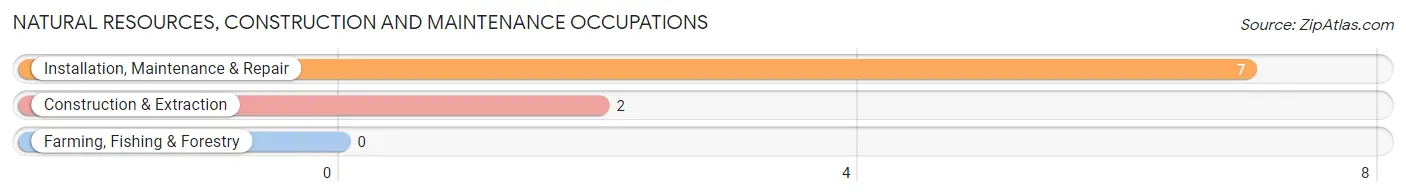
Natural Resources, Construction and Maintenance Occupations by Sex
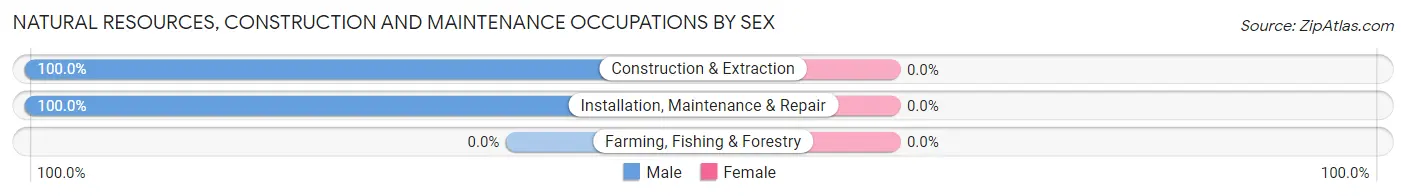
| Occupation | Male | Female |
| Farming, Fishing & Forestry | 0 (0.0%) | 0 (0.0%) |
| Construction & Extraction | 2 (100.0%) | 0 (0.0%) |
| Installation, Maintenance & Repair | 7 (100.0%) | 0 (0.0%) |
| Total (Category) | 9 (100.0%) | 0 (0.0%) |
| Total (Overall) | 58 (58.6%) | 41 (41.4%) |
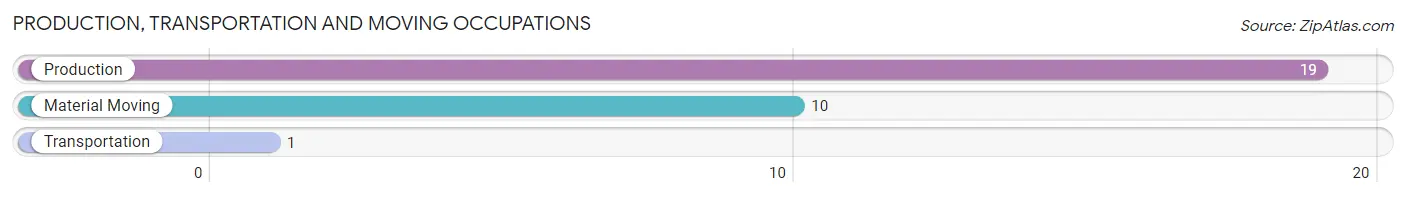
Production, Transportation and Moving Occupations
The most common Production, Transportation and Moving occupations in Jackson are Production (19 | 19.2%), Material Moving (10 | 10.1%), and Transportation (1 | 1.0%).
Production, Transportation and Moving Occupations by Sex
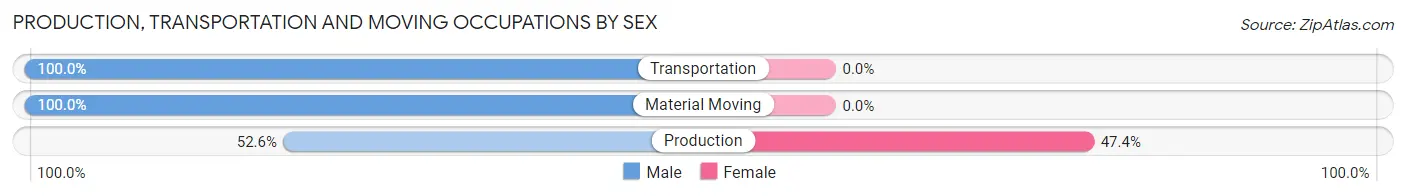
| Occupation | Male | Female |
| Production | 10 (52.6%) | 9 (47.4%) |
| Transportation | 1 (100.0%) | 0 (0.0%) |
| Material Moving | 10 (100.0%) | 0 (0.0%) |
| Total (Category) | 21 (70.0%) | 9 (30.0%) |
| Total (Overall) | 58 (58.6%) | 41 (41.4%) |
Employment Industries by Sex in Jackson
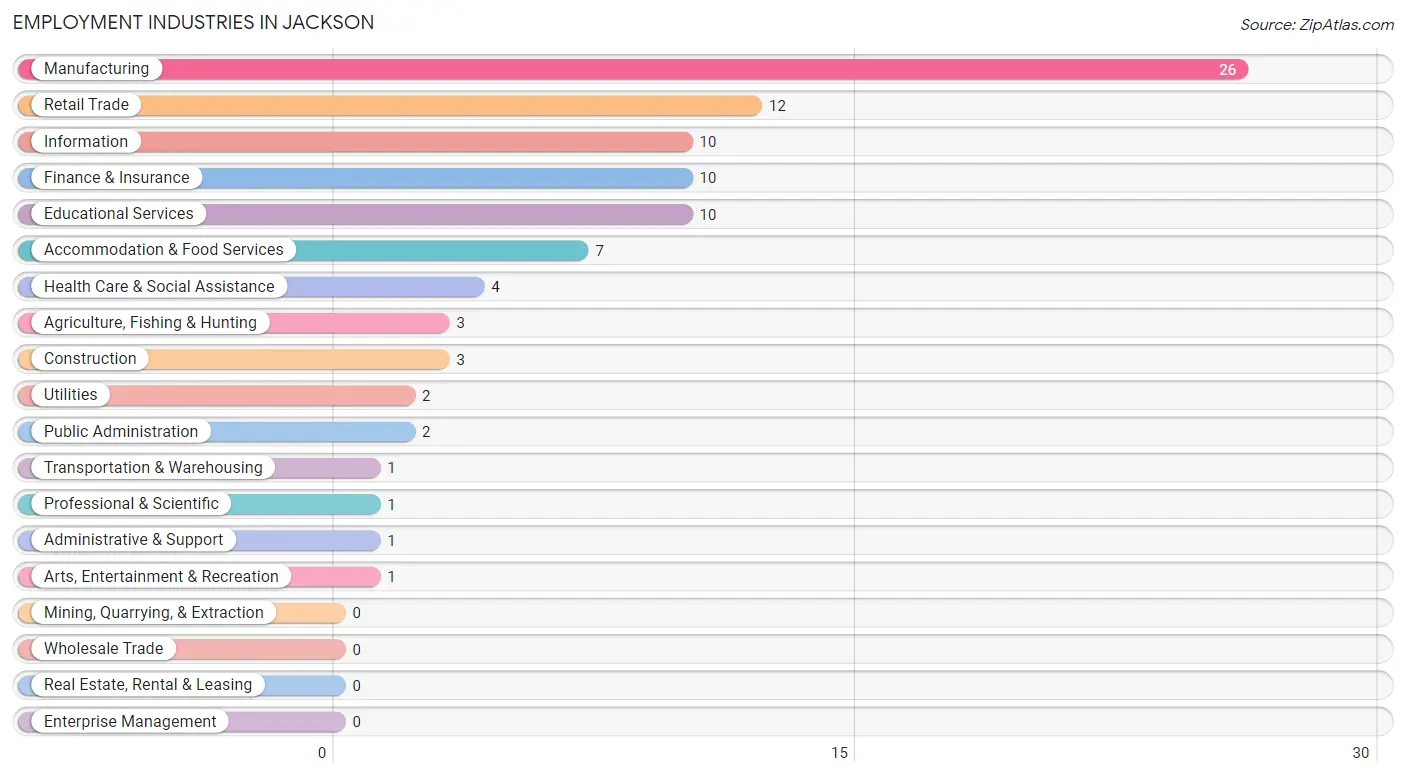
Employment Industries in Jackson
The major employment industries in Jackson include Manufacturing (26 | 26.3%), Retail Trade (12 | 12.1%), Information (10 | 10.1%), Finance & Insurance (10 | 10.1%), and Educational Services (10 | 10.1%).
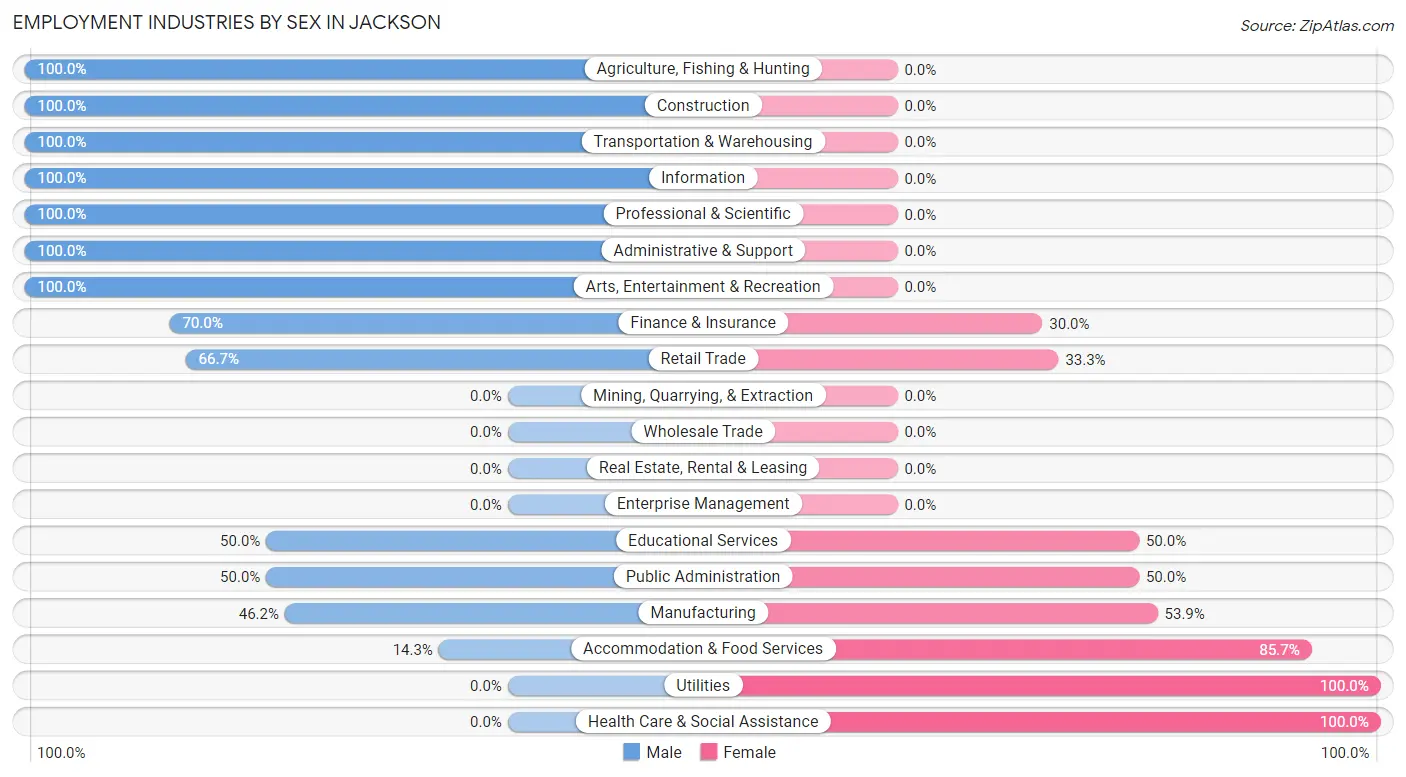
Employment Industries by Sex in Jackson
The Jackson industries that see more men than women are Agriculture, Fishing & Hunting (100.0%), Construction (100.0%), and Transportation & Warehousing (100.0%), whereas the industries that tend to have a higher number of women are Utilities (100.0%), Health Care & Social Assistance (100.0%), and Accommodation & Food Services (85.7%).
| Industry | Male | Female |
| Agriculture, Fishing & Hunting | 3 (100.0%) | 0 (0.0%) |
| Mining, Quarrying, & Extraction | 0 (0.0%) | 0 (0.0%) |
| Construction | 3 (100.0%) | 0 (0.0%) |
| Manufacturing | 12 (46.2%) | 14 (53.8%) |
| Wholesale Trade | 0 (0.0%) | 0 (0.0%) |
| Retail Trade | 8 (66.7%) | 4 (33.3%) |
| Transportation & Warehousing | 1 (100.0%) | 0 (0.0%) |
| Utilities | 0 (0.0%) | 2 (100.0%) |
| Information | 10 (100.0%) | 0 (0.0%) |
| Finance & Insurance | 7 (70.0%) | 3 (30.0%) |
| Real Estate, Rental & Leasing | 0 (0.0%) | 0 (0.0%) |
| Professional & Scientific | 1 (100.0%) | 0 (0.0%) |
| Enterprise Management | 0 (0.0%) | 0 (0.0%) |
| Administrative & Support | 1 (100.0%) | 0 (0.0%) |
| Educational Services | 5 (50.0%) | 5 (50.0%) |
| Health Care & Social Assistance | 0 (0.0%) | 4 (100.0%) |
| Arts, Entertainment & Recreation | 1 (100.0%) | 0 (0.0%) |
| Accommodation & Food Services | 1 (14.3%) | 6 (85.7%) |
| Public Administration | 1 (50.0%) | 1 (50.0%) |
| Total | 58 (58.6%) | 41 (41.4%) |
Education in Jackson
School Enrollment in Jackson
The most common levels of schooling among the 60 students in Jackson are middle school (23 | 38.3%), kindergarten (12 | 20.0%), and elementary school (12 | 20.0%).
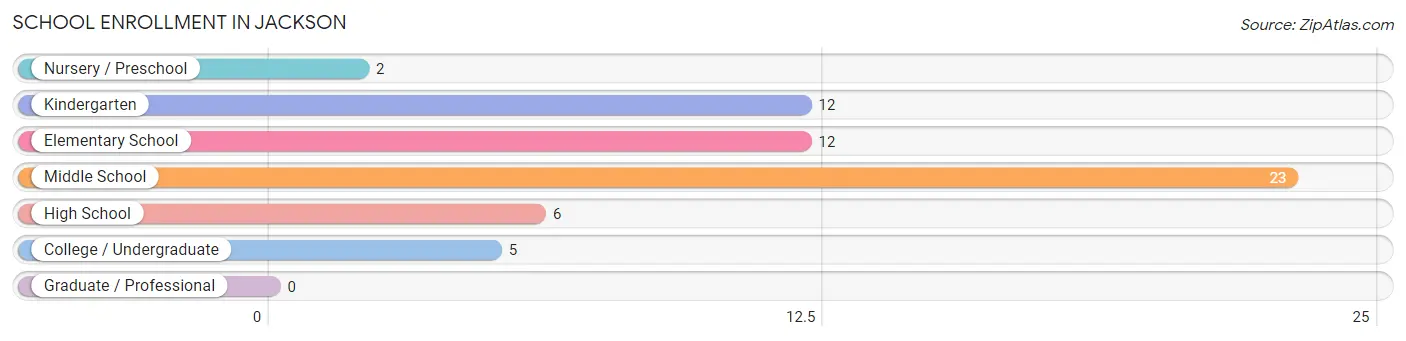
| School Level | # Students | % Students |
| Nursery / Preschool | 2 | 3.3% |
| Kindergarten | 12 | 20.0% |
| Elementary School | 12 | 20.0% |
| Middle School | 23 | 38.3% |
| High School | 6 | 10.0% |
| College / Undergraduate | 5 | 8.3% |
| Graduate / Professional | 0 | 0.0% |
| Total | 60 | 100.0% |
School Enrollment by Age by Funding Source in Jackson
Out of a total of 60 students who are enrolled in schools in Jackson, 20 (33.3%) attend a private institution, while the remaining 40 (66.7%) are enrolled in public schools. The age group of 3 to 4 year olds has the highest likelihood of being enrolled in private schools, with 2 (100.0% in the age bracket) enrolled. Conversely, the age group of 5 to 9 year old has the lowest likelihood of being enrolled in a private school, with 22 (100.0% in the age bracket) attending a public institution.
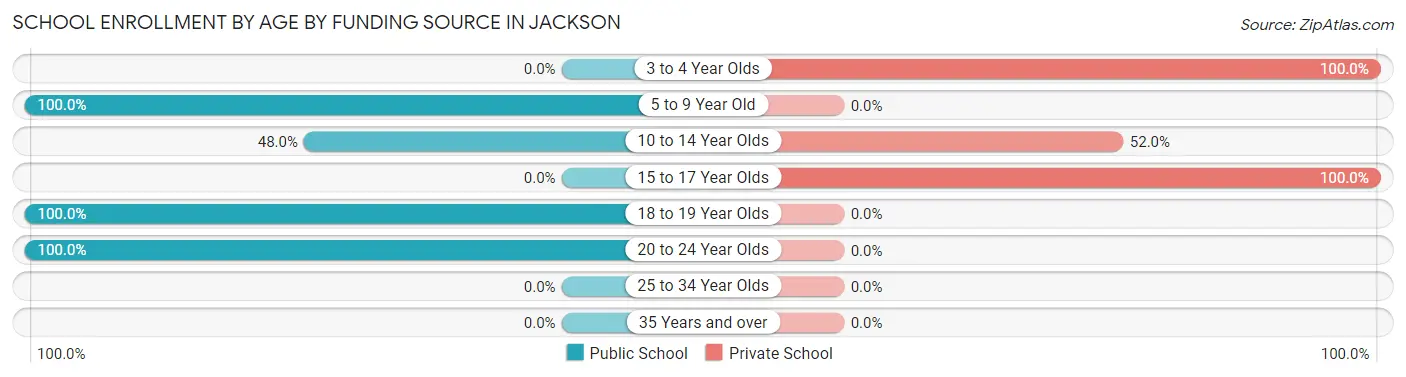
| Age Bracket | Public School | Private School |
| 3 to 4 Year Olds | 0 (0.0%) | 2 (100.0%) |
| 5 to 9 Year Old | 22 (100.0%) | 0 (0.0%) |
| 10 to 14 Year Olds | 12 (48.0%) | 13 (52.0%) |
| 15 to 17 Year Olds | 0 (0.0%) | 5 (100.0%) |
| 18 to 19 Year Olds | 2 (100.0%) | 0 (0.0%) |
| 20 to 24 Year Olds | 4 (100.0%) | 0 (0.0%) |
| 25 to 34 Year Olds | 0 (0.0%) | 0 (0.0%) |
| 35 Years and over | 0 (0.0%) | 0 (0.0%) |
| Total | 40 (66.7%) | 20 (33.3%) |
Educational Attainment by Field of Study in Jackson
Business (9 | 34.6%), arts & humanities (6 | 23.1%), bio, nature & agricultural (3 | 11.5%), science & technology (3 | 11.5%), and computers & mathematics (2 | 7.7%) are the most common fields of study among 26 individuals in Jackson who have obtained a bachelor's degree or higher.
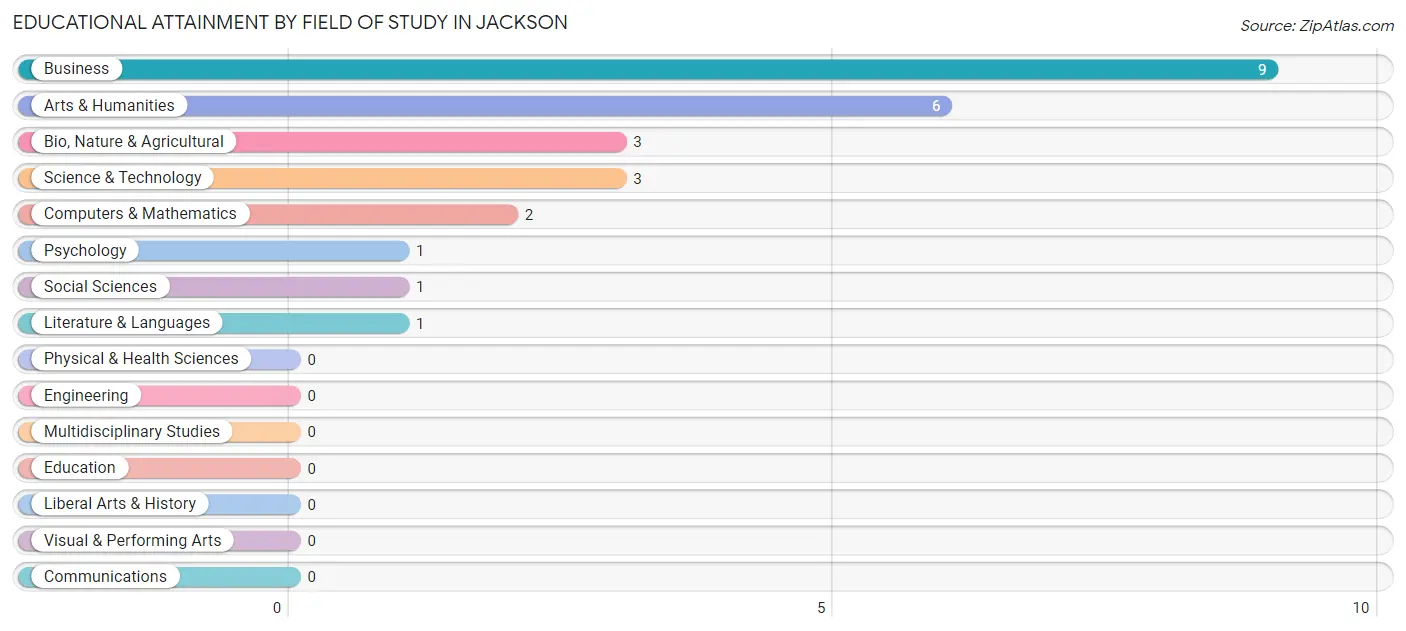
| Field of Study | # Graduates | % Graduates |
| Computers & Mathematics | 2 | 7.7% |
| Bio, Nature & Agricultural | 3 | 11.5% |
| Physical & Health Sciences | 0 | 0.0% |
| Psychology | 1 | 3.8% |
| Social Sciences | 1 | 3.8% |
| Engineering | 0 | 0.0% |
| Multidisciplinary Studies | 0 | 0.0% |
| Science & Technology | 3 | 11.5% |
| Business | 9 | 34.6% |
| Education | 0 | 0.0% |
| Literature & Languages | 1 | 3.8% |
| Liberal Arts & History | 0 | 0.0% |
| Visual & Performing Arts | 0 | 0.0% |
| Communications | 0 | 0.0% |
| Arts & Humanities | 6 | 23.1% |
| Total | 26 | 100.0% |
Transportation & Commute in Jackson
Vehicle Availability by Sex in Jackson
The most prevalent vehicle ownership categories in Jackson are males with 2 vehicles (28, accounting for 48.3%) and females with 2 vehicles (12, making up 70.0%).
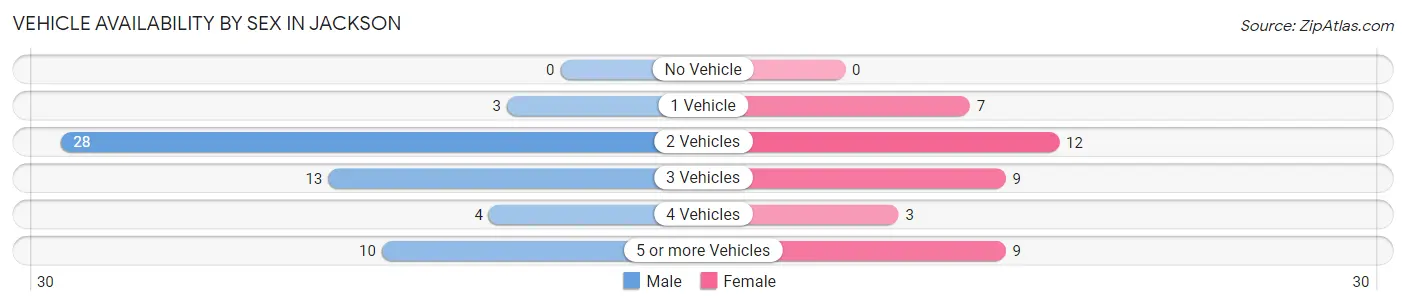
| Vehicles Available | Male | Female |
| No Vehicle | 0 (0.0%) | 0 (0.0%) |
| 1 Vehicle | 3 (5.2%) | 7 (17.5%) |
| 2 Vehicles | 28 (48.3%) | 12 (30.0%) |
| 3 Vehicles | 13 (22.4%) | 9 (22.5%) |
| 4 Vehicles | 4 (6.9%) | 3 (7.5%) |
| 5 or more Vehicles | 10 (17.2%) | 9 (22.5%) |
| Total | 58 (100.0%) | 40 (100.0%) |
Commute Time in Jackson
The most frequently occuring commute durations in Jackson are 15 to 19 minutes (33 commuters, 34.4%), 20 to 24 minutes (27 commuters, 28.1%), and 25 to 29 minutes (13 commuters, 13.5%).
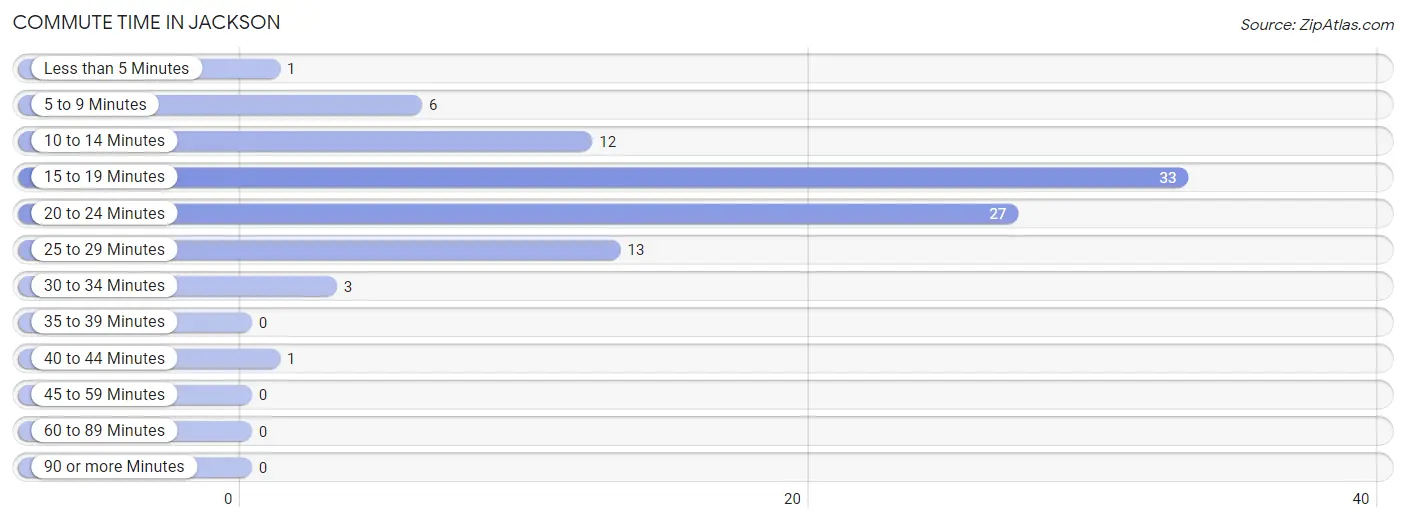
| Commute Time | # Commuters | % Commuters |
| Less than 5 Minutes | 1 | 1.0% |
| 5 to 9 Minutes | 6 | 6.2% |
| 10 to 14 Minutes | 12 | 12.5% |
| 15 to 19 Minutes | 33 | 34.4% |
| 20 to 24 Minutes | 27 | 28.1% |
| 25 to 29 Minutes | 13 | 13.5% |
| 30 to 34 Minutes | 3 | 3.1% |
| 35 to 39 Minutes | 0 | 0.0% |
| 40 to 44 Minutes | 1 | 1.0% |
| 45 to 59 Minutes | 0 | 0.0% |
| 60 to 89 Minutes | 0 | 0.0% |
| 90 or more Minutes | 0 | 0.0% |
Commute Time by Sex in Jackson
The most common commute times in Jackson are 15 to 19 minutes (24 commuters, 42.1%) for males and 25 to 29 minutes (13 commuters, 33.3%) for females.
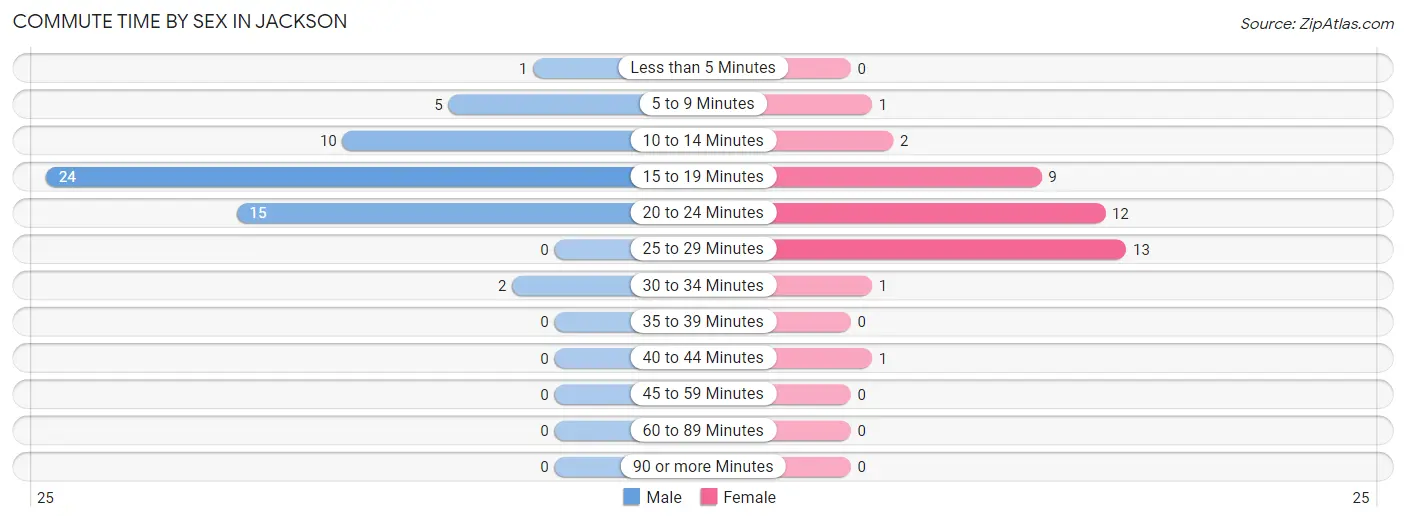
| Commute Time | Male | Female |
| Less than 5 Minutes | 1 (1.8%) | 0 (0.0%) |
| 5 to 9 Minutes | 5 (8.8%) | 1 (2.6%) |
| 10 to 14 Minutes | 10 (17.5%) | 2 (5.1%) |
| 15 to 19 Minutes | 24 (42.1%) | 9 (23.1%) |
| 20 to 24 Minutes | 15 (26.3%) | 12 (30.8%) |
| 25 to 29 Minutes | 0 (0.0%) | 13 (33.3%) |
| 30 to 34 Minutes | 2 (3.5%) | 1 (2.6%) |
| 35 to 39 Minutes | 0 (0.0%) | 0 (0.0%) |
| 40 to 44 Minutes | 0 (0.0%) | 1 (2.6%) |
| 45 to 59 Minutes | 0 (0.0%) | 0 (0.0%) |
| 60 to 89 Minutes | 0 (0.0%) | 0 (0.0%) |
| 90 or more Minutes | 0 (0.0%) | 0 (0.0%) |
Time of Departure to Work by Sex in Jackson
The most frequent times of departure to work in Jackson are 6:00 AM to 6:29 AM (11, 19.3%) for males and 7:30 AM to 7:59 AM (18, 46.2%) for females.

| Time of Departure | Male | Female |
| 12:00 AM to 4:59 AM | 9 (15.8%) | 0 (0.0%) |
| 5:00 AM to 5:29 AM | 1 (1.8%) | 2 (5.1%) |
| 5:30 AM to 5:59 AM | 6 (10.5%) | 1 (2.6%) |
| 6:00 AM to 6:29 AM | 11 (19.3%) | 1 (2.6%) |
| 6:30 AM to 6:59 AM | 2 (3.5%) | 4 (10.3%) |
| 7:00 AM to 7:29 AM | 3 (5.3%) | 6 (15.4%) |
| 7:30 AM to 7:59 AM | 7 (12.3%) | 18 (46.2%) |
| 8:00 AM to 8:29 AM | 3 (5.3%) | 1 (2.6%) |
| 8:30 AM to 8:59 AM | 5 (8.8%) | 0 (0.0%) |
| 9:00 AM to 9:59 AM | 0 (0.0%) | 0 (0.0%) |
| 10:00 AM to 10:59 AM | 1 (1.8%) | 0 (0.0%) |
| 11:00 AM to 11:59 AM | 0 (0.0%) | 0 (0.0%) |
| 12:00 PM to 3:59 PM | 1 (1.8%) | 6 (15.4%) |
| 4:00 PM to 11:59 PM | 8 (14.0%) | 0 (0.0%) |
| Total | 57 (100.0%) | 39 (100.0%) |
Housing Occupancy in Jackson
Occupancy by Ownership in Jackson
Of the total 72 dwellings in Jackson, owner-occupied units account for 67 (93.1%), while renter-occupied units make up 5 (6.9%).
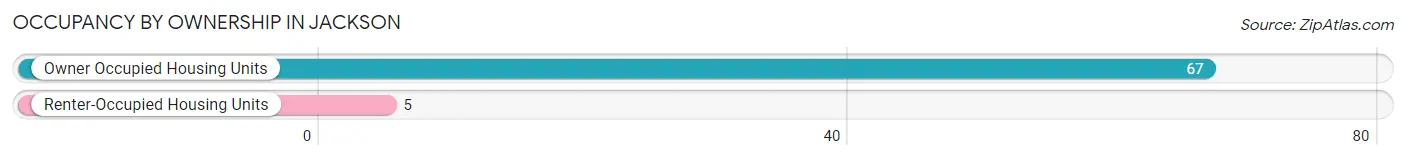
| Occupancy | # Housing Units | % Housing Units |
| Owner Occupied Housing Units | 67 | 93.1% |
| Renter-Occupied Housing Units | 5 | 6.9% |
| Total Occupied Housing Units | 72 | 100.0% |
Occupancy by Household Size in Jackson
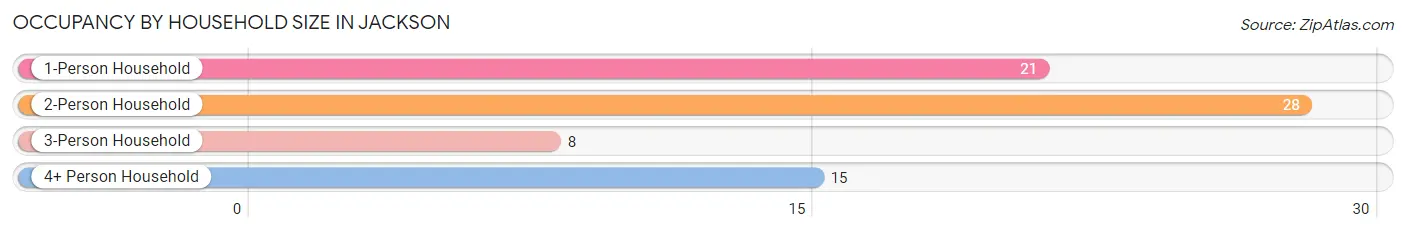
| Household Size | # Housing Units | % Housing Units |
| 1-Person Household | 21 | 29.2% |
| 2-Person Household | 28 | 38.9% |
| 3-Person Household | 8 | 11.1% |
| 4+ Person Household | 15 | 20.8% |
| Total Housing Units | 72 | 100.0% |
Occupancy by Ownership by Household Size in Jackson
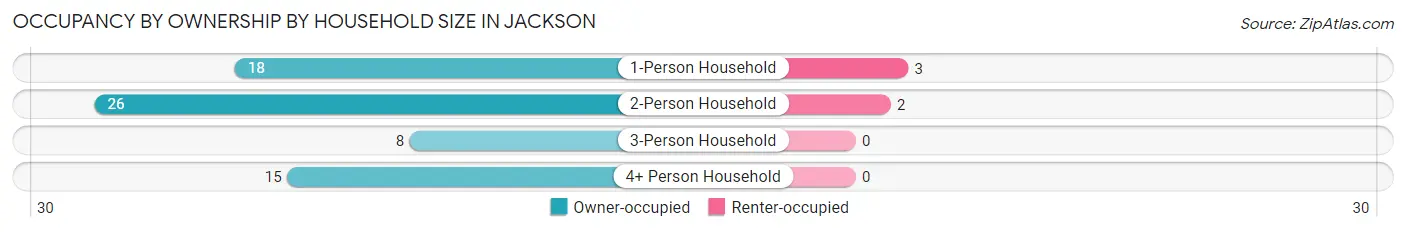
| Household Size | Owner-occupied | Renter-occupied |
| 1-Person Household | 18 (85.7%) | 3 (14.3%) |
| 2-Person Household | 26 (92.9%) | 2 (7.1%) |
| 3-Person Household | 8 (100.0%) | 0 (0.0%) |
| 4+ Person Household | 15 (100.0%) | 0 (0.0%) |
| Total Housing Units | 67 (93.1%) | 5 (6.9%) |
Occupancy by Educational Attainment in Jackson
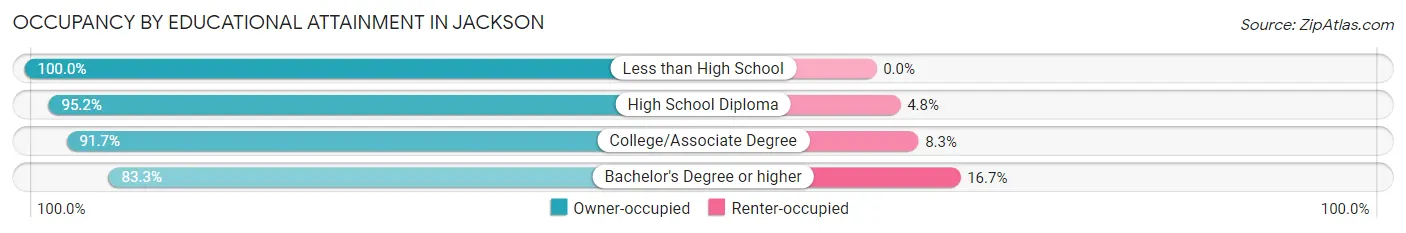
| Household Size | Owner-occupied | Renter-occupied |
| Less than High School | 15 (100.0%) | 0 (0.0%) |
| High School Diploma | 20 (95.2%) | 1 (4.8%) |
| College/Associate Degree | 22 (91.7%) | 2 (8.3%) |
| Bachelor's Degree or higher | 10 (83.3%) | 2 (16.7%) |
Occupancy by Age of Householder in Jackson
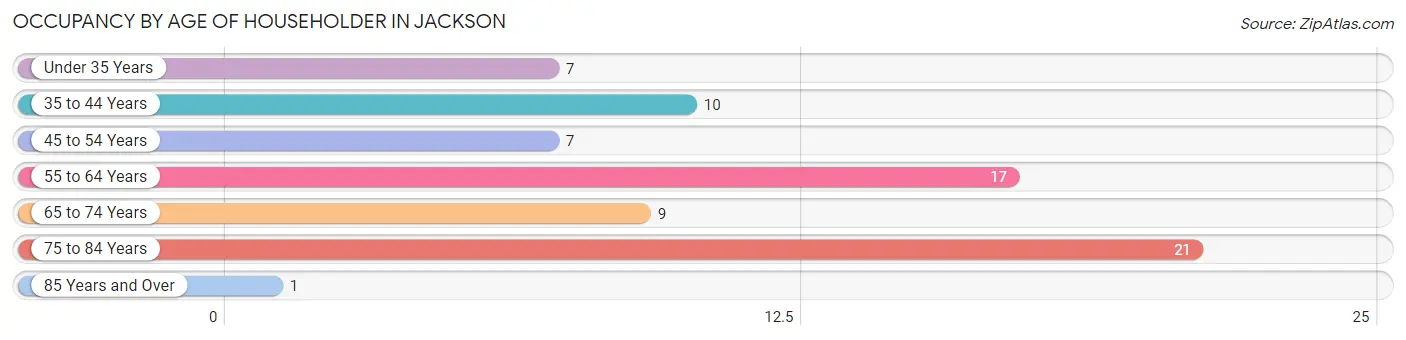
| Age Bracket | # Households | % Households |
| Under 35 Years | 7 | 9.7% |
| 35 to 44 Years | 10 | 13.9% |
| 45 to 54 Years | 7 | 9.7% |
| 55 to 64 Years | 17 | 23.6% |
| 65 to 74 Years | 9 | 12.5% |
| 75 to 84 Years | 21 | 29.2% |
| 85 Years and Over | 1 | 1.4% |
| Total | 72 | 100.0% |
Housing Finances in Jackson
Median Income by Occupancy in Jackson
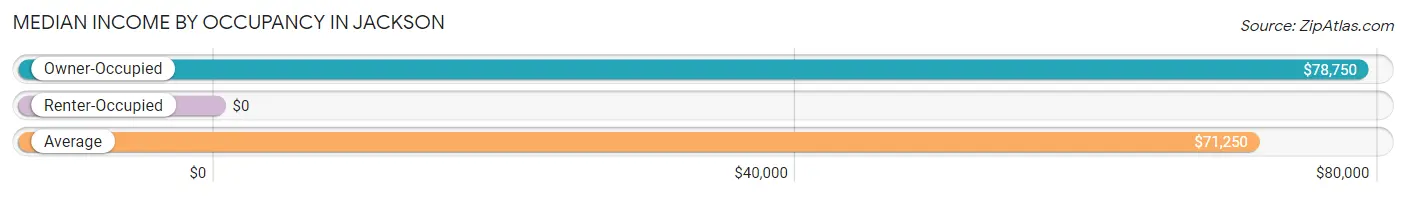
| Occupancy Type | # Households | Median Income |
| Owner-Occupied | 67 (93.1%) | $78,750 |
| Renter-Occupied | 5 (6.9%) | $0 |
| Average | 72 (100.0%) | $71,250 |
Occupancy by Householder Income Bracket in Jackson
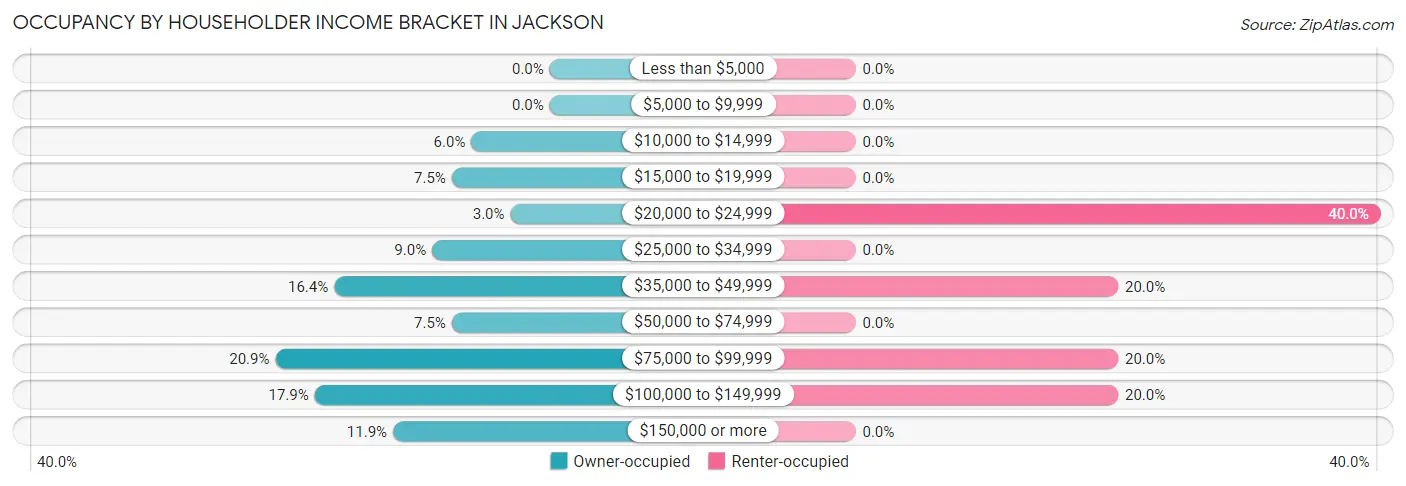
| Income Bracket | Owner-occupied | Renter-occupied |
| Less than $5,000 | 0 (0.0%) | 0 (0.0%) |
| $5,000 to $9,999 | 0 (0.0%) | 0 (0.0%) |
| $10,000 to $14,999 | 4 (6.0%) | 0 (0.0%) |
| $15,000 to $19,999 | 5 (7.5%) | 0 (0.0%) |
| $20,000 to $24,999 | 2 (3.0%) | 2 (40.0%) |
| $25,000 to $34,999 | 6 (9.0%) | 0 (0.0%) |
| $35,000 to $49,999 | 11 (16.4%) | 1 (20.0%) |
| $50,000 to $74,999 | 5 (7.5%) | 0 (0.0%) |
| $75,000 to $99,999 | 14 (20.9%) | 1 (20.0%) |
| $100,000 to $149,999 | 12 (17.9%) | 1 (20.0%) |
| $150,000 or more | 8 (11.9%) | 0 (0.0%) |
| Total | 67 (100.0%) | 5 (100.0%) |
Monthly Housing Cost Tiers in Jackson
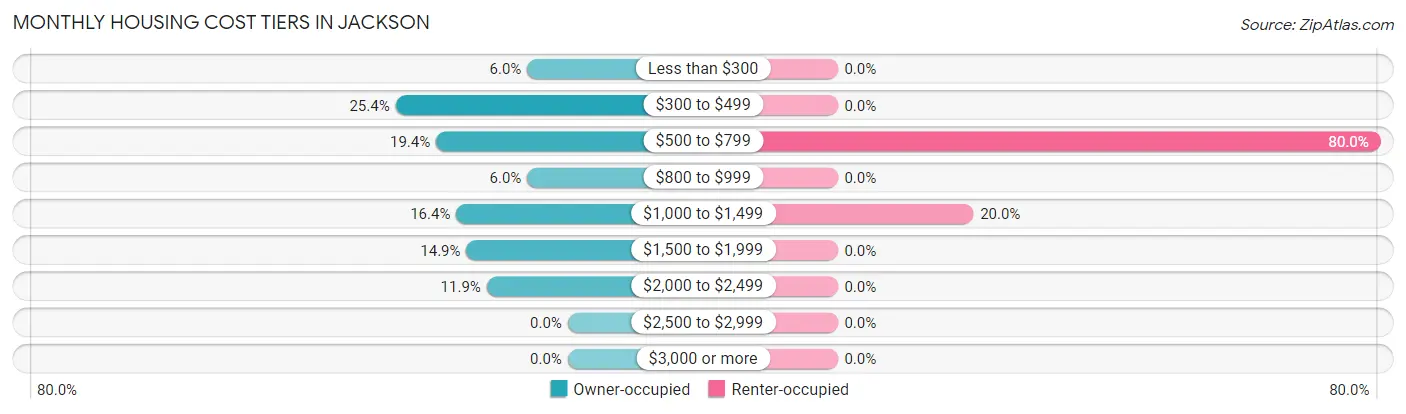
| Monthly Cost | Owner-occupied | Renter-occupied |
| Less than $300 | 4 (6.0%) | 0 (0.0%) |
| $300 to $499 | 17 (25.4%) | 0 (0.0%) |
| $500 to $799 | 13 (19.4%) | 4 (80.0%) |
| $800 to $999 | 4 (6.0%) | 0 (0.0%) |
| $1,000 to $1,499 | 11 (16.4%) | 1 (20.0%) |
| $1,500 to $1,999 | 10 (14.9%) | 0 (0.0%) |
| $2,000 to $2,499 | 8 (11.9%) | 0 (0.0%) |
| $2,500 to $2,999 | 0 (0.0%) | 0 (0.0%) |
| $3,000 or more | 0 (0.0%) | 0 (0.0%) |
| Total | 67 (100.0%) | 5 (100.0%) |
Physical Housing Characteristics in Jackson
Housing Structures in Jackson
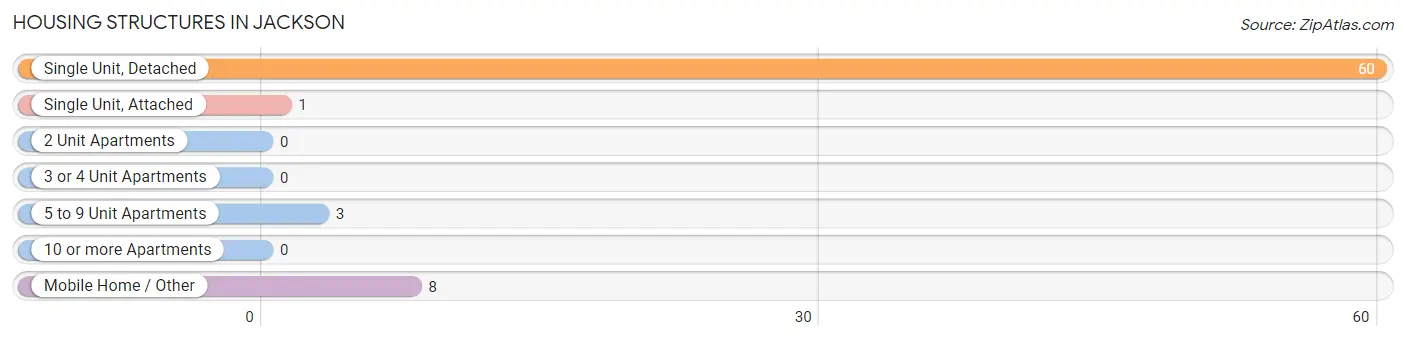
| Structure Type | # Housing Units | % Housing Units |
| Single Unit, Detached | 60 | 83.3% |
| Single Unit, Attached | 1 | 1.4% |
| 2 Unit Apartments | 0 | 0.0% |
| 3 or 4 Unit Apartments | 0 | 0.0% |
| 5 to 9 Unit Apartments | 3 | 4.2% |
| 10 or more Apartments | 0 | 0.0% |
| Mobile Home / Other | 8 | 11.1% |
| Total | 72 | 100.0% |
Housing Structures by Occupancy in Jackson
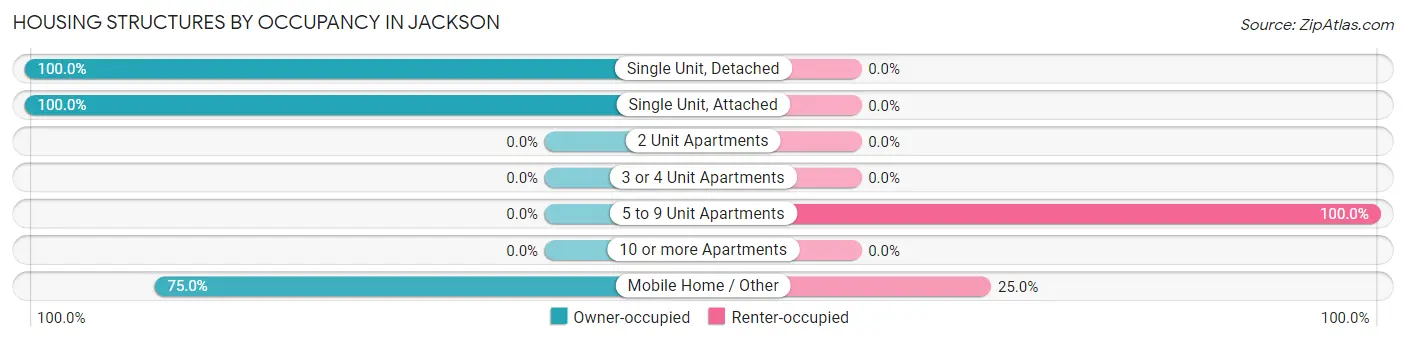
| Structure Type | Owner-occupied | Renter-occupied |
| Single Unit, Detached | 60 (100.0%) | 0 (0.0%) |
| Single Unit, Attached | 1 (100.0%) | 0 (0.0%) |
| 2 Unit Apartments | 0 (0.0%) | 0 (0.0%) |
| 3 or 4 Unit Apartments | 0 (0.0%) | 0 (0.0%) |
| 5 to 9 Unit Apartments | 0 (0.0%) | 3 (100.0%) |
| 10 or more Apartments | 0 (0.0%) | 0 (0.0%) |
| Mobile Home / Other | 6 (75.0%) | 2 (25.0%) |
| Total | 67 (93.1%) | 5 (6.9%) |
Housing Structures by Number of Rooms in Jackson
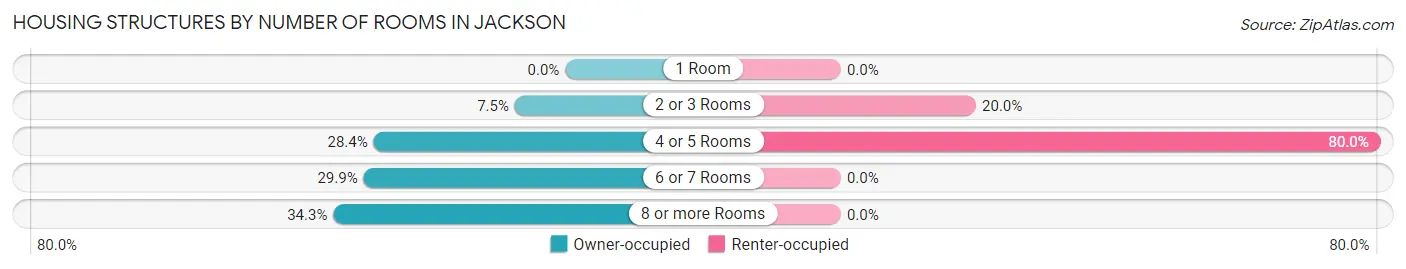
| Number of Rooms | Owner-occupied | Renter-occupied |
| 1 Room | 0 (0.0%) | 0 (0.0%) |
| 2 or 3 Rooms | 5 (7.5%) | 1 (20.0%) |
| 4 or 5 Rooms | 19 (28.4%) | 4 (80.0%) |
| 6 or 7 Rooms | 20 (29.8%) | 0 (0.0%) |
| 8 or more Rooms | 23 (34.3%) | 0 (0.0%) |
| Total | 67 (100.0%) | 5 (100.0%) |
Housing Structure by Heating Type in Jackson
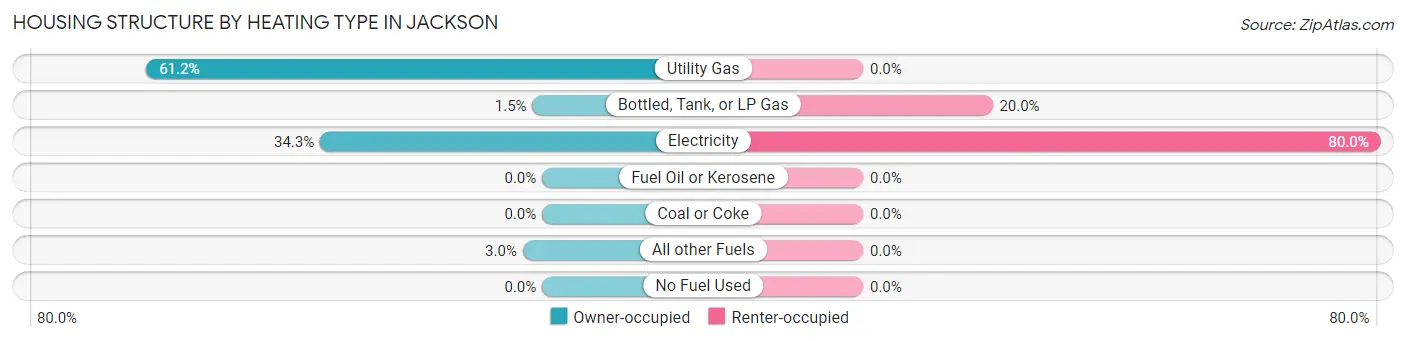
| Heating Type | Owner-occupied | Renter-occupied |
| Utility Gas | 41 (61.2%) | 0 (0.0%) |
| Bottled, Tank, or LP Gas | 1 (1.5%) | 1 (20.0%) |
| Electricity | 23 (34.3%) | 4 (80.0%) |
| Fuel Oil or Kerosene | 0 (0.0%) | 0 (0.0%) |
| Coal or Coke | 0 (0.0%) | 0 (0.0%) |
| All other Fuels | 2 (3.0%) | 0 (0.0%) |
| No Fuel Used | 0 (0.0%) | 0 (0.0%) |
| Total | 67 (100.0%) | 5 (100.0%) |
Household Vehicle Usage in Jackson
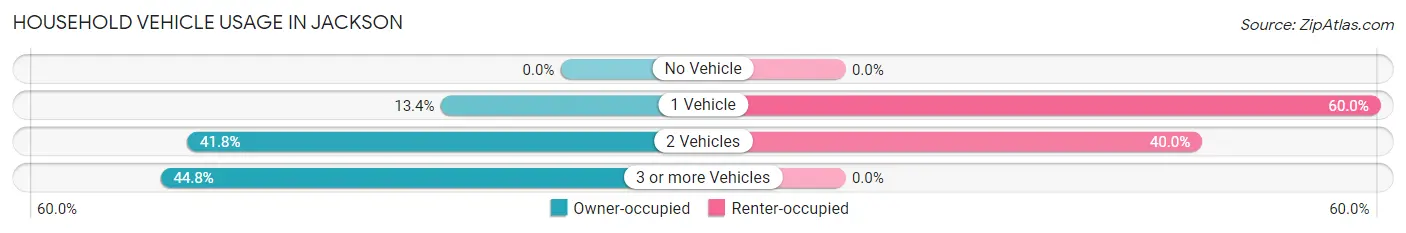
| Vehicles per Household | Owner-occupied | Renter-occupied |
| No Vehicle | 0 (0.0%) | 0 (0.0%) |
| 1 Vehicle | 9 (13.4%) | 3 (60.0%) |
| 2 Vehicles | 28 (41.8%) | 2 (40.0%) |
| 3 or more Vehicles | 30 (44.8%) | 0 (0.0%) |
| Total | 67 (100.0%) | 5 (100.0%) |
Real Estate & Mortgages in Jackson
Real Estate and Mortgage Overview in Jackson
| Characteristic | Without Mortgage | With Mortgage |
| Housing Units | 36 | 31 |
| Median Property Value | $116,700 | $173,900 |
| Median Household Income | $38,125 | $7 |
| Monthly Housing Costs | $470 | $0 |
| Real Estate Taxes | $1,625 | $0 |
Property Value by Mortgage Status in Jackson
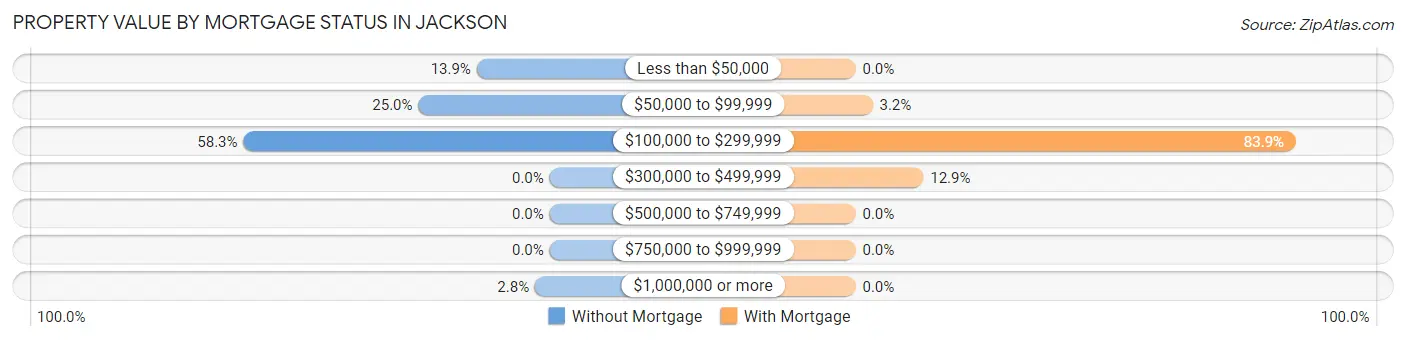
| Property Value | Without Mortgage | With Mortgage |
| Less than $50,000 | 5 (13.9%) | 0 (0.0%) |
| $50,000 to $99,999 | 9 (25.0%) | 1 (3.2%) |
| $100,000 to $299,999 | 21 (58.3%) | 26 (83.9%) |
| $300,000 to $499,999 | 0 (0.0%) | 4 (12.9%) |
| $500,000 to $749,999 | 0 (0.0%) | 0 (0.0%) |
| $750,000 to $999,999 | 0 (0.0%) | 0 (0.0%) |
| $1,000,000 or more | 1 (2.8%) | 0 (0.0%) |
| Total | 36 (100.0%) | 31 (100.0%) |
Household Income by Mortgage Status in Jackson
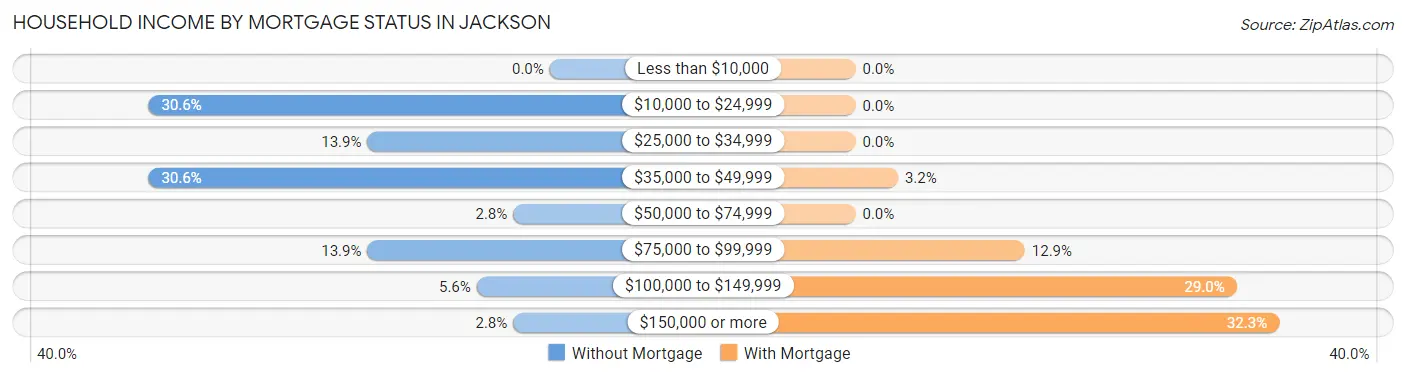
| Household Income | Without Mortgage | With Mortgage |
| Less than $10,000 | 0 (0.0%) | 0 (0.0%) |
| $10,000 to $24,999 | 11 (30.6%) | 0 (0.0%) |
| $25,000 to $34,999 | 5 (13.9%) | 0 (0.0%) |
| $35,000 to $49,999 | 11 (30.6%) | 1 (3.2%) |
| $50,000 to $74,999 | 1 (2.8%) | 0 (0.0%) |
| $75,000 to $99,999 | 5 (13.9%) | 4 (12.9%) |
| $100,000 to $149,999 | 2 (5.6%) | 9 (29.0%) |
| $150,000 or more | 1 (2.8%) | 10 (32.3%) |
| Total | 36 (100.0%) | 31 (100.0%) |
Property Value to Household Income Ratio in Jackson
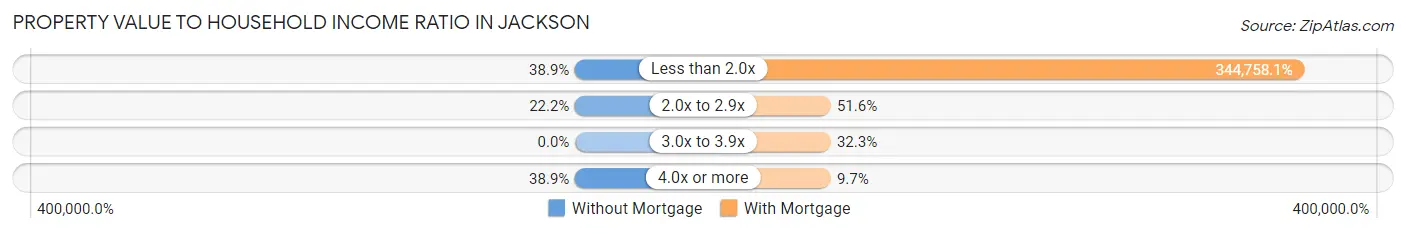
| Value-to-Income Ratio | Without Mortgage | With Mortgage |
| Less than 2.0x | 14 (38.9%) | 106,875 (344,758.1%) |
| 2.0x to 2.9x | 8 (22.2%) | 16 (51.6%) |
| 3.0x to 3.9x | 0 (0.0%) | 10 (32.3%) |
| 4.0x or more | 14 (38.9%) | 3 (9.7%) |
| Total | 36 (100.0%) | 31 (100.0%) |
Real Estate Taxes by Mortgage Status in Jackson
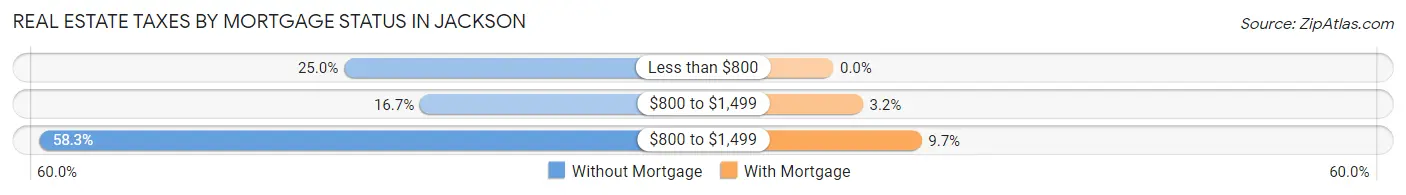
| Property Taxes | Without Mortgage | With Mortgage |
| Less than $800 | 9 (25.0%) | 0 (0.0%) |
| $800 to $1,499 | 6 (16.7%) | 1 (3.2%) |
| $800 to $1,499 | 21 (58.3%) | 3 (9.7%) |
| Total | 36 (100.0%) | 31 (100.0%) |
Health & Disability in Jackson
Health Insurance Coverage by Age in Jackson
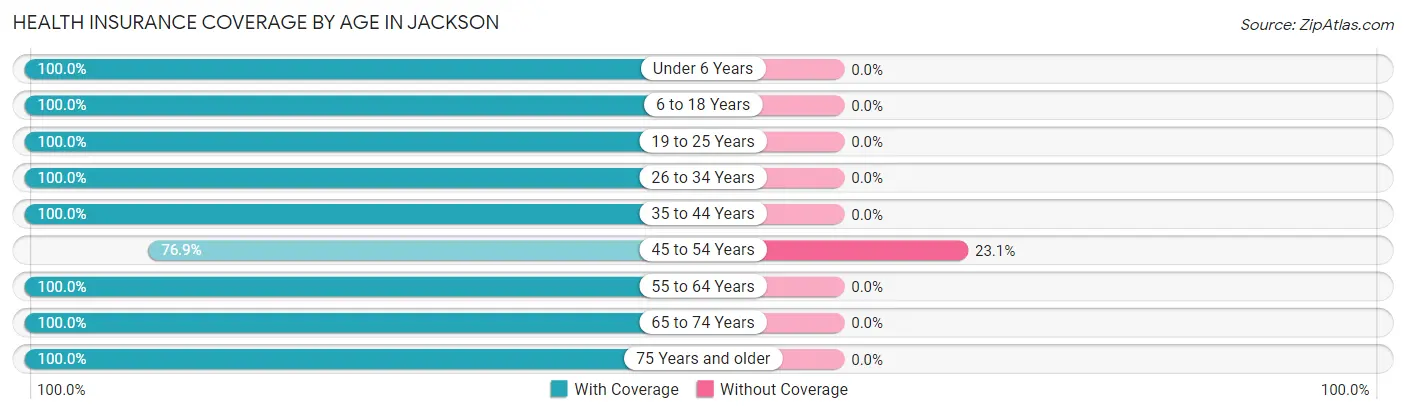
| Age Bracket | With Coverage | Without Coverage |
| Under 6 Years | 44 (100.0%) | 0 (0.0%) |
| 6 to 18 Years | 51 (100.0%) | 0 (0.0%) |
| 19 to 25 Years | 31 (100.0%) | 0 (0.0%) |
| 26 to 34 Years | 10 (100.0%) | 0 (0.0%) |
| 35 to 44 Years | 26 (100.0%) | 0 (0.0%) |
| 45 to 54 Years | 20 (76.9%) | 6 (23.1%) |
| 55 to 64 Years | 30 (100.0%) | 0 (0.0%) |
| 65 to 74 Years | 14 (100.0%) | 0 (0.0%) |
| 75 Years and older | 26 (100.0%) | 0 (0.0%) |
| Total | 252 (97.7%) | 6 (2.3%) |
Health Insurance Coverage by Citizenship Status in Jackson
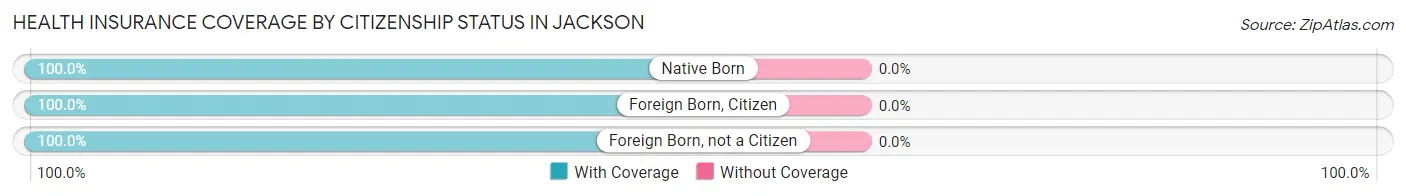
| Citizenship Status | With Coverage | Without Coverage |
| Native Born | 44 (100.0%) | 0 (0.0%) |
| Foreign Born, Citizen | 51 (100.0%) | 0 (0.0%) |
| Foreign Born, not a Citizen | 31 (100.0%) | 0 (0.0%) |
Health Insurance Coverage by Household Income in Jackson
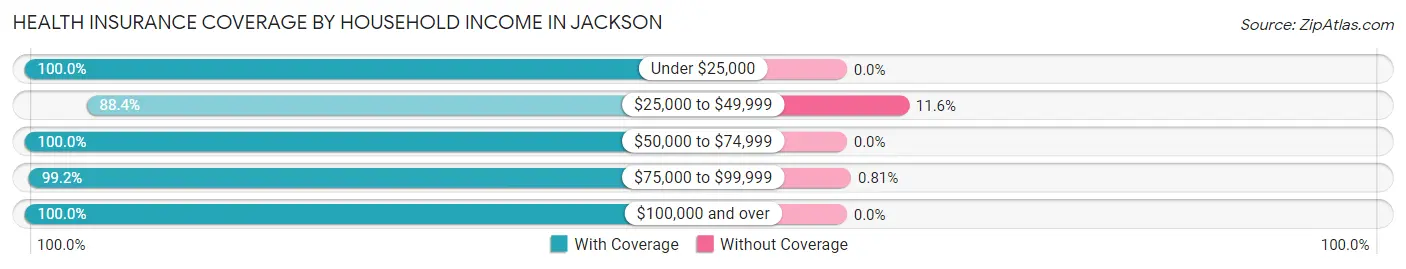
| Household Income | With Coverage | Without Coverage |
| Under $25,000 | 13 (100.0%) | 0 (0.0%) |
| $25,000 to $49,999 | 38 (88.4%) | 5 (11.6%) |
| $50,000 to $74,999 | 8 (100.0%) | 0 (0.0%) |
| $75,000 to $99,999 | 123 (99.2%) | 1 (0.8%) |
| $100,000 and over | 70 (100.0%) | 0 (0.0%) |
Public vs Private Health Insurance Coverage by Age in Jackson
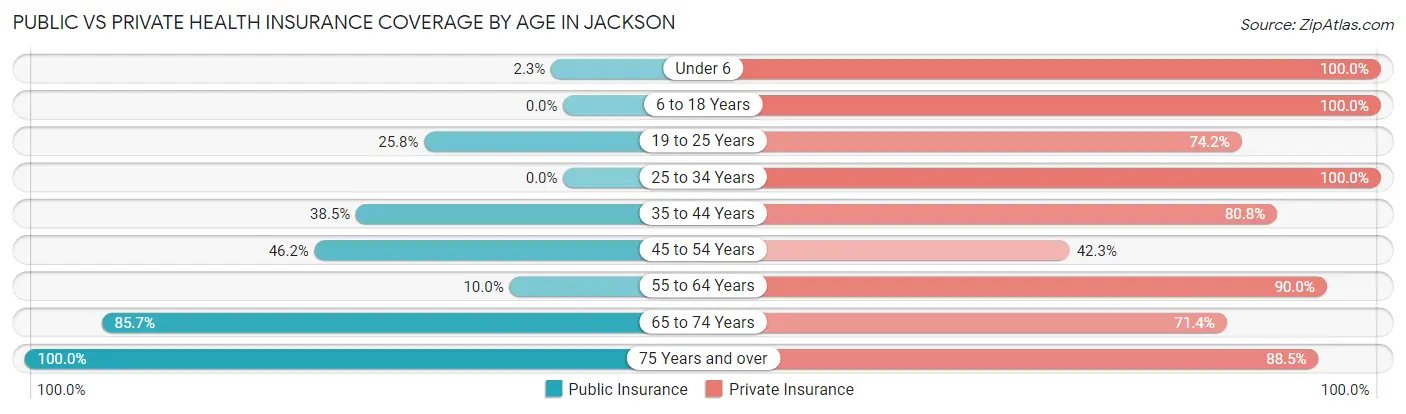
| Age Bracket | Public Insurance | Private Insurance |
| Under 6 | 1 (2.3%) | 44 (100.0%) |
| 6 to 18 Years | 0 (0.0%) | 51 (100.0%) |
| 19 to 25 Years | 8 (25.8%) | 23 (74.2%) |
| 25 to 34 Years | 0 (0.0%) | 10 (100.0%) |
| 35 to 44 Years | 10 (38.5%) | 21 (80.8%) |
| 45 to 54 Years | 12 (46.2%) | 11 (42.3%) |
| 55 to 64 Years | 3 (10.0%) | 27 (90.0%) |
| 65 to 74 Years | 12 (85.7%) | 10 (71.4%) |
| 75 Years and over | 26 (100.0%) | 23 (88.5%) |
| Total | 72 (27.9%) | 220 (85.3%) |
Disability Status by Sex by Age in Jackson
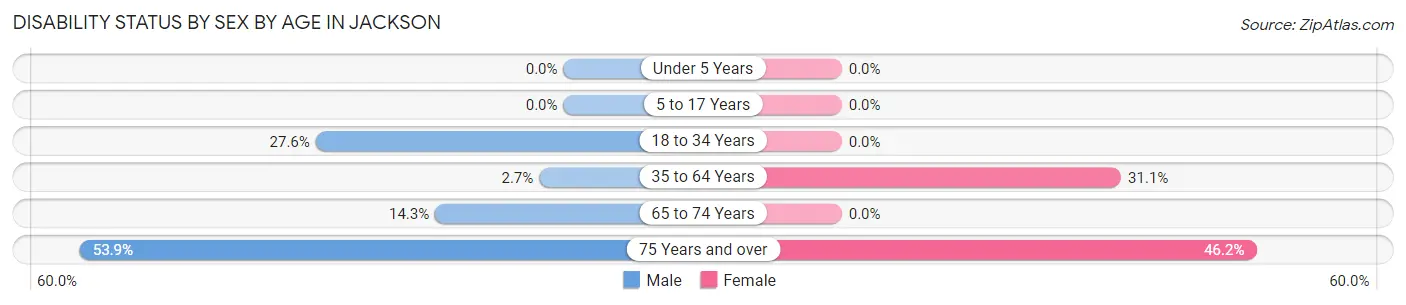
| Age Bracket | Male | Female |
| Under 5 Years | 0 (0.0%) | 0 (0.0%) |
| 5 to 17 Years | 0 (0.0%) | 0 (0.0%) |
| 18 to 34 Years | 8 (27.6%) | 0 (0.0%) |
| 35 to 64 Years | 1 (2.7%) | 14 (31.1%) |
| 65 to 74 Years | 1 (14.3%) | 0 (0.0%) |
| 75 Years and over | 7 (53.8%) | 6 (46.2%) |
Disability Class by Sex by Age in Jackson
Disability Class: Hearing Difficulty
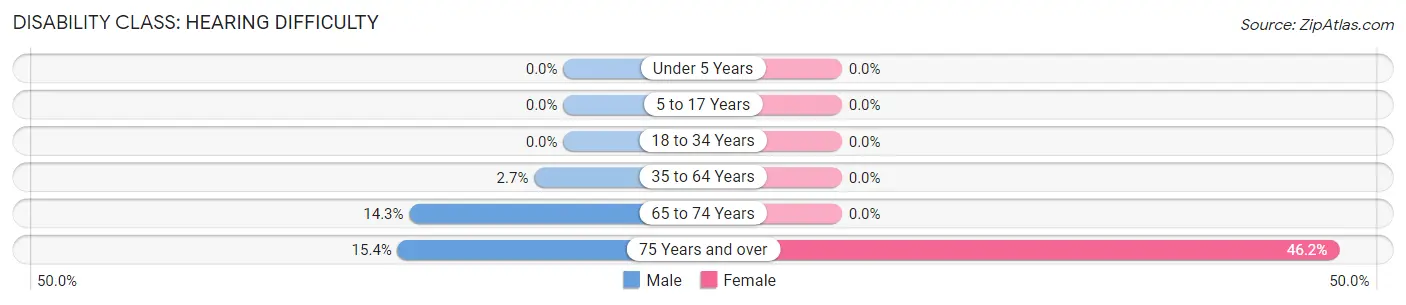
| Age Bracket | Male | Female |
| Under 5 Years | 0 (0.0%) | 0 (0.0%) |
| 5 to 17 Years | 0 (0.0%) | 0 (0.0%) |
| 18 to 34 Years | 0 (0.0%) | 0 (0.0%) |
| 35 to 64 Years | 1 (2.7%) | 0 (0.0%) |
| 65 to 74 Years | 1 (14.3%) | 0 (0.0%) |
| 75 Years and over | 2 (15.4%) | 6 (46.2%) |
Disability Class: Vision Difficulty
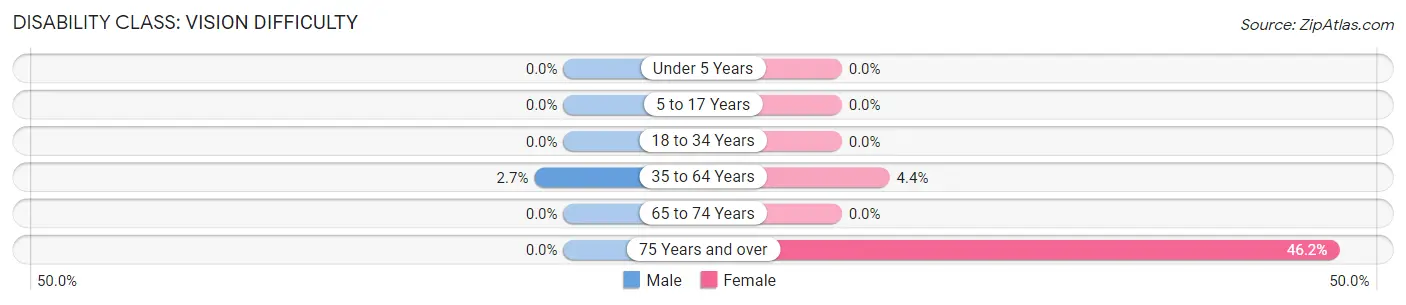
| Age Bracket | Male | Female |
| Under 5 Years | 0 (0.0%) | 0 (0.0%) |
| 5 to 17 Years | 0 (0.0%) | 0 (0.0%) |
| 18 to 34 Years | 0 (0.0%) | 0 (0.0%) |
| 35 to 64 Years | 1 (2.7%) | 2 (4.4%) |
| 65 to 74 Years | 0 (0.0%) | 0 (0.0%) |
| 75 Years and over | 0 (0.0%) | 6 (46.2%) |
Disability Class: Cognitive Difficulty
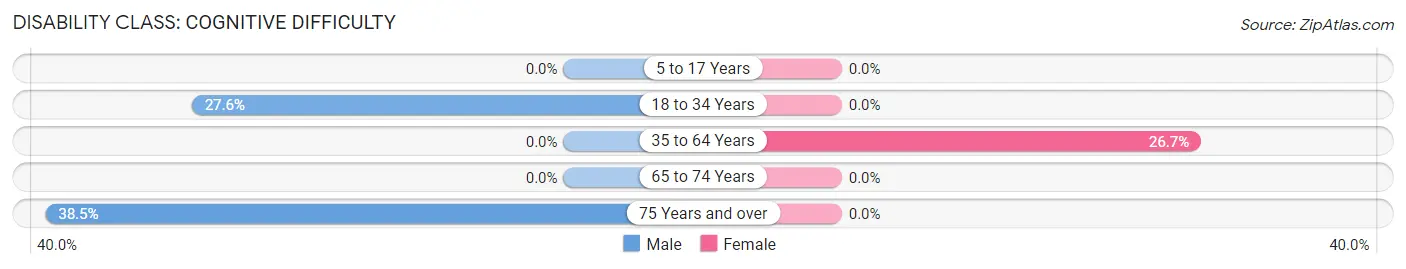
| Age Bracket | Male | Female |
| 5 to 17 Years | 0 (0.0%) | 0 (0.0%) |
| 18 to 34 Years | 8 (27.6%) | 0 (0.0%) |
| 35 to 64 Years | 0 (0.0%) | 12 (26.7%) |
| 65 to 74 Years | 0 (0.0%) | 0 (0.0%) |
| 75 Years and over | 5 (38.5%) | 0 (0.0%) |
Disability Class: Ambulatory Difficulty
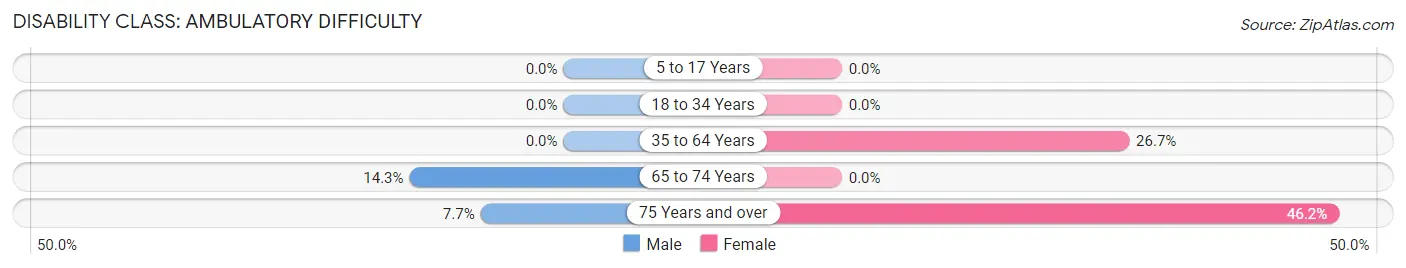
| Age Bracket | Male | Female |
| 5 to 17 Years | 0 (0.0%) | 0 (0.0%) |
| 18 to 34 Years | 0 (0.0%) | 0 (0.0%) |
| 35 to 64 Years | 0 (0.0%) | 12 (26.7%) |
| 65 to 74 Years | 1 (14.3%) | 0 (0.0%) |
| 75 Years and over | 1 (7.7%) | 6 (46.2%) |
Disability Class: Self-Care Difficulty
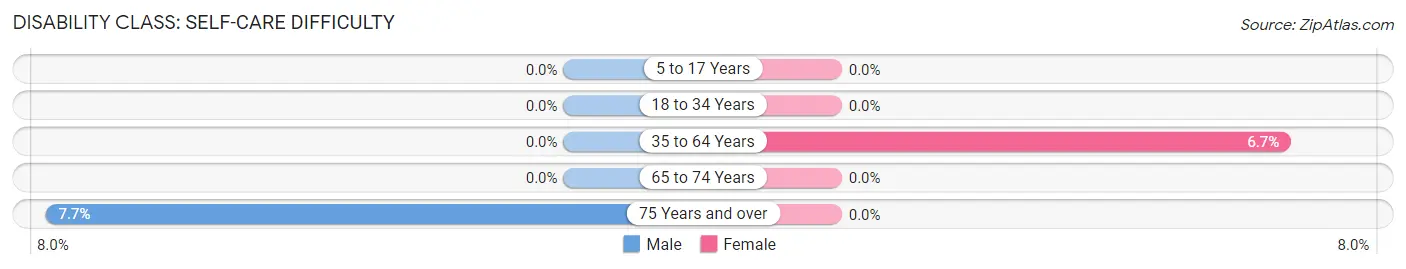
| Age Bracket | Male | Female |
| 5 to 17 Years | 0 (0.0%) | 0 (0.0%) |
| 18 to 34 Years | 0 (0.0%) | 0 (0.0%) |
| 35 to 64 Years | 0 (0.0%) | 3 (6.7%) |
| 65 to 74 Years | 0 (0.0%) | 0 (0.0%) |
| 75 Years and over | 1 (7.7%) | 0 (0.0%) |
Technology Access in Jackson
Computing Device Access in Jackson
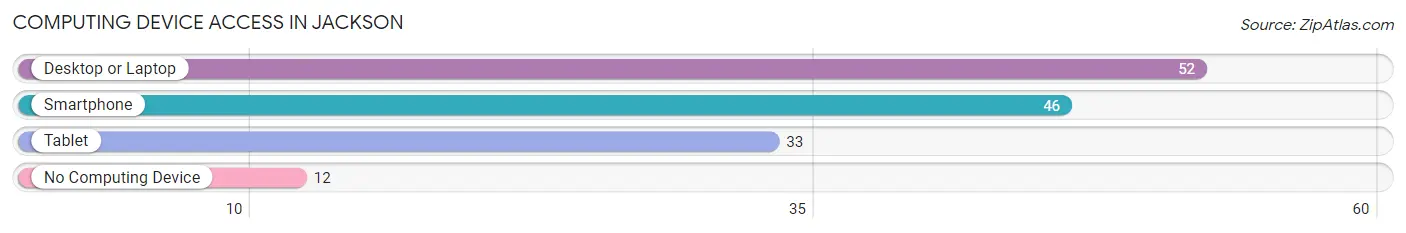
| Device Type | # Households | % Households |
| Desktop or Laptop | 52 | 72.2% |
| Smartphone | 46 | 63.9% |
| Tablet | 33 | 45.8% |
| No Computing Device | 12 | 16.7% |
| Total | 72 | 100.0% |
Internet Access in Jackson
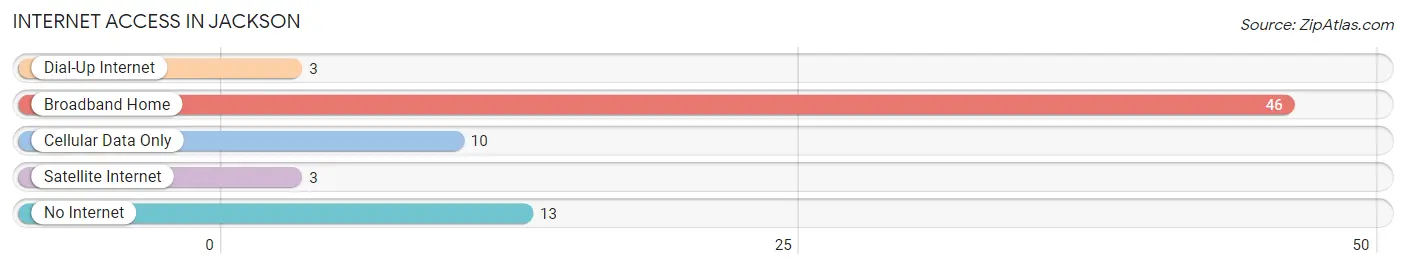
| Internet Type | # Households | % Households |
| Dial-Up Internet | 3 | 4.2% |
| Broadband Home | 46 | 63.9% |
| Cellular Data Only | 10 | 13.9% |
| Satellite Internet | 3 | 4.2% |
| No Internet | 13 | 18.1% |
| Total | 72 | 100.0% |
Jackson Summary
Jackson, Nebraska is a small city located in the southeastern corner of the state. It is the county seat of Dakota County and is located on the banks of the Missouri River. The city has a population of approximately 1,500 people and is part of the Sioux City, Iowa-Nebraska-South Dakota metropolitan area.
History
Jackson was founded in 1856 by a group of settlers from the nearby town of Dakota City. The town was named after President Andrew Jackson and was originally intended to be a trading post for the local Native American tribes. The town quickly grew and by the late 1800s, it had become a major hub for the area’s agricultural and livestock industries.
In the early 1900s, Jackson began to experience a period of growth and development. The city was incorporated in 1909 and the first mayor was elected in 1910. During this time, the city saw the construction of several new buildings, including a school, a bank, and a post office.
In the 1920s, Jackson experienced a period of decline as the agricultural and livestock industries began to decline. The Great Depression further exacerbated the city’s economic woes and by the 1940s, the population had dropped to just over 500 people.
In the 1950s, Jackson began to experience a period of revitalization. The city was able to attract new businesses and industries, including a meat packing plant and a grain elevator. The population began to grow again and by the 1970s, the population had reached 1,500 people.
Geography
Jackson is located in the southeastern corner of Nebraska, on the banks of the Missouri River. The city is situated in a flat, open area and is surrounded by rolling hills and farmland. The city is located approximately 30 miles from Sioux City, Iowa and is part of the Sioux City, Iowa-Nebraska-South Dakota metropolitan area.
Economy
Jackson’s economy is largely based on agriculture and livestock. The city is home to several large farms and ranches, as well as a meat packing plant and a grain elevator. The city also has a small manufacturing sector, which produces a variety of products, including furniture, clothing, and electronics.
Demographics
As of the 2010 census, Jackson had a population of 1,500 people. The racial makeup of the city was 95.3% White, 0.7% African American, 0.7% Native American, 0.3% Asian, 0.3% from other races, and 2.7% from two or more races. Hispanic or Latino of any race were 1.3% of the population.
The median income for a household in Jackson was $37,500, and the median income for a family was $45,000. The per capita income for the city was $18,000. About 11.7% of families and 14.3% of the population were below the poverty line, including 18.2% of those under age 18 and 8.3% of those age 65 or over.
Conclusion
Jackson, Nebraska is a small city located in the southeastern corner of the state. It is the county seat of Dakota County and is located on the banks of the Missouri River. The city has a population of approximately 1,500 people and is part of the Sioux City, Iowa-Nebraska-South Dakota metropolitan area. The city’s economy is largely based on agriculture and livestock, and it also has a small manufacturing sector. The racial makeup of the city is predominantly White, with a small percentage of African American, Native American, and Asian residents. The median income for a household in Jackson is $37,500, and the per capita income is $18,000.
Common Questions
What is the Total Population of Jackson?
Total Population of Jackson is 258.
What is the Total Male Population of Jackson?
Total Male Population of Jackson is 136.
What is the Total Female Population of Jackson?
Total Female Population of Jackson is 122.
What is the Ratio of Males per 100 Females in Jackson?
There are 111.48 Males per 100 Females in Jackson.
What is the Ratio of Females per 100 Males in Jackson?
There are 89.71 Females per 100 Males in Jackson.
What is the Median Population Age in Jackson?
Median Population Age in Jackson is 27.7 Years.
What is the Average Family Size in Jackson
Average Family Size in Jackson is 4.7 People.
What is the Average Household Size in Jackson
Average Household Size in Jackson is 3.6 People.
What is Per Capita Income in Jackson?
Per Capita income in Jackson is $24,169.
What is the Median Family Income in Jackson?
Median Family Income in Jackson is $84,107.
What is the Median Household income in Jackson?
Median Household Income in Jackson is $71,250.
What is Income or Wage Gap in Jackson?
Income or Wage Gap in Jackson is 15.4%.
Women in Jackson earn 84.6 cents for every dollar earned by a man.
What is Inequality or Gini Index in Jackson?
Inequality or Gini Index in Jackson is 0.39.
How Large is the Labor Force in Jackson?
There are 107 People in the Labor Forcein in Jackson.
What is the Percentage of People in the Labor Force in Jackson?
63.3% of People are in the Labor Force in Jackson.
What is the Unemployment Rate in Jackson?
Unemployment Rate in Jackson is 7.5%.