Pickrell, NE
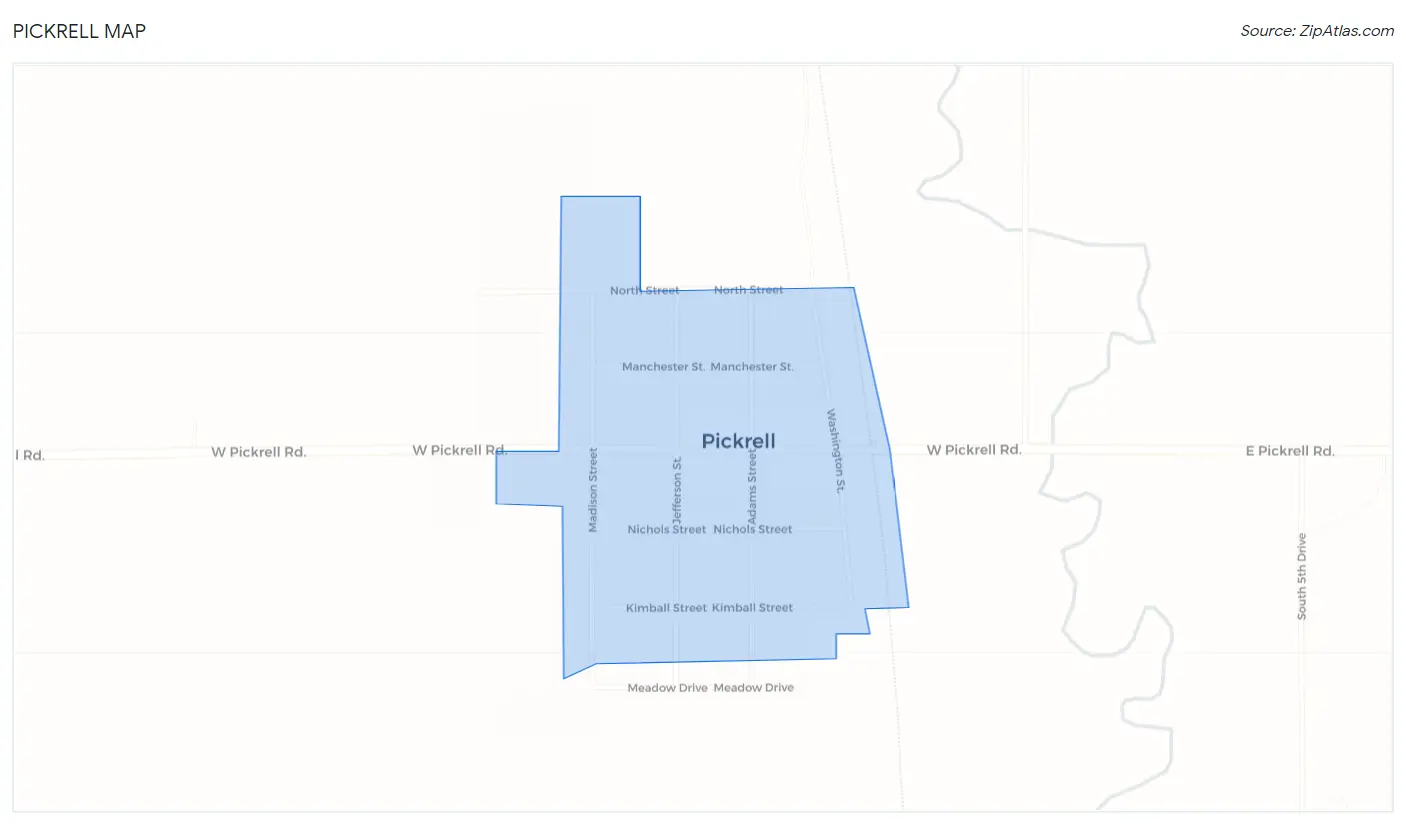
Pickrell Map
Pickrell Overview
221
TOTAL POPULATION
116
MALE POPULATION
105
FEMALE POPULATION
110.48
MALES / 100 FEMALES
90.52
FEMALES / 100 MALES
39.5
MEDIAN AGE
2.9
AVG FAMILY SIZE
2.5
AVG HOUSEHOLD SIZE
$32,600
PER CAPITA INCOME
$83,750
AVG FAMILY INCOME
$67,917
AVG HOUSEHOLD INCOME
39.2%
WAGE / INCOME GAP [ % ]
60.8¢/ $1
WAGE / INCOME GAP [ $ ]
0.34
INEQUALITY / GINI INDEX
99
LABOR FORCE [ PEOPLE ]
62.3%
PERCENT IN LABOR FORCE
Pickrell Zip Codes
Pickrell Area Codes
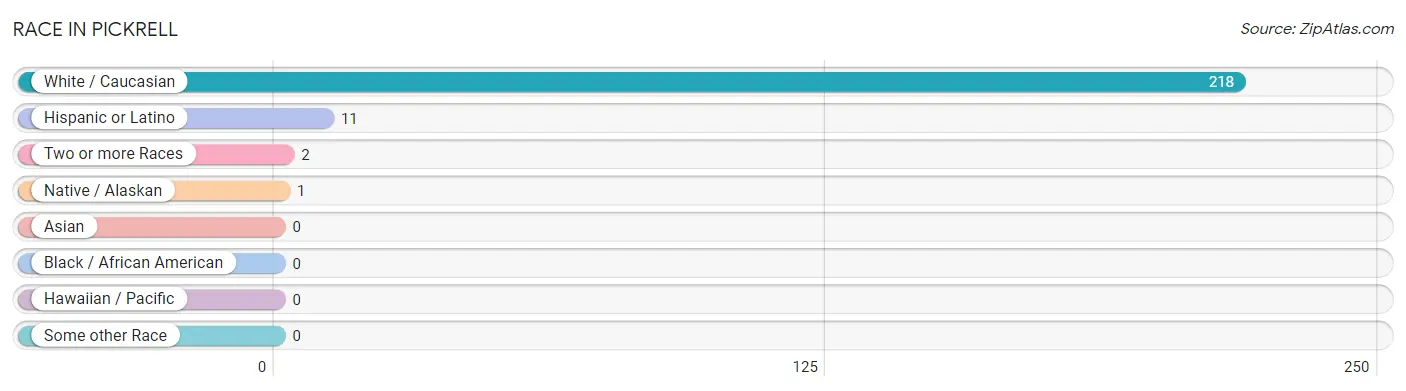
Race in Pickrell
The most populous races in Pickrell are White / Caucasian (218 | 98.6%), Hispanic or Latino (11 | 5.0%), and Two or more Races (2 | 0.9%).
| Race | # Population | % Population |
| Asian | 0 | 0.0% |
| Black / African American | 0 | 0.0% |
| Hawaiian / Pacific | 0 | 0.0% |
| Hispanic or Latino | 11 | 5.0% |
| Native / Alaskan | 1 | 0.4% |
| White / Caucasian | 218 | 98.6% |
| Two or more Races | 2 | 0.9% |
| Some other Race | 0 | 0.0% |
| Total | 221 | 100.0% |
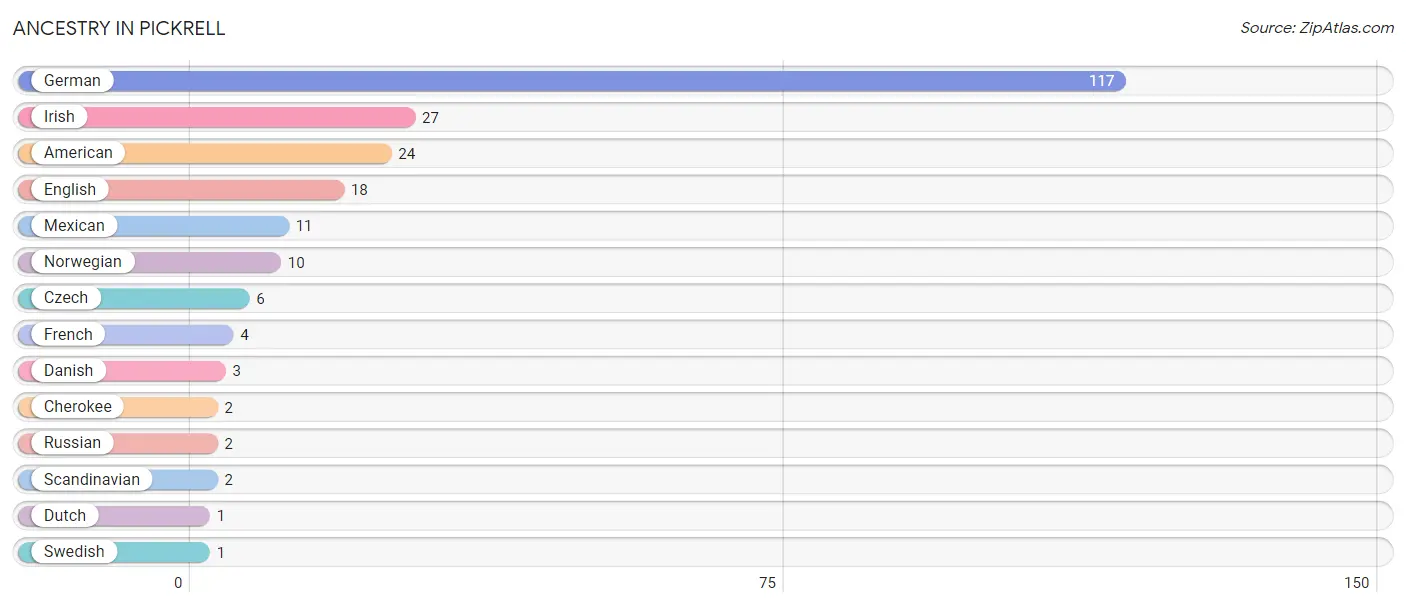
Ancestry in Pickrell
The most populous ancestries reported in Pickrell are German (117 | 52.9%), Irish (27 | 12.2%), American (24 | 10.9%), English (18 | 8.1%), and Mexican (11 | 5.0%), together accounting for 89.1% of all Pickrell residents.
| Ancestry | # Population | % Population |
| American | 24 | 10.9% |
| Cherokee | 2 | 0.9% |
| Czech | 6 | 2.7% |
| Danish | 3 | 1.4% |
| Dutch | 1 | 0.4% |
| English | 18 | 8.1% |
| French | 4 | 1.8% |
| German | 117 | 52.9% |
| Irish | 27 | 12.2% |
| Mexican | 11 | 5.0% |
| Norwegian | 10 | 4.5% |
| Russian | 2 | 0.9% |
| Scandinavian | 2 | 0.9% |
| Swedish | 1 | 0.4% | View All 14 Rows |
Immigrants in Pickrell

| Immigration Origin | # Population | % Population | View All 0 Rows |
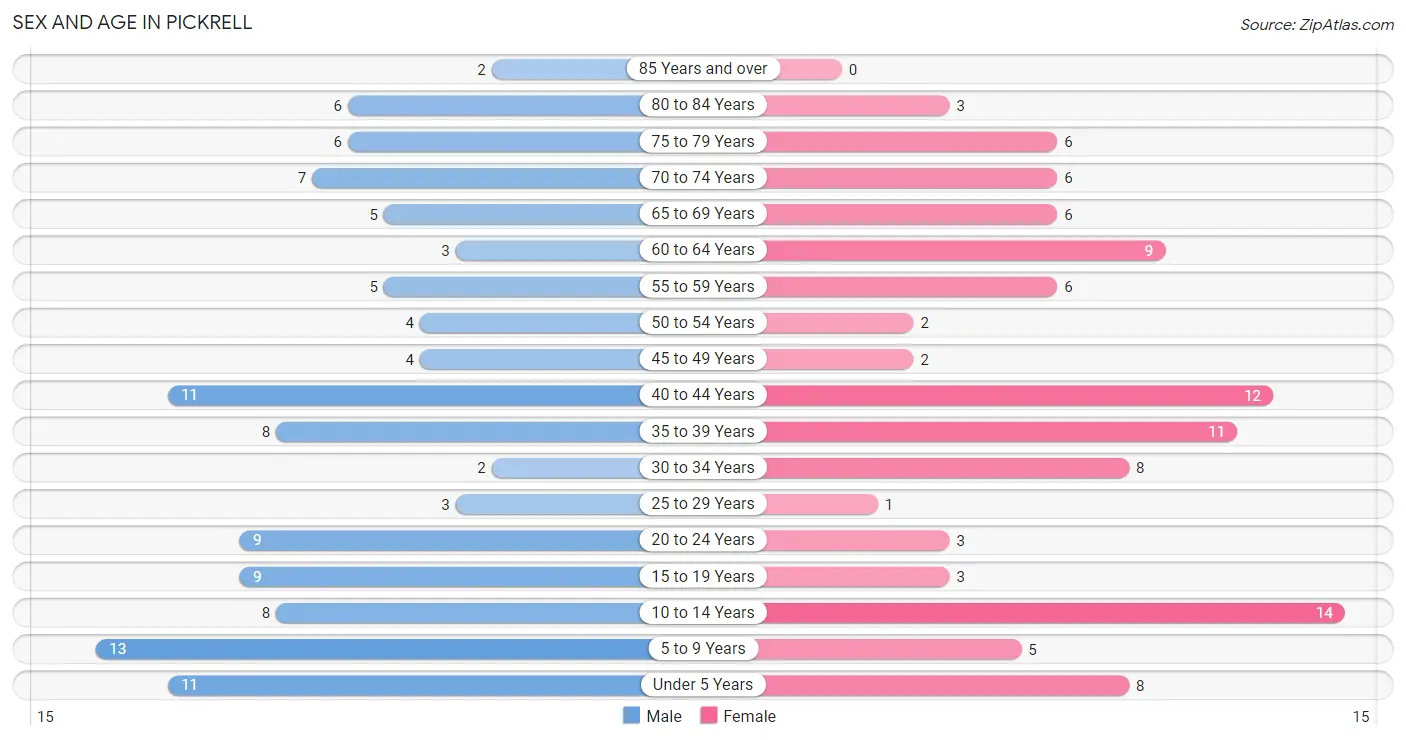
Sex and Age in Pickrell
Sex and Age in Pickrell
The most populous age groups in Pickrell are 5 to 9 Years (13 | 11.2%) for men and 10 to 14 Years (14 | 13.3%) for women.
| Age Bracket | Male | Female |
| Under 5 Years | 11 (9.5%) | 8 (7.6%) |
| 5 to 9 Years | 13 (11.2%) | 5 (4.8%) |
| 10 to 14 Years | 8 (6.9%) | 14 (13.3%) |
| 15 to 19 Years | 9 (7.8%) | 3 (2.9%) |
| 20 to 24 Years | 9 (7.8%) | 3 (2.9%) |
| 25 to 29 Years | 3 (2.6%) | 1 (0.9%) |
| 30 to 34 Years | 2 (1.7%) | 8 (7.6%) |
| 35 to 39 Years | 8 (6.9%) | 11 (10.5%) |
| 40 to 44 Years | 11 (9.5%) | 12 (11.4%) |
| 45 to 49 Years | 4 (3.5%) | 2 (1.9%) |
| 50 to 54 Years | 4 (3.5%) | 2 (1.9%) |
| 55 to 59 Years | 5 (4.3%) | 6 (5.7%) |
| 60 to 64 Years | 3 (2.6%) | 9 (8.6%) |
| 65 to 69 Years | 5 (4.3%) | 6 (5.7%) |
| 70 to 74 Years | 7 (6.0%) | 6 (5.7%) |
| 75 to 79 Years | 6 (5.2%) | 6 (5.7%) |
| 80 to 84 Years | 6 (5.2%) | 3 (2.9%) |
| 85 Years and over | 2 (1.7%) | 0 (0.0%) |
| Total | 116 (100.0%) | 105 (100.0%) |
Families and Households in Pickrell
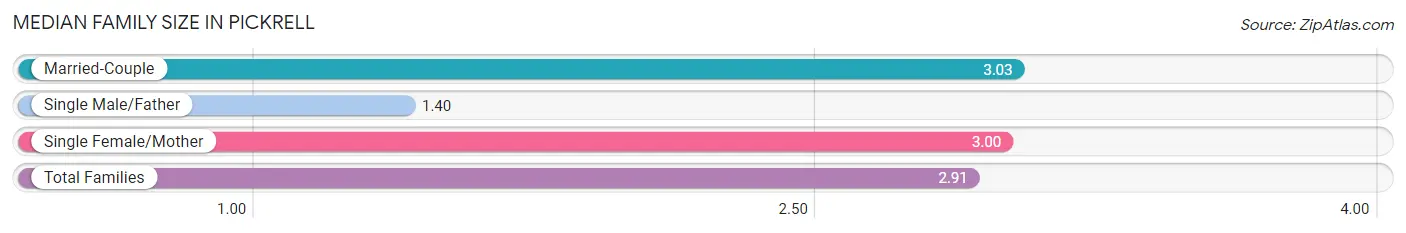
Median Family Size in Pickrell
The median family size in Pickrell is 2.91 persons per family, with married-couple families (60 | 89.5%) accounting for the largest median family size of 3.03 persons per family. On the other hand, single male/father families (5 | 7.5%) represent the smallest median family size with 1.40 persons per family.
| Family Type | # Families | Family Size |
| Married-Couple | 60 (89.5%) | 3.03 |
| Single Male/Father | 5 (7.5%) | 1.40 |
| Single Female/Mother | 2 (3.0%) | 3.00 |
| Total Families | 67 (100.0%) | 2.91 |
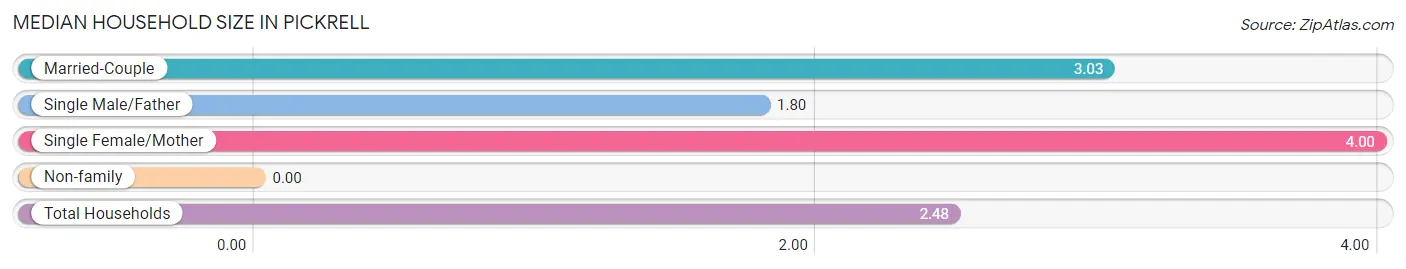
Median Household Size in Pickrell
| Household Type | # Households | Household Size |
| Married-Couple | 60 (67.4%) | 3.03 |
| Single Male/Father | 5 (5.6%) | 1.80 |
| Single Female/Mother | 2 (2.2%) | 4.00 |
| Non-family | 22 (24.7%) | - |
| Total Households | 89 (100.0%) | 2.48 |
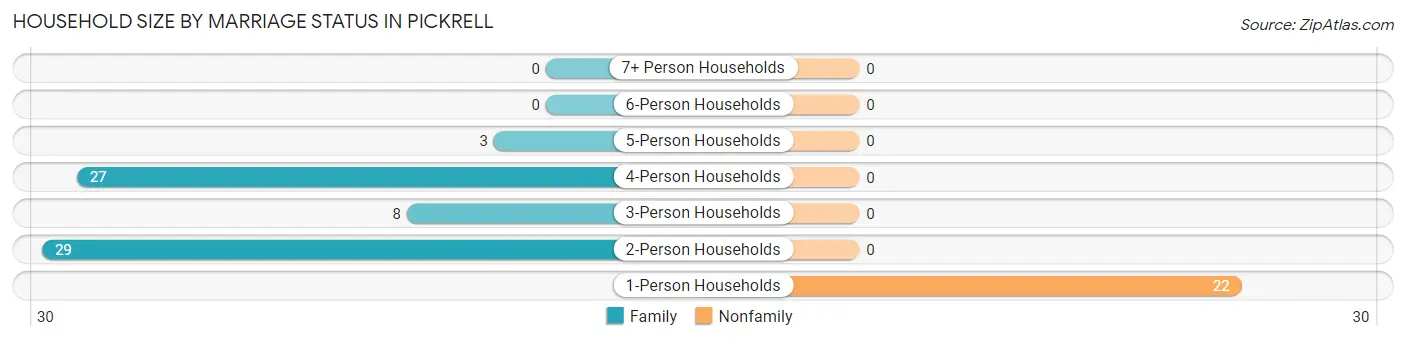
Household Size by Marriage Status in Pickrell
Out of a total of 89 households in Pickrell, 67 (75.3%) are family households, while 22 (24.7%) are nonfamily households. The most numerous type of family households are 2-person households, comprising 29, and the most common type of nonfamily households are 1-person households, comprising 22.
| Household Size | Family Households | Nonfamily Households |
| 1-Person Households | - | 22 (24.7%) |
| 2-Person Households | 29 (32.6%) | 0 (0.0%) |
| 3-Person Households | 8 (9.0%) | 0 (0.0%) |
| 4-Person Households | 27 (30.3%) | 0 (0.0%) |
| 5-Person Households | 3 (3.4%) | 0 (0.0%) |
| 6-Person Households | 0 (0.0%) | 0 (0.0%) |
| 7+ Person Households | 0 (0.0%) | 0 (0.0%) |
| Total | 67 (75.3%) | 22 (24.7%) |
Female Fertility in Pickrell
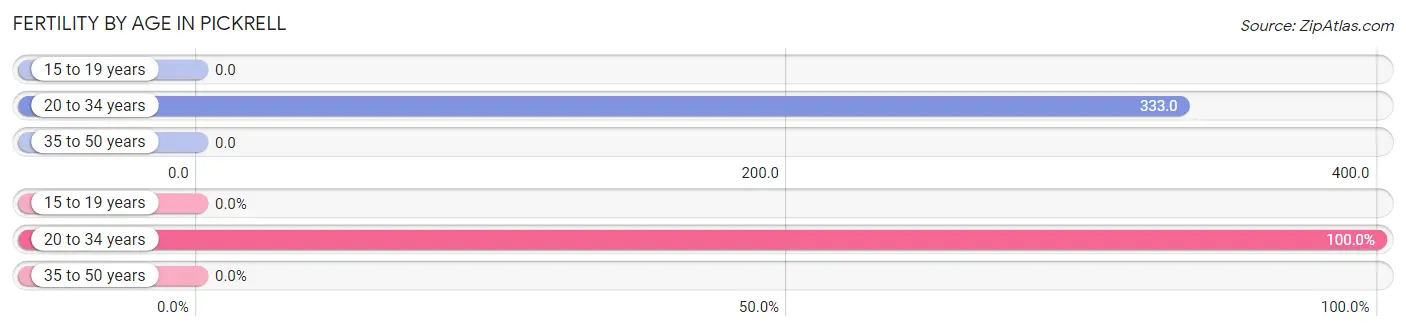
Fertility by Age in Pickrell
Average fertility rate in Pickrell is 100.0 births per 1,000 women. Women in the age bracket of 20 to 34 years have the highest fertility rate with 333.0 births per 1,000 women. Women in the age bracket of 20 to 34 years acount for 100.0% of all women with births.
| Age Bracket | Women with Births | Births / 1,000 Women |
| 15 to 19 years | 0 (0.0%) | 0.0 |
| 20 to 34 years | 4 (100.0%) | 333.0 |
| 35 to 50 years | 0 (0.0%) | 0.0 |
| Total | 4 (100.0%) | 100.0 |
Fertility by Age by Marriage Status in Pickrell
50.0% of women with births (4) in Pickrell are married. The highest percentage of unmarried women with births falls into 20 to 34 years age bracket with 50.0% of them unmarried at the time of birth, while the lowest percentage of unmarried women with births belong to 20 to 34 years age bracket with 50.0% of them unmarried.
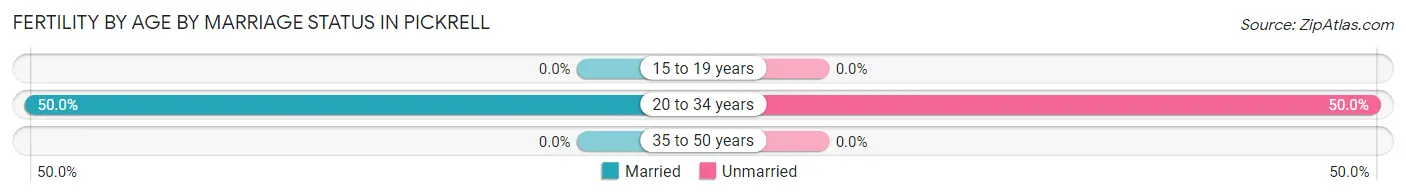
| Age Bracket | Married | Unmarried |
| 15 to 19 years | 0 (0.0%) | 0 (0.0%) |
| 20 to 34 years | 2 (50.0%) | 2 (50.0%) |
| 35 to 50 years | 0 (0.0%) | 0 (0.0%) |
| Total | 2 (50.0%) | 2 (50.0%) |
Fertility by Education in Pickrell
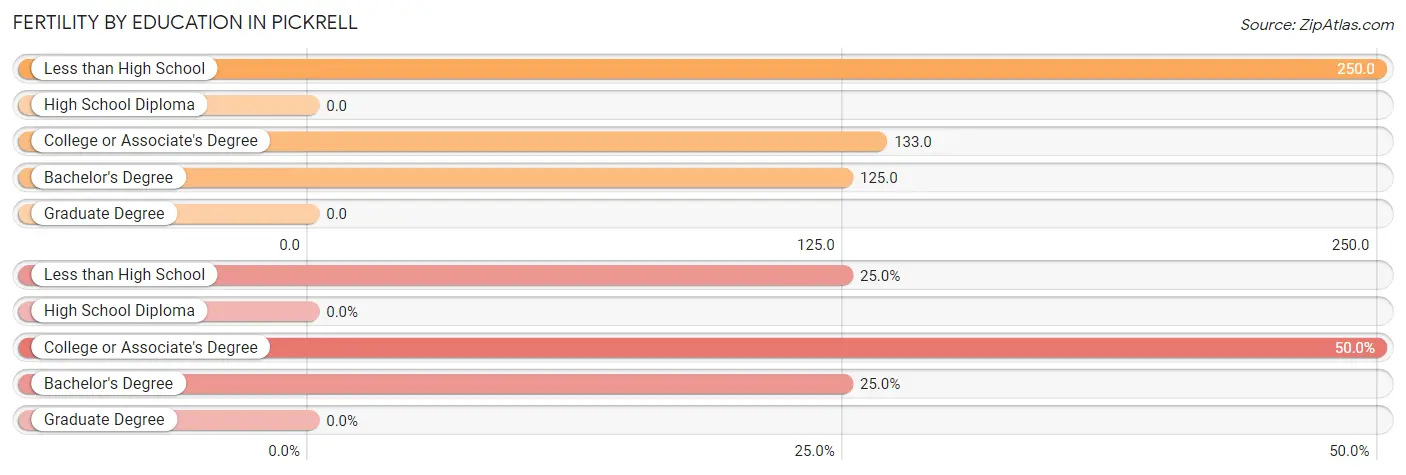
| Educational Attainment | Women with Births | Births / 1,000 Women |
| Less than High School | 1 (25.0%) | 250.0 |
| High School Diploma | 0 (0.0%) | 0.0 |
| College or Associate's Degree | 2 (50.0%) | 133.0 |
| Bachelor's Degree | 1 (25.0%) | 125.0 |
| Graduate Degree | 0 (0.0%) | 0.0 |
| Total | 4 (100.0%) | 100.0 |
Fertility by Education by Marriage Status in Pickrell
50.0% of women with births in Pickrell are unmarried. Women with the educational attainment of less than high school are most likely to be married with 100.0% of them married at childbirth, while women with the educational attainment of college or associate's degree are least likely to be married with 100.0% of them unmarried at childbirth.
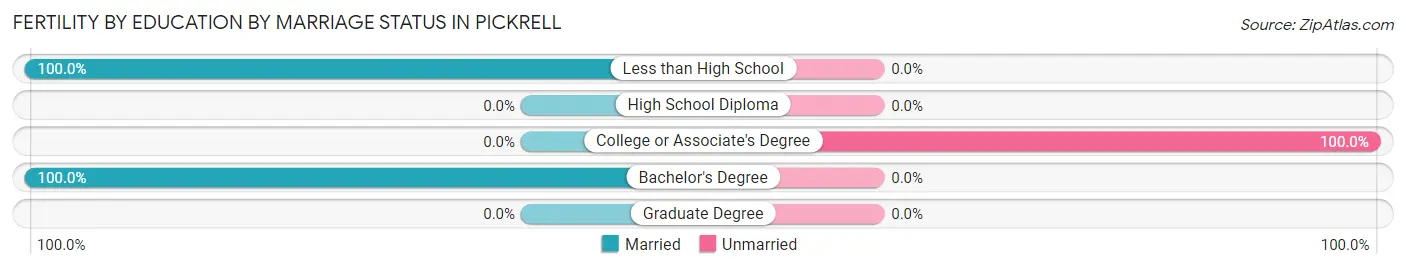
| Educational Attainment | Married | Unmarried |
| Less than High School | 1 (100.0%) | 0 (0.0%) |
| High School Diploma | 0 (0.0%) | 0 (0.0%) |
| College or Associate's Degree | 0 (0.0%) | 2 (100.0%) |
| Bachelor's Degree | 1 (100.0%) | 0 (0.0%) |
| Graduate Degree | 0 (0.0%) | 0 (0.0%) |
| Total | 2 (50.0%) | 2 (50.0%) |
Income in Pickrell
Income Overview in Pickrell
Per Capita Income in Pickrell is $32,600, while median incomes of families and households are $83,750 and $67,917 respectively.
| Characteristic | Number | Measure |
| Per Capita Income | 221 | $32,600 |
| Median Family Income | 67 | $83,750 |
| Mean Family Income | 67 | $91,591 |
| Median Household Income | 89 | $67,917 |
| Mean Household Income | 89 | $83,985 |
| Income Deficit | 67 | $0 |
| Wage / Income Gap (%) | 221 | 39.18% |
| Wage / Income Gap ($) | 221 | 60.82¢ per $1 |
| Gini / Inequality Index | 221 | 0.34 |
Earnings by Sex in Pickrell
Average Earnings in Pickrell are $43,125, $56,667 for men and $34,464 for women, a difference of 39.2%.
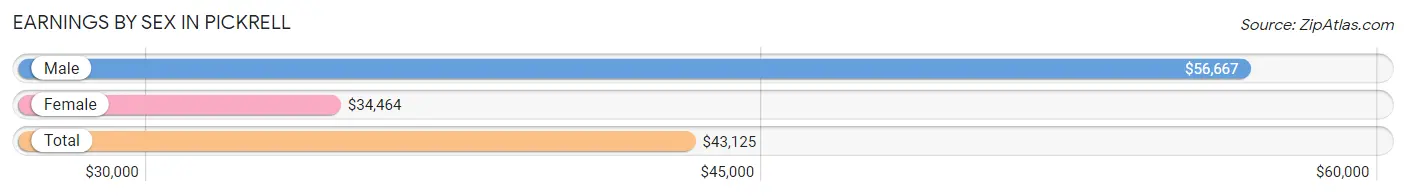
| Sex | Number | Average Earnings |
| Male | 50 (46.7%) | $56,667 |
| Female | 57 (53.3%) | $34,464 |
| Total | 107 (100.0%) | $43,125 |
Earnings by Sex by Income Bracket in Pickrell
The most common earnings brackets in Pickrell are $75,000 to $99,999 for men (13 | 26.0%) and $30,000 to $34,999 for women (9 | 15.8%).
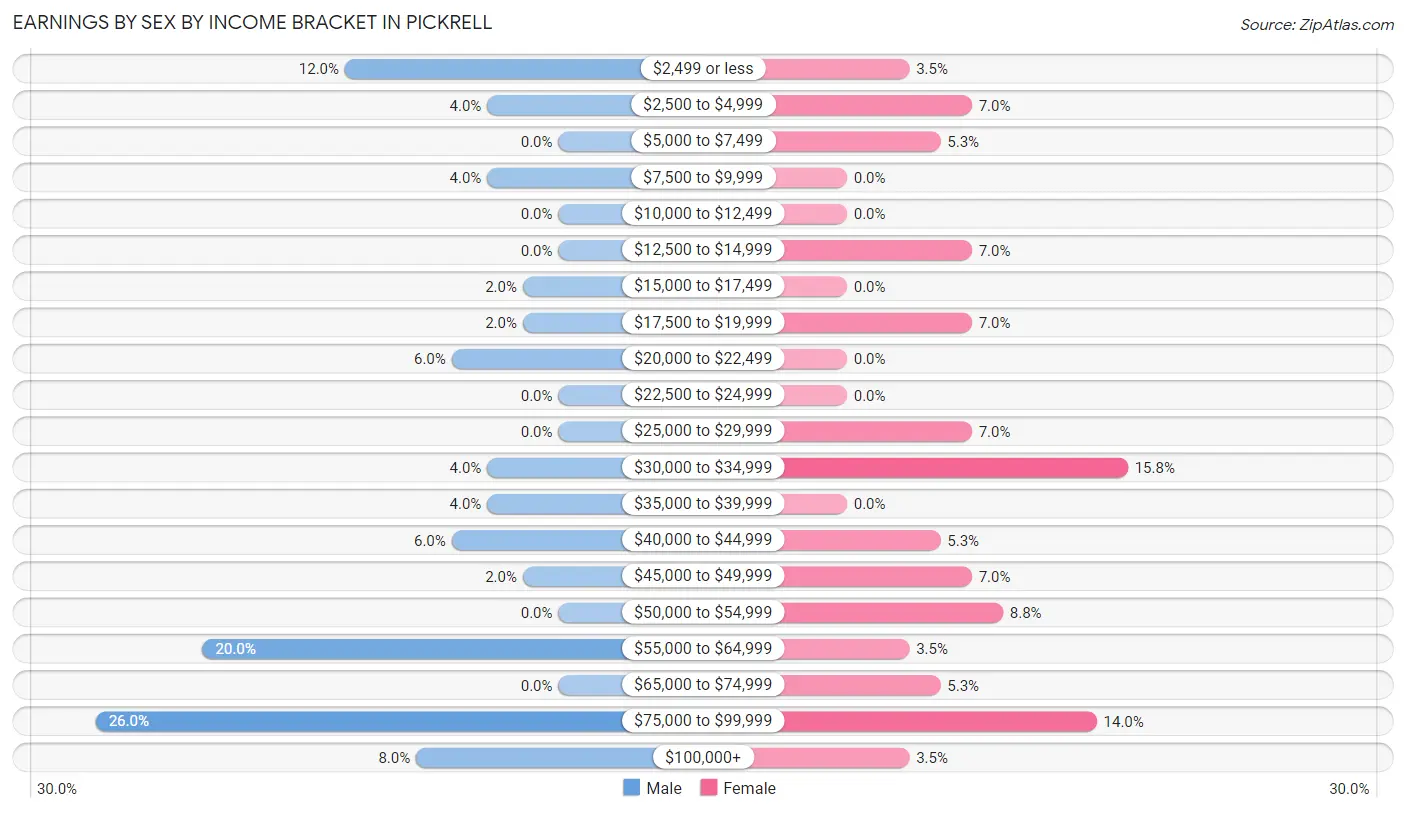
| Income | Male | Female |
| $2,499 or less | 6 (12.0%) | 2 (3.5%) |
| $2,500 to $4,999 | 2 (4.0%) | 4 (7.0%) |
| $5,000 to $7,499 | 0 (0.0%) | 3 (5.3%) |
| $7,500 to $9,999 | 2 (4.0%) | 0 (0.0%) |
| $10,000 to $12,499 | 0 (0.0%) | 0 (0.0%) |
| $12,500 to $14,999 | 0 (0.0%) | 4 (7.0%) |
| $15,000 to $17,499 | 1 (2.0%) | 0 (0.0%) |
| $17,500 to $19,999 | 1 (2.0%) | 4 (7.0%) |
| $20,000 to $22,499 | 3 (6.0%) | 0 (0.0%) |
| $22,500 to $24,999 | 0 (0.0%) | 0 (0.0%) |
| $25,000 to $29,999 | 0 (0.0%) | 4 (7.0%) |
| $30,000 to $34,999 | 2 (4.0%) | 9 (15.8%) |
| $35,000 to $39,999 | 2 (4.0%) | 0 (0.0%) |
| $40,000 to $44,999 | 3 (6.0%) | 3 (5.3%) |
| $45,000 to $49,999 | 1 (2.0%) | 4 (7.0%) |
| $50,000 to $54,999 | 0 (0.0%) | 5 (8.8%) |
| $55,000 to $64,999 | 10 (20.0%) | 2 (3.5%) |
| $65,000 to $74,999 | 0 (0.0%) | 3 (5.3%) |
| $75,000 to $99,999 | 13 (26.0%) | 8 (14.0%) |
| $100,000+ | 4 (8.0%) | 2 (3.5%) |
| Total | 50 (100.0%) | 57 (100.0%) |
Earnings by Sex by Educational Attainment in Pickrell
Average earnings in Pickrell are $58,125 for men and $34,821 for women, a difference of 40.1%. Men with an educational attainment of bachelor's degree enjoy the highest average annual earnings of $81,250, while those with college or associate's degree education earn the least with $59,375. Women with an educational attainment of bachelor's degree earn the most with the average annual earnings of $86,250, while those with high school diploma education have the smallest earnings of $23,750.
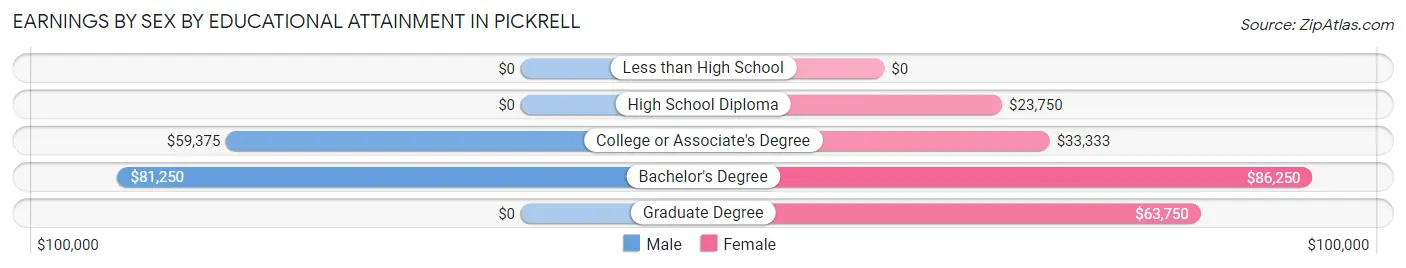
| Educational Attainment | Male Income | Female Income |
| Less than High School | - | - |
| High School Diploma | - | - |
| College or Associate's Degree | $59,375 | $33,333 |
| Bachelor's Degree | $81,250 | $86,250 |
| Graduate Degree | - | - |
| Total | $58,125 | $34,821 |
Family Income in Pickrell
Family Income Brackets in Pickrell
According to the Pickrell family income data, there are 16 families falling into the $75,000 to $99,999 income range, which is the most common income bracket and makes up 23.9% of all families.
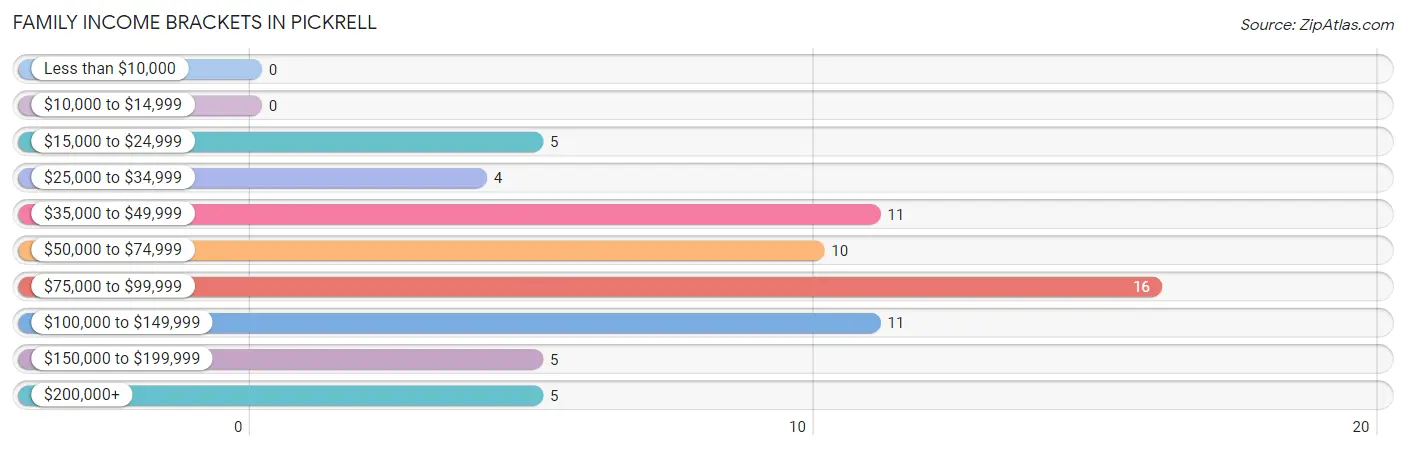
| Income Bracket | # Families | % Families |
| Less than $10,000 | 0 | 0.0% |
| $10,000 to $14,999 | 0 | 0.0% |
| $15,000 to $24,999 | 5 | 7.5% |
| $25,000 to $34,999 | 4 | 6.0% |
| $35,000 to $49,999 | 11 | 16.4% |
| $50,000 to $74,999 | 10 | 14.9% |
| $75,000 to $99,999 | 16 | 23.9% |
| $100,000 to $149,999 | 11 | 16.4% |
| $150,000 to $199,999 | 5 | 7.5% |
| $200,000+ | 5 | 7.5% |
Family Income by Famaliy Size in Pickrell
3-person families (5 | 7.5%) account for the highest median family income in Pickrell with $140,625 per family, while 3-person families (5 | 7.5%) have the highest median income of $46,875 per family member.
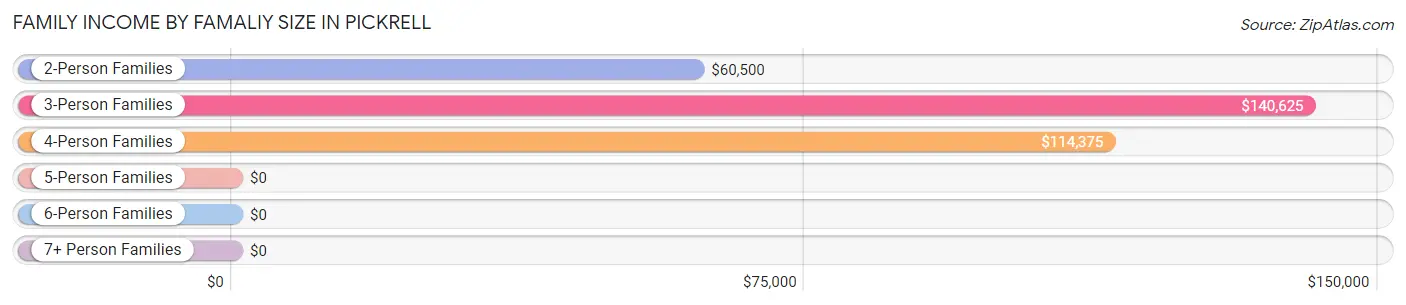
| Income Bracket | # Families | Median Income |
| 2-Person Families | 34 (50.7%) | $60,500 |
| 3-Person Families | 5 (7.5%) | $140,625 |
| 4-Person Families | 25 (37.3%) | $114,375 |
| 5-Person Families | 3 (4.5%) | $0 |
| 6-Person Families | 0 (0.0%) | $0 |
| 7+ Person Families | 0 (0.0%) | $0 |
| Total | 67 (100.0%) | $83,750 |
Family Income by Number of Earners in Pickrell
The median family income in Pickrell is $83,750, with families comprising 3+ earners (6) having the highest median family income of $125,000, while families with no earners (15) have the lowest median family income of $39,375, accounting for 9.0% and 22.4% of families, respectively.
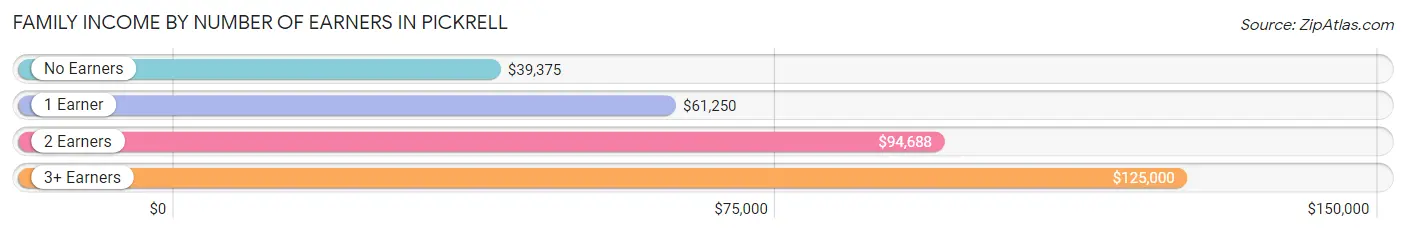
| Number of Earners | # Families | Median Income |
| No Earners | 15 (22.4%) | $39,375 |
| 1 Earner | 17 (25.4%) | $61,250 |
| 2 Earners | 29 (43.3%) | $94,688 |
| 3+ Earners | 6 (9.0%) | $125,000 |
| Total | 67 (100.0%) | $83,750 |
Household Income in Pickrell
Household Income Brackets in Pickrell
With 21 households falling in the category, the $35,000 to $49,999 income range is the most frequent in Pickrell, accounting for 23.6% of all households.
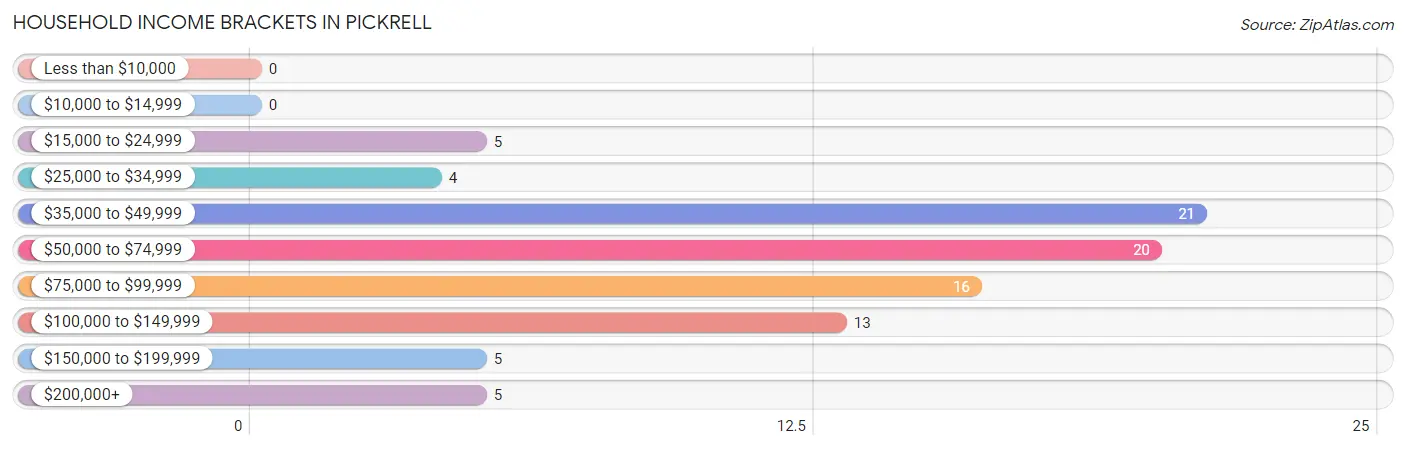
| Income Bracket | # Households | % Households |
| Less than $10,000 | 0 | 0.0% |
| $10,000 to $14,999 | 0 | 0.0% |
| $15,000 to $24,999 | 5 | 5.6% |
| $25,000 to $34,999 | 4 | 4.5% |
| $35,000 to $49,999 | 21 | 23.6% |
| $50,000 to $74,999 | 20 | 22.5% |
| $75,000 to $99,999 | 16 | 18.0% |
| $100,000 to $149,999 | 13 | 14.6% |
| $150,000 to $199,999 | 5 | 5.6% |
| $200,000+ | 5 | 5.6% |
Household Income by Householder Age in Pickrell
The median household income in Pickrell is $67,917, with the highest median household income of $94,375 found in the 25 to 44 years age bracket for the primary householder. A total of 32 households (36.0%) fall into this category. Meanwhile, the 15 to 24 years age bracket for the primary householder has the lowest median household income of $0, with 5 households (5.6%) in this group.
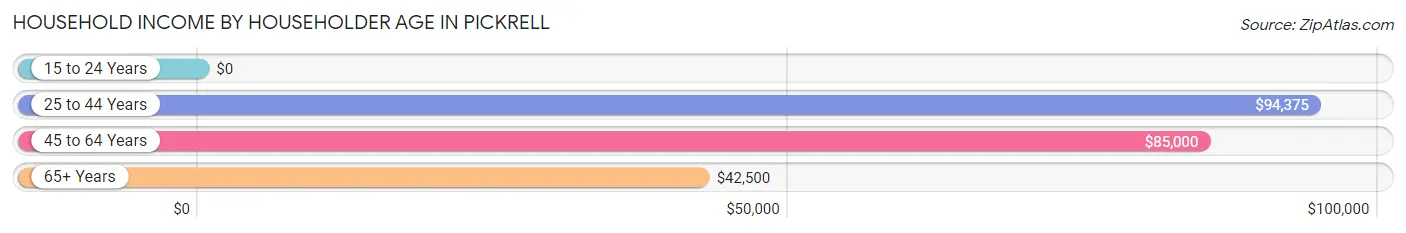
| Income Bracket | # Households | Median Income |
| 15 to 24 Years | 5 (5.6%) | $0 |
| 25 to 44 Years | 32 (36.0%) | $94,375 |
| 45 to 64 Years | 20 (22.5%) | $85,000 |
| 65+ Years | 32 (36.0%) | $42,500 |
| Total | 89 (100.0%) | $67,917 |
Poverty in Pickrell
Income Below Poverty by Sex and Age in Pickrell
With 1.7% poverty level for males and 4.8% for females among the residents of Pickrell, 45 to 54 year old males and 15 year old females are the most vulnerable to poverty, with 1 males (12.5%) and 1 females (100.0%) in their respective age groups living below the poverty level.
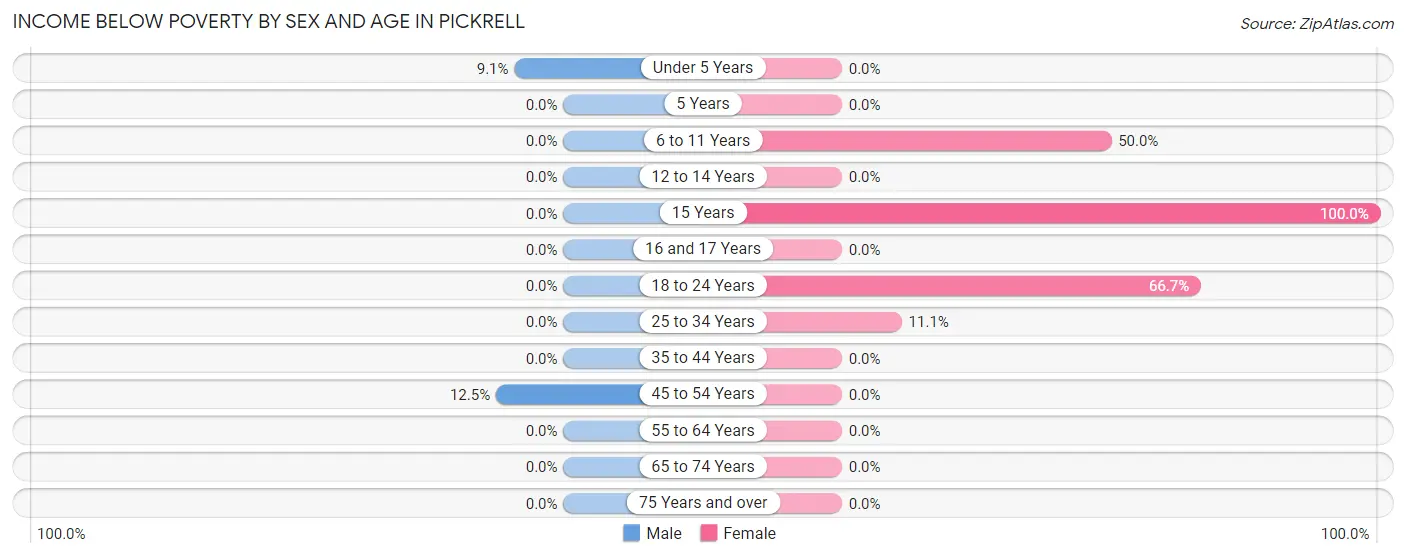
| Age Bracket | Male | Female |
| Under 5 Years | 1 (9.1%) | 0 (0.0%) |
| 5 Years | 0 (0.0%) | 0 (0.0%) |
| 6 to 11 Years | 0 (0.0%) | 1 (50.0%) |
| 12 to 14 Years | 0 (0.0%) | 0 (0.0%) |
| 15 Years | 0 (0.0%) | 1 (100.0%) |
| 16 and 17 Years | 0 (0.0%) | 0 (0.0%) |
| 18 to 24 Years | 0 (0.0%) | 2 (66.7%) |
| 25 to 34 Years | 0 (0.0%) | 1 (11.1%) |
| 35 to 44 Years | 0 (0.0%) | 0 (0.0%) |
| 45 to 54 Years | 1 (12.5%) | 0 (0.0%) |
| 55 to 64 Years | 0 (0.0%) | 0 (0.0%) |
| 65 to 74 Years | 0 (0.0%) | 0 (0.0%) |
| 75 Years and over | 0 (0.0%) | 0 (0.0%) |
| Total | 2 (1.7%) | 5 (4.8%) |
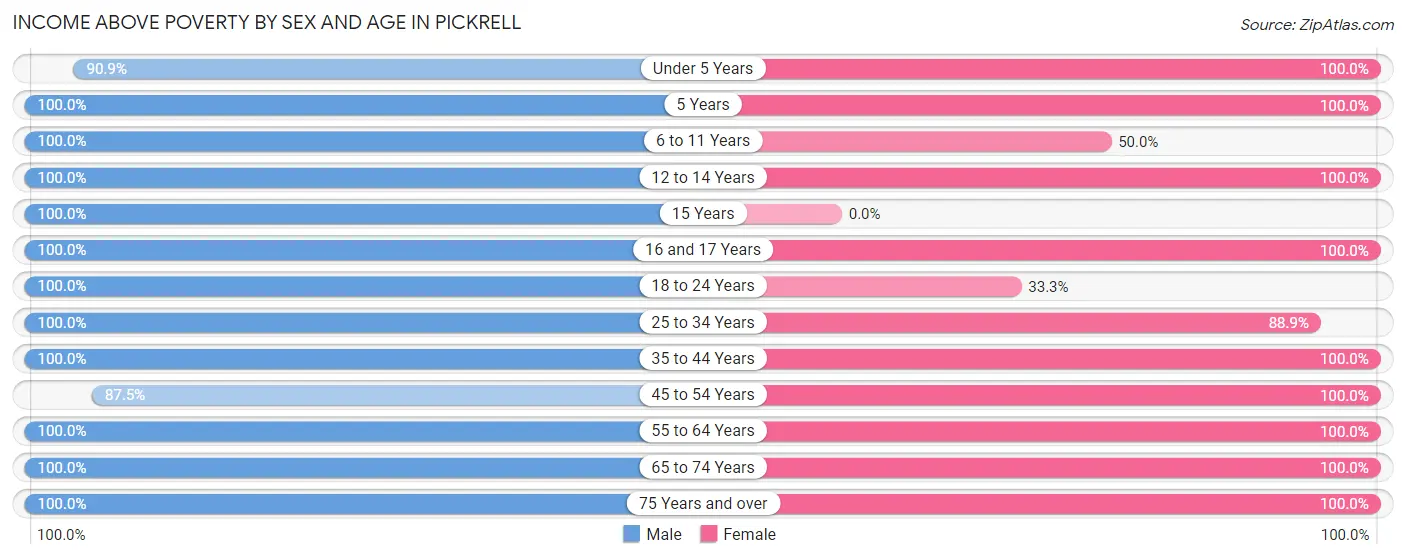
Income Above Poverty by Sex and Age in Pickrell
According to the poverty statistics in Pickrell, males aged 5 years and females aged under 5 years are the age groups that are most secure financially, with 100.0% of males and 100.0% of females in these age groups living above the poverty line.
| Age Bracket | Male | Female |
| Under 5 Years | 10 (90.9%) | 8 (100.0%) |
| 5 Years | 6 (100.0%) | 3 (100.0%) |
| 6 to 11 Years | 10 (100.0%) | 1 (50.0%) |
| 12 to 14 Years | 5 (100.0%) | 14 (100.0%) |
| 15 Years | 2 (100.0%) | 0 (0.0%) |
| 16 and 17 Years | 6 (100.0%) | 2 (100.0%) |
| 18 to 24 Years | 10 (100.0%) | 1 (33.3%) |
| 25 to 34 Years | 5 (100.0%) | 8 (88.9%) |
| 35 to 44 Years | 19 (100.0%) | 23 (100.0%) |
| 45 to 54 Years | 7 (87.5%) | 4 (100.0%) |
| 55 to 64 Years | 8 (100.0%) | 15 (100.0%) |
| 65 to 74 Years | 12 (100.0%) | 12 (100.0%) |
| 75 Years and over | 14 (100.0%) | 9 (100.0%) |
| Total | 114 (98.3%) | 100 (95.2%) |
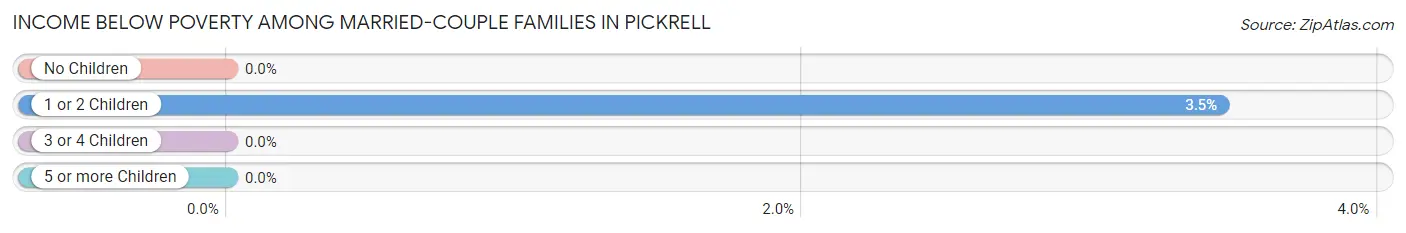
Income Below Poverty Among Married-Couple Families in Pickrell
The poverty statistics for married-couple families in Pickrell show that 1.7% or 1 of the total 60 families live below the poverty line. Families with 1 or 2 children have the highest poverty rate of 3.5%, comprising of 1 families. On the other hand, families with no children have the lowest poverty rate of 0.0%, which includes 0 families.
| Children | Above Poverty | Below Poverty |
| No Children | 28 (100.0%) | 0 (0.0%) |
| 1 or 2 Children | 28 (96.6%) | 1 (3.5%) |
| 3 or 4 Children | 3 (100.0%) | 0 (0.0%) |
| 5 or more Children | 0 (0.0%) | 0 (0.0%) |
| Total | 59 (98.3%) | 1 (1.7%) |
Income Below Poverty Among Single-Parent Households in Pickrell
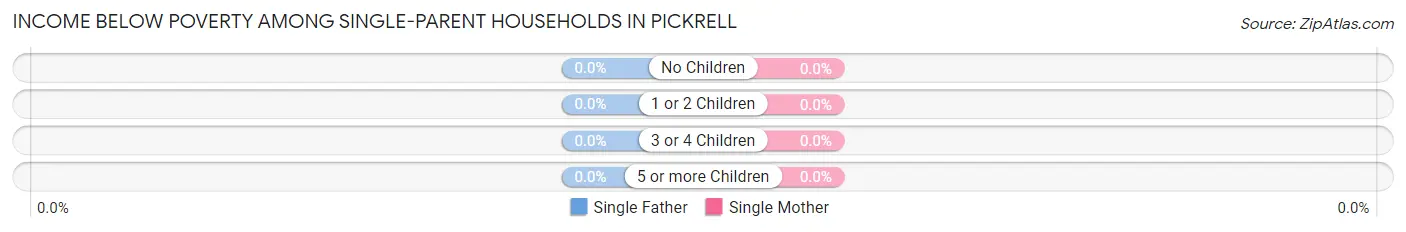
| Children | Single Father | Single Mother |
| No Children | 0 (0.0%) | 0 (0.0%) |
| 1 or 2 Children | 0 (0.0%) | 0 (0.0%) |
| 3 or 4 Children | 0 (0.0%) | 0 (0.0%) |
| 5 or more Children | 0 (0.0%) | 0 (0.0%) |
| Total | 0 (0.0%) | 0 (0.0%) |
Income Below Poverty Among Married-Couple vs Single-Parent Households in Pickrell
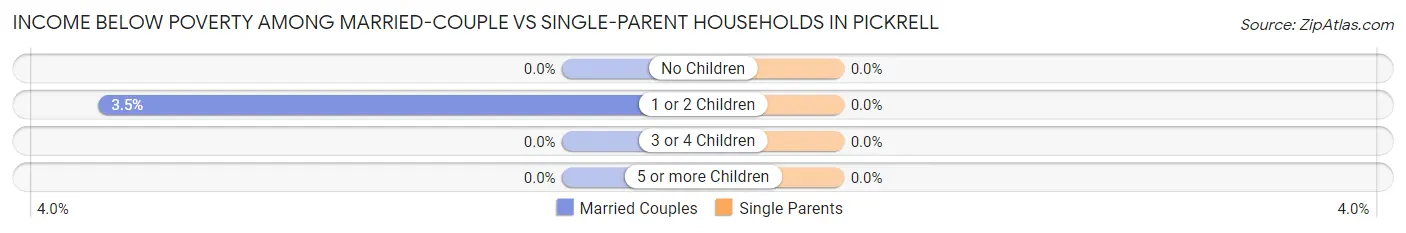
| Children | Married-Couple Families | Single-Parent Households |
| No Children | 0 (0.0%) | 0 (0.0%) |
| 1 or 2 Children | 1 (3.5%) | 0 (0.0%) |
| 3 or 4 Children | 0 (0.0%) | 0 (0.0%) |
| 5 or more Children | 0 (0.0%) | 0 (0.0%) |
| Total | 1 (1.7%) | 0 (0.0%) |
Employment Characteristics in Pickrell
Employment by Class of Employer in Pickrell
Among the 99 employed individuals in Pickrell, private company employees (59 | 59.6%), not-for-profit organizations (15 | 15.1%), and self-employed (not incorporated) (8 | 8.1%) make up the most common classes of employment.
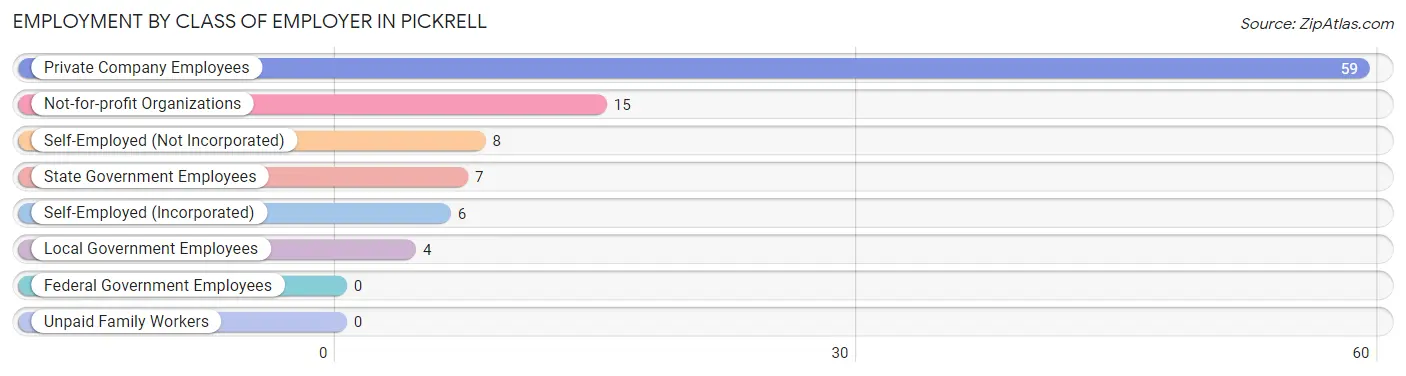
| Employer Class | # Employees | % Employees |
| Private Company Employees | 59 | 59.6% |
| Self-Employed (Incorporated) | 6 | 6.1% |
| Self-Employed (Not Incorporated) | 8 | 8.1% |
| Not-for-profit Organizations | 15 | 15.1% |
| Local Government Employees | 4 | 4.0% |
| State Government Employees | 7 | 7.1% |
| Federal Government Employees | 0 | 0.0% |
| Unpaid Family Workers | 0 | 0.0% |
| Total | 99 | 100.0% |
Employment Status by Age in Pickrell
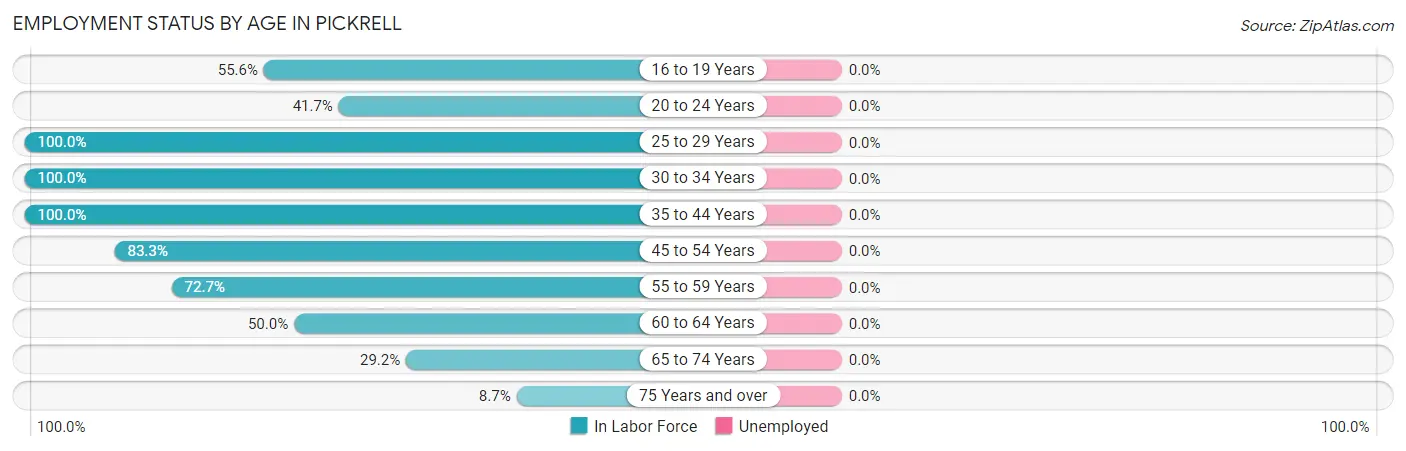
| Age Bracket | In Labor Force | Unemployed |
| 16 to 19 Years | 5 (55.6%) | 0 (0.0%) |
| 20 to 24 Years | 5 (41.7%) | 0 (0.0%) |
| 25 to 29 Years | 4 (100.0%) | 0 (0.0%) |
| 30 to 34 Years | 10 (100.0%) | 0 (0.0%) |
| 35 to 44 Years | 42 (100.0%) | 0 (0.0%) |
| 45 to 54 Years | 10 (83.3%) | 0 (0.0%) |
| 55 to 59 Years | 8 (72.7%) | 0 (0.0%) |
| 60 to 64 Years | 6 (50.0%) | 0 (0.0%) |
| 65 to 74 Years | 7 (29.2%) | 0 (0.0%) |
| 75 Years and over | 2 (8.7%) | 0 (0.0%) |
| Total | 99 (62.3%) | 0 (0.0%) |
Employment Status by Educational Attainment in Pickrell
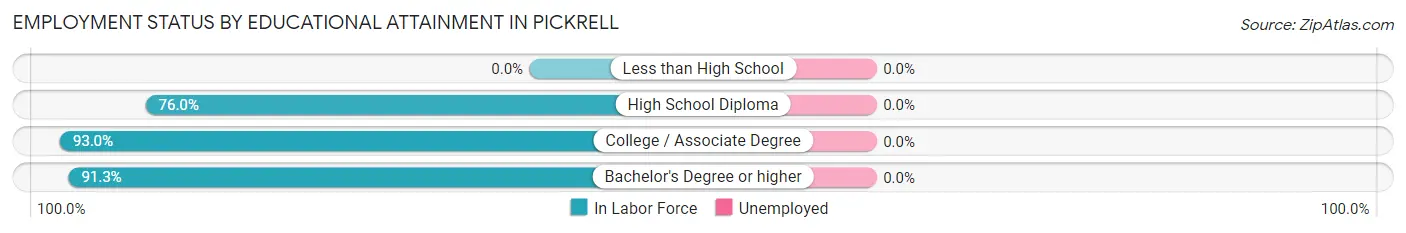
| Educational Attainment | In Labor Force | Unemployed |
| Less than High School | 0 (0.0%) | 0 (0.0%) |
| High School Diploma | 19 (76.0%) | 0 (0.0%) |
| College / Associate Degree | 40 (93.0%) | 0 (0.0%) |
| Bachelor's Degree or higher | 21 (91.3%) | 0 (0.0%) |
| Total | 80 (87.9%) | 0 (0.0%) |
Employment Occupations by Sex in Pickrell
Management, Business, Science and Arts Occupations
The most common Management, Business, Science and Arts occupations in Pickrell are Health Diagnosing & Treating (18 | 18.2%), Health Technologists (14 | 14.1%), Community & Social Service (9 | 9.1%), Education Instruction & Library (9 | 9.1%), and Management (8 | 8.1%).
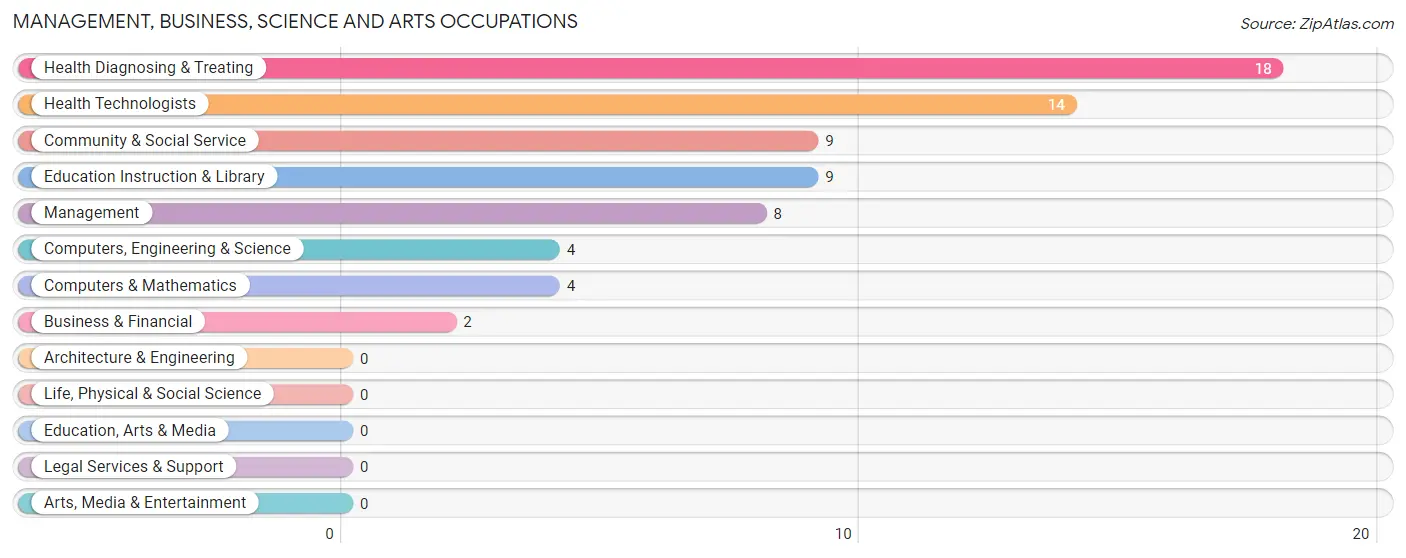
Management, Business, Science and Arts Occupations by Sex
Within the Management, Business, Science and Arts occupations in Pickrell, the most male-oriented occupations are Business & Financial (100.0%), Management (50.0%), and Computers, Engineering & Science (50.0%), while the most female-oriented occupations are Community & Social Service (100.0%), Education Instruction & Library (100.0%), and Health Diagnosing & Treating (100.0%).
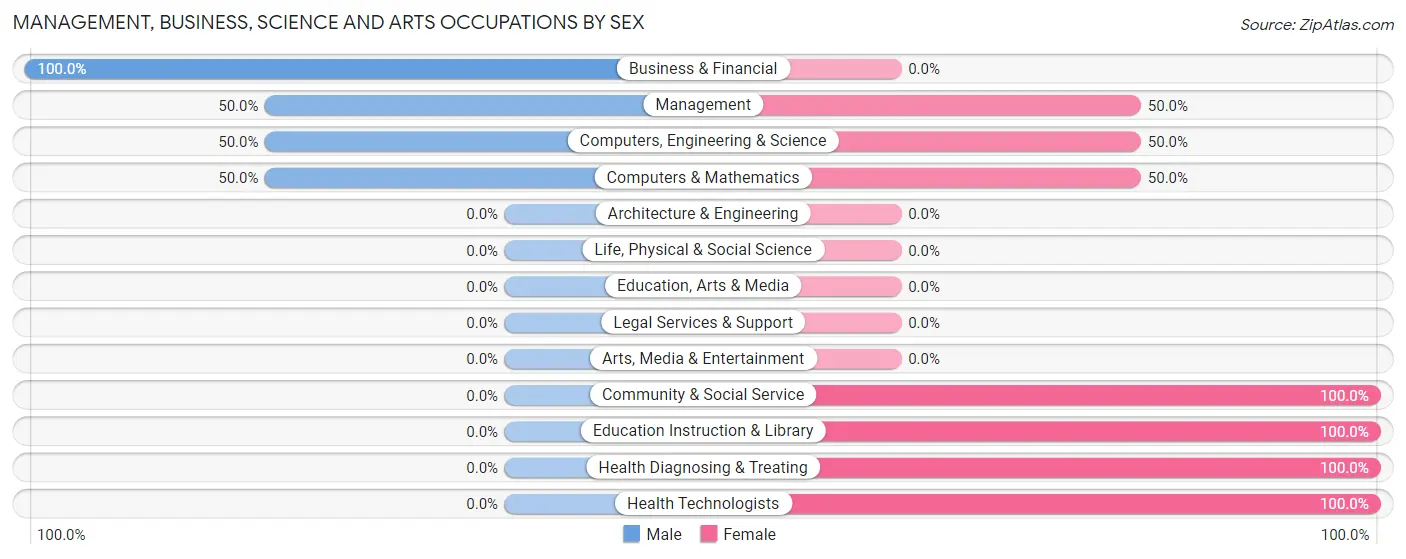
| Occupation | Male | Female |
| Management | 4 (50.0%) | 4 (50.0%) |
| Business & Financial | 2 (100.0%) | 0 (0.0%) |
| Computers, Engineering & Science | 2 (50.0%) | 2 (50.0%) |
| Computers & Mathematics | 2 (50.0%) | 2 (50.0%) |
| Architecture & Engineering | 0 (0.0%) | 0 (0.0%) |
| Life, Physical & Social Science | 0 (0.0%) | 0 (0.0%) |
| Community & Social Service | 0 (0.0%) | 9 (100.0%) |
| Education, Arts & Media | 0 (0.0%) | 0 (0.0%) |
| Legal Services & Support | 0 (0.0%) | 0 (0.0%) |
| Education Instruction & Library | 0 (0.0%) | 9 (100.0%) |
| Arts, Media & Entertainment | 0 (0.0%) | 0 (0.0%) |
| Health Diagnosing & Treating | 0 (0.0%) | 18 (100.0%) |
| Health Technologists | 0 (0.0%) | 14 (100.0%) |
| Total (Category) | 8 (19.5%) | 33 (80.5%) |
| Total (Overall) | 48 (48.5%) | 51 (51.5%) |
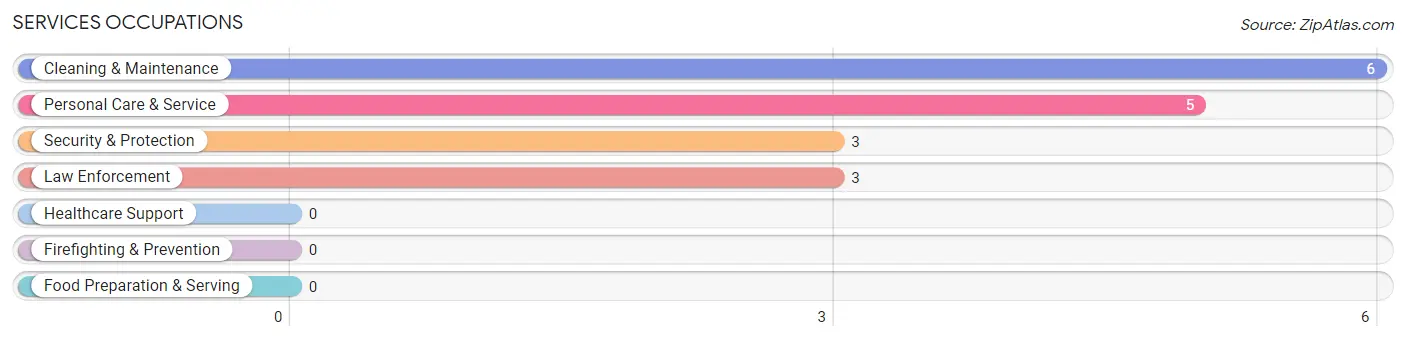
Services Occupations
The most common Services occupations in Pickrell are Cleaning & Maintenance (6 | 6.1%), Personal Care & Service (5 | 5.1%), Security & Protection (3 | 3.0%), and Law Enforcement (3 | 3.0%).
Services Occupations by Sex
Within the Services occupations in Pickrell, the most male-oriented occupations are Security & Protection (100.0%), Law Enforcement (100.0%), and Cleaning & Maintenance (83.3%), while the most female-oriented occupations are Personal Care & Service (20.0%), and Cleaning & Maintenance (16.7%).
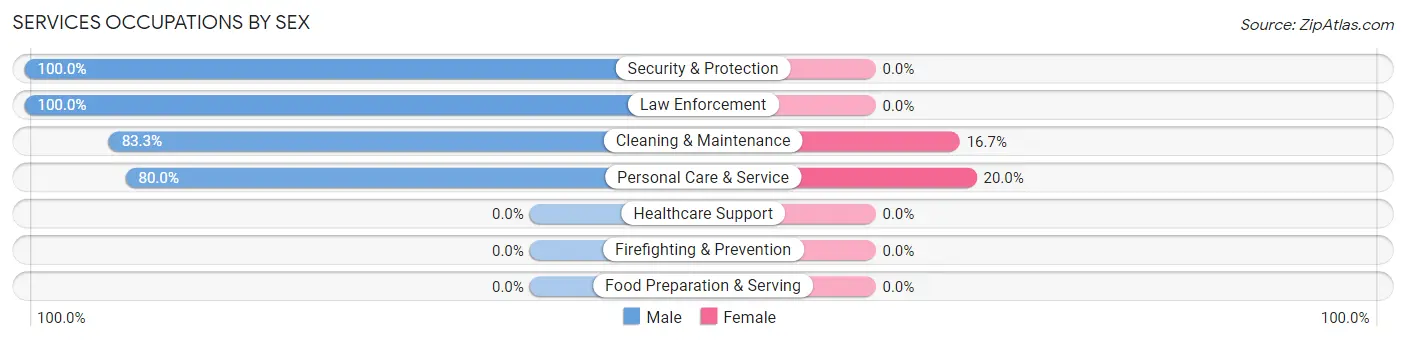
| Occupation | Male | Female |
| Healthcare Support | 0 (0.0%) | 0 (0.0%) |
| Security & Protection | 3 (100.0%) | 0 (0.0%) |
| Firefighting & Prevention | 0 (0.0%) | 0 (0.0%) |
| Law Enforcement | 3 (100.0%) | 0 (0.0%) |
| Food Preparation & Serving | 0 (0.0%) | 0 (0.0%) |
| Cleaning & Maintenance | 5 (83.3%) | 1 (16.7%) |
| Personal Care & Service | 4 (80.0%) | 1 (20.0%) |
| Total (Category) | 12 (85.7%) | 2 (14.3%) |
| Total (Overall) | 48 (48.5%) | 51 (51.5%) |
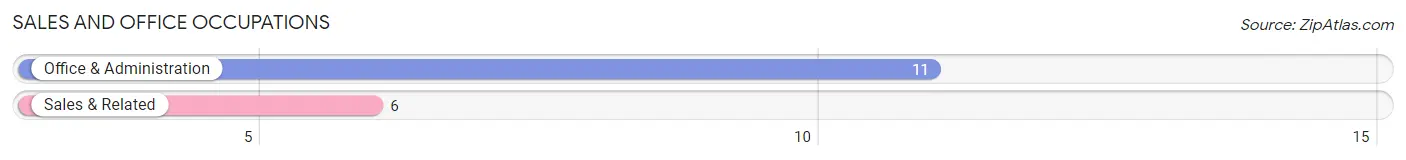
Sales and Office Occupations
The most common Sales and Office occupations in Pickrell are Office & Administration (11 | 11.1%), and Sales & Related (6 | 6.1%).
Sales and Office Occupations by Sex
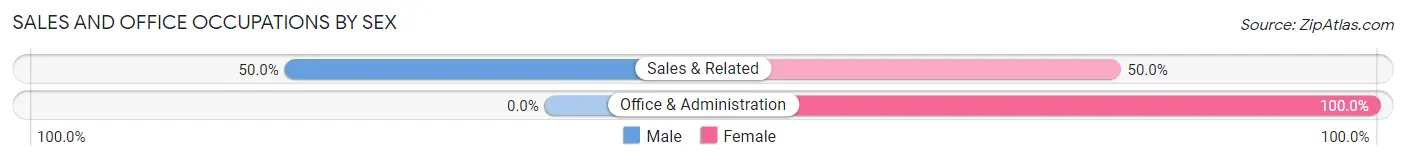
| Occupation | Male | Female |
| Sales & Related | 3 (50.0%) | 3 (50.0%) |
| Office & Administration | 0 (0.0%) | 11 (100.0%) |
| Total (Category) | 3 (17.6%) | 14 (82.4%) |
| Total (Overall) | 48 (48.5%) | 51 (51.5%) |
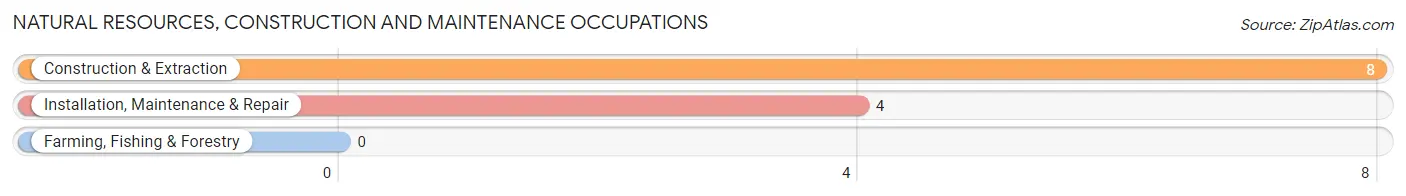
Natural Resources, Construction and Maintenance Occupations
The most common Natural Resources, Construction and Maintenance occupations in Pickrell are Construction & Extraction (8 | 8.1%), and Installation, Maintenance & Repair (4 | 4.0%).
Natural Resources, Construction and Maintenance Occupations by Sex
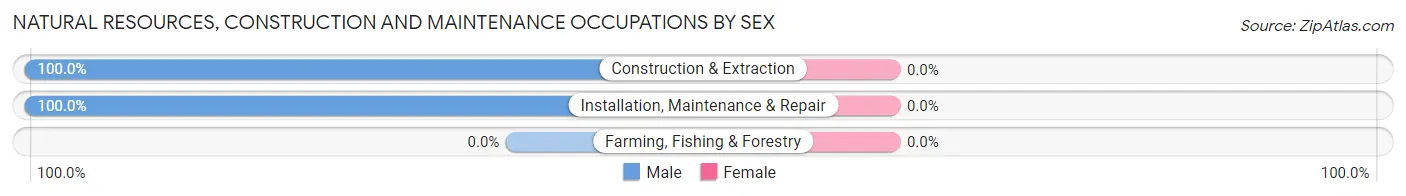
| Occupation | Male | Female |
| Farming, Fishing & Forestry | 0 (0.0%) | 0 (0.0%) |
| Construction & Extraction | 8 (100.0%) | 0 (0.0%) |
| Installation, Maintenance & Repair | 4 (100.0%) | 0 (0.0%) |
| Total (Category) | 12 (100.0%) | 0 (0.0%) |
| Total (Overall) | 48 (48.5%) | 51 (51.5%) |
Production, Transportation and Moving Occupations
The most common Production, Transportation and Moving occupations in Pickrell are Production (6 | 6.1%), Transportation (5 | 5.1%), and Material Moving (4 | 4.0%).
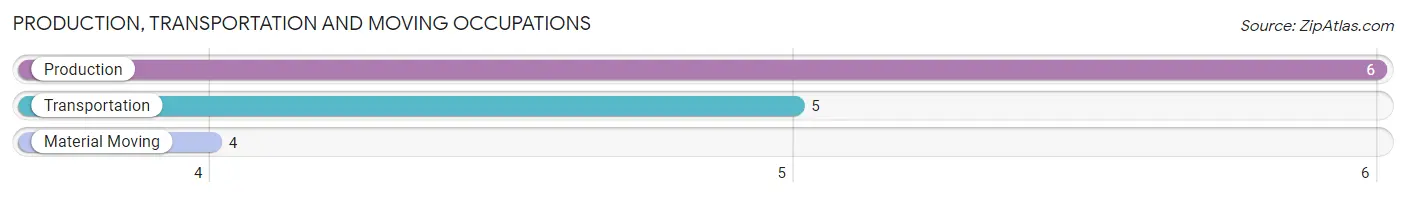
Production, Transportation and Moving Occupations by Sex
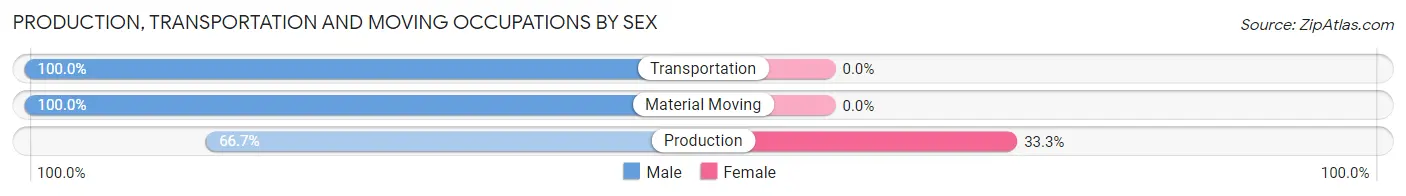
| Occupation | Male | Female |
| Production | 4 (66.7%) | 2 (33.3%) |
| Transportation | 5 (100.0%) | 0 (0.0%) |
| Material Moving | 4 (100.0%) | 0 (0.0%) |
| Total (Category) | 13 (86.7%) | 2 (13.3%) |
| Total (Overall) | 48 (48.5%) | 51 (51.5%) |
Employment Industries by Sex in Pickrell
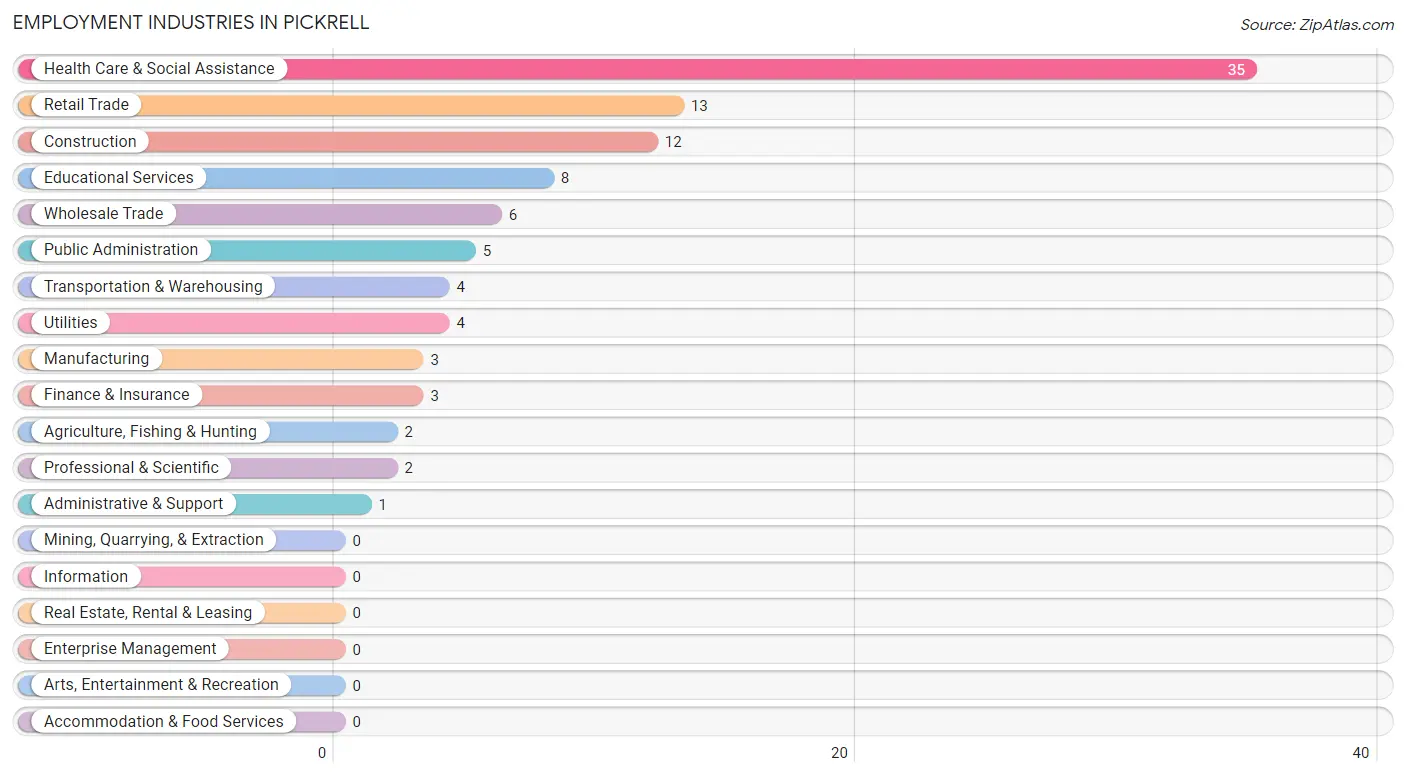
Employment Industries in Pickrell
The major employment industries in Pickrell include Health Care & Social Assistance (35 | 35.3%), Retail Trade (13 | 13.1%), Construction (12 | 12.1%), Educational Services (8 | 8.1%), and Wholesale Trade (6 | 6.1%).
Employment Industries by Sex in Pickrell
The Pickrell industries that see more men than women are Agriculture, Fishing & Hunting (100.0%), Manufacturing (100.0%), and Transportation & Warehousing (100.0%), whereas the industries that tend to have a higher number of women are Finance & Insurance (100.0%), Professional & Scientific (100.0%), and Educational Services (100.0%).
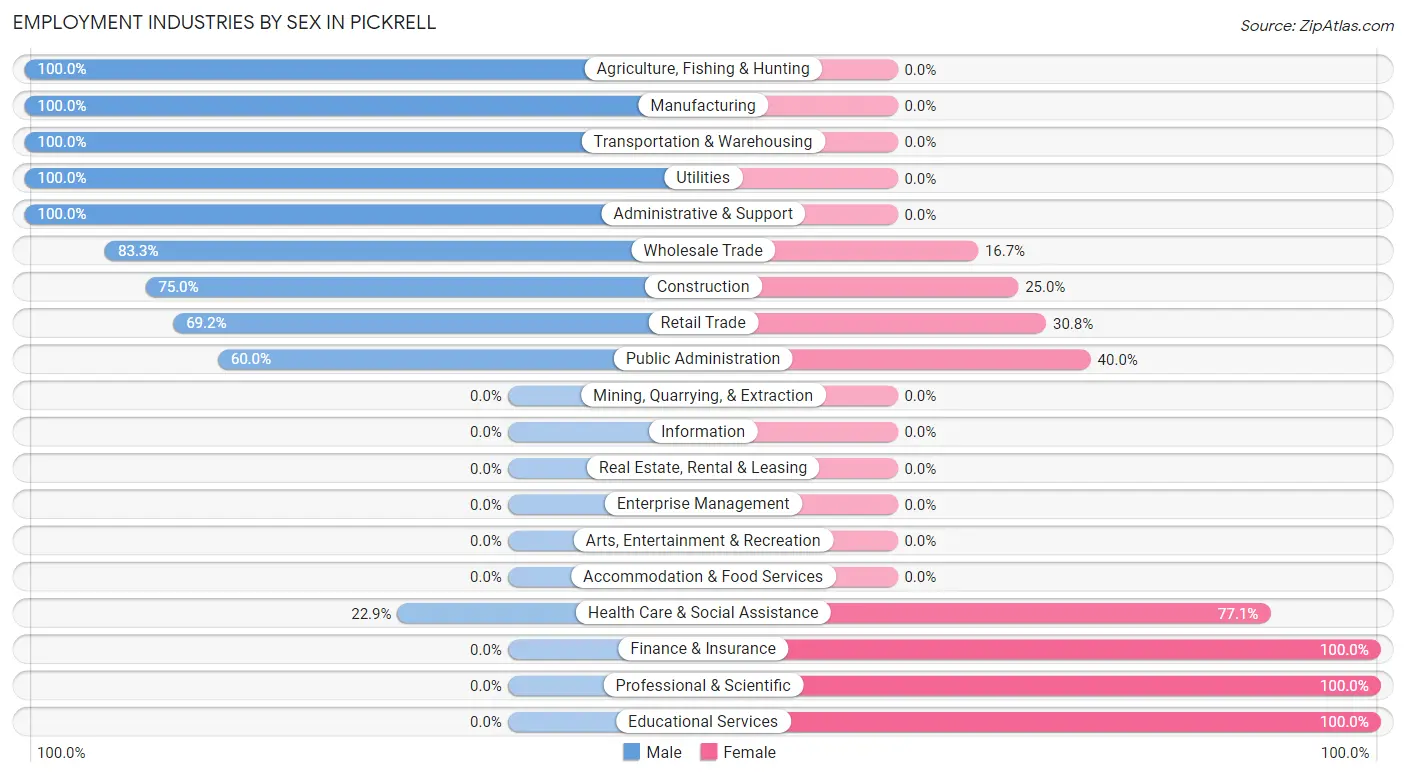
| Industry | Male | Female |
| Agriculture, Fishing & Hunting | 2 (100.0%) | 0 (0.0%) |
| Mining, Quarrying, & Extraction | 0 (0.0%) | 0 (0.0%) |
| Construction | 9 (75.0%) | 3 (25.0%) |
| Manufacturing | 3 (100.0%) | 0 (0.0%) |
| Wholesale Trade | 5 (83.3%) | 1 (16.7%) |
| Retail Trade | 9 (69.2%) | 4 (30.8%) |
| Transportation & Warehousing | 4 (100.0%) | 0 (0.0%) |
| Utilities | 4 (100.0%) | 0 (0.0%) |
| Information | 0 (0.0%) | 0 (0.0%) |
| Finance & Insurance | 0 (0.0%) | 3 (100.0%) |
| Real Estate, Rental & Leasing | 0 (0.0%) | 0 (0.0%) |
| Professional & Scientific | 0 (0.0%) | 2 (100.0%) |
| Enterprise Management | 0 (0.0%) | 0 (0.0%) |
| Administrative & Support | 1 (100.0%) | 0 (0.0%) |
| Educational Services | 0 (0.0%) | 8 (100.0%) |
| Health Care & Social Assistance | 8 (22.9%) | 27 (77.1%) |
| Arts, Entertainment & Recreation | 0 (0.0%) | 0 (0.0%) |
| Accommodation & Food Services | 0 (0.0%) | 0 (0.0%) |
| Public Administration | 3 (60.0%) | 2 (40.0%) |
| Total | 48 (48.5%) | 51 (51.5%) |
Education in Pickrell
School Enrollment in Pickrell
The most common levels of schooling among the 54 students in Pickrell are high school (24 | 44.4%), middle school (13 | 24.1%), and elementary school (7 | 13.0%).
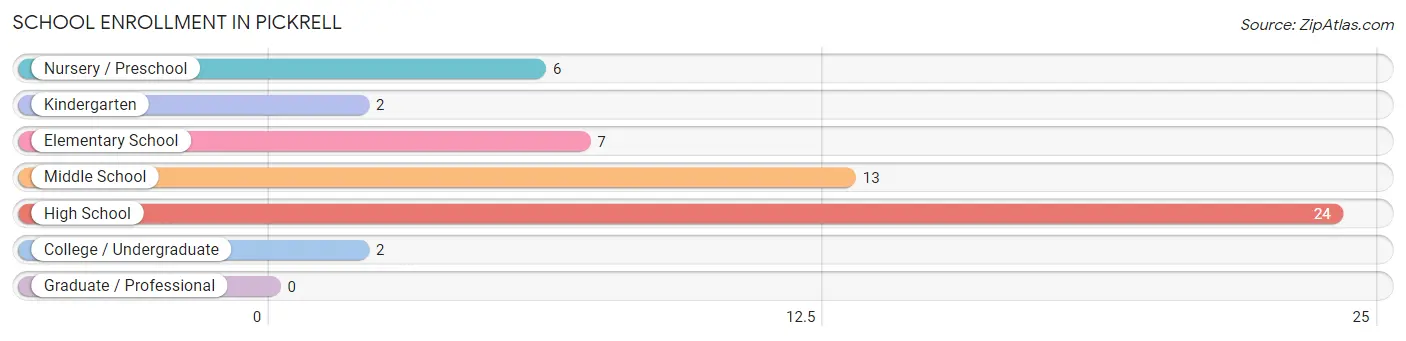
| School Level | # Students | % Students |
| Nursery / Preschool | 6 | 11.1% |
| Kindergarten | 2 | 3.7% |
| Elementary School | 7 | 13.0% |
| Middle School | 13 | 24.1% |
| High School | 24 | 44.4% |
| College / Undergraduate | 2 | 3.7% |
| Graduate / Professional | 0 | 0.0% |
| Total | 54 | 100.0% |
School Enrollment by Age by Funding Source in Pickrell
Out of a total of 54 students who are enrolled in schools in Pickrell, 4 (7.4%) attend a private institution, while the remaining 50 (92.6%) are enrolled in public schools. The age group of 5 to 9 year old has the highest likelihood of being enrolled in private schools, with 4 (36.4% in the age bracket) enrolled. Conversely, the age group of 3 to 4 year olds has the lowest likelihood of being enrolled in a private school, with 4 (100.0% in the age bracket) attending a public institution.
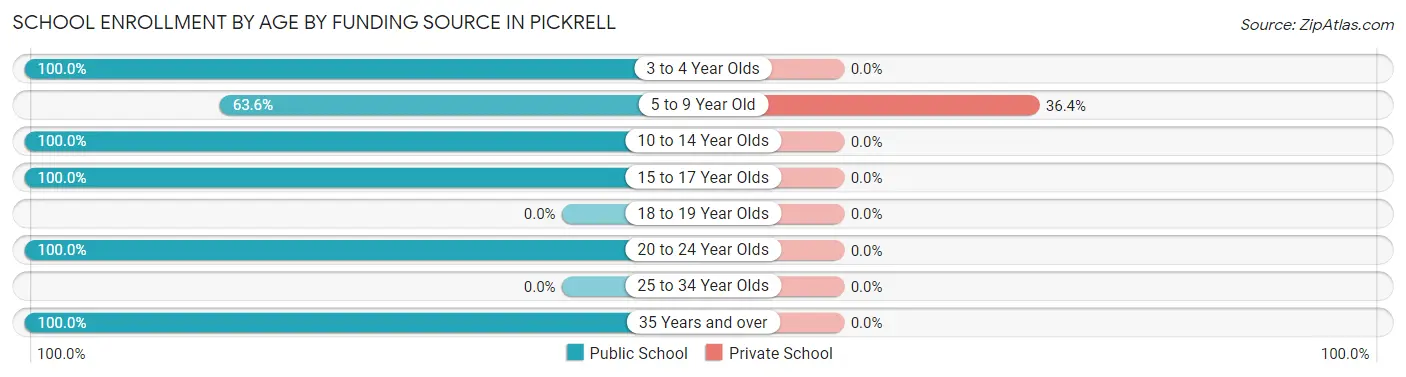
| Age Bracket | Public School | Private School |
| 3 to 4 Year Olds | 4 (100.0%) | 0 (0.0%) |
| 5 to 9 Year Old | 7 (63.6%) | 4 (36.4%) |
| 10 to 14 Year Olds | 22 (100.0%) | 0 (0.0%) |
| 15 to 17 Year Olds | 11 (100.0%) | 0 (0.0%) |
| 18 to 19 Year Olds | 0 (0.0%) | 0 (0.0%) |
| 20 to 24 Year Olds | 4 (100.0%) | 0 (0.0%) |
| 25 to 34 Year Olds | 0 (0.0%) | 0 (0.0%) |
| 35 Years and over | 2 (100.0%) | 0 (0.0%) |
| Total | 50 (92.6%) | 4 (7.4%) |
Educational Attainment by Field of Study in Pickrell
Business (7 | 24.1%), education (7 | 24.1%), computers & mathematics (6 | 20.7%), science & technology (6 | 20.7%), and liberal arts & history (2 | 6.9%) are the most common fields of study among 29 individuals in Pickrell who have obtained a bachelor's degree or higher.
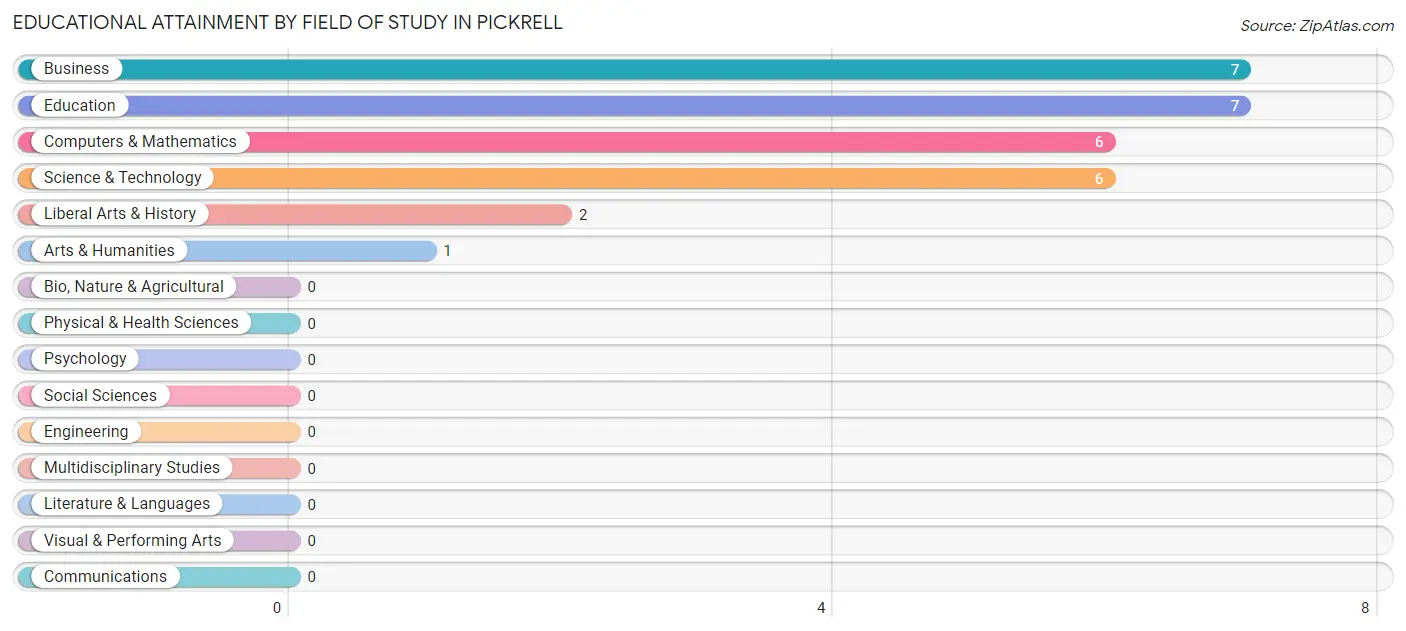
| Field of Study | # Graduates | % Graduates |
| Computers & Mathematics | 6 | 20.7% |
| Bio, Nature & Agricultural | 0 | 0.0% |
| Physical & Health Sciences | 0 | 0.0% |
| Psychology | 0 | 0.0% |
| Social Sciences | 0 | 0.0% |
| Engineering | 0 | 0.0% |
| Multidisciplinary Studies | 0 | 0.0% |
| Science & Technology | 6 | 20.7% |
| Business | 7 | 24.1% |
| Education | 7 | 24.1% |
| Literature & Languages | 0 | 0.0% |
| Liberal Arts & History | 2 | 6.9% |
| Visual & Performing Arts | 0 | 0.0% |
| Communications | 0 | 0.0% |
| Arts & Humanities | 1 | 3.5% |
| Total | 29 | 100.0% |
Transportation & Commute in Pickrell
Vehicle Availability by Sex in Pickrell
The most prevalent vehicle ownership categories in Pickrell are males with 2 vehicles (18, accounting for 37.5%) and females with 2 vehicles (18, making up 35.3%).
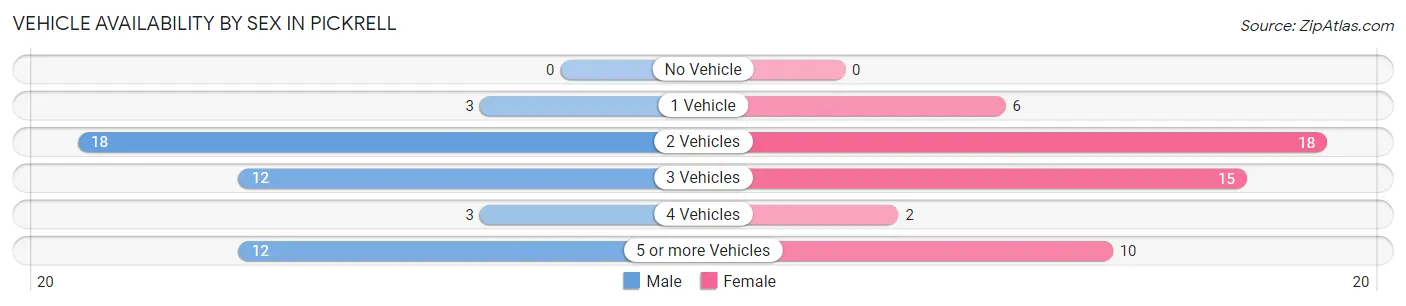
| Vehicles Available | Male | Female |
| No Vehicle | 0 (0.0%) | 0 (0.0%) |
| 1 Vehicle | 3 (6.2%) | 6 (11.8%) |
| 2 Vehicles | 18 (37.5%) | 18 (35.3%) |
| 3 Vehicles | 12 (25.0%) | 15 (29.4%) |
| 4 Vehicles | 3 (6.2%) | 2 (3.9%) |
| 5 or more Vehicles | 12 (25.0%) | 10 (19.6%) |
| Total | 48 (100.0%) | 51 (100.0%) |
Commute Time in Pickrell
The most frequently occuring commute durations in Pickrell are 15 to 19 minutes (20 commuters, 20.2%), 10 to 14 minutes (17 commuters, 17.2%), and 20 to 24 minutes (16 commuters, 16.2%).
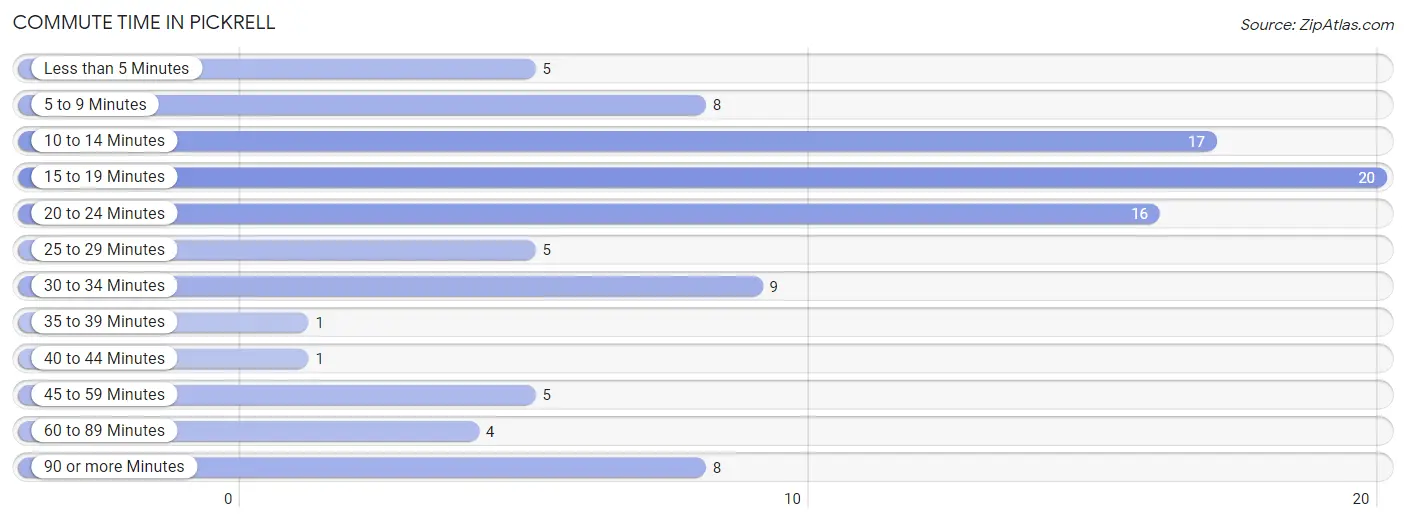
| Commute Time | # Commuters | % Commuters |
| Less than 5 Minutes | 5 | 5.1% |
| 5 to 9 Minutes | 8 | 8.1% |
| 10 to 14 Minutes | 17 | 17.2% |
| 15 to 19 Minutes | 20 | 20.2% |
| 20 to 24 Minutes | 16 | 16.2% |
| 25 to 29 Minutes | 5 | 5.1% |
| 30 to 34 Minutes | 9 | 9.1% |
| 35 to 39 Minutes | 1 | 1.0% |
| 40 to 44 Minutes | 1 | 1.0% |
| 45 to 59 Minutes | 5 | 5.1% |
| 60 to 89 Minutes | 4 | 4.0% |
| 90 or more Minutes | 8 | 8.1% |
Commute Time by Sex in Pickrell
The most common commute times in Pickrell are 15 to 19 minutes (10 commuters, 20.8%) for males and 10 to 14 minutes (10 commuters, 19.6%) for females.
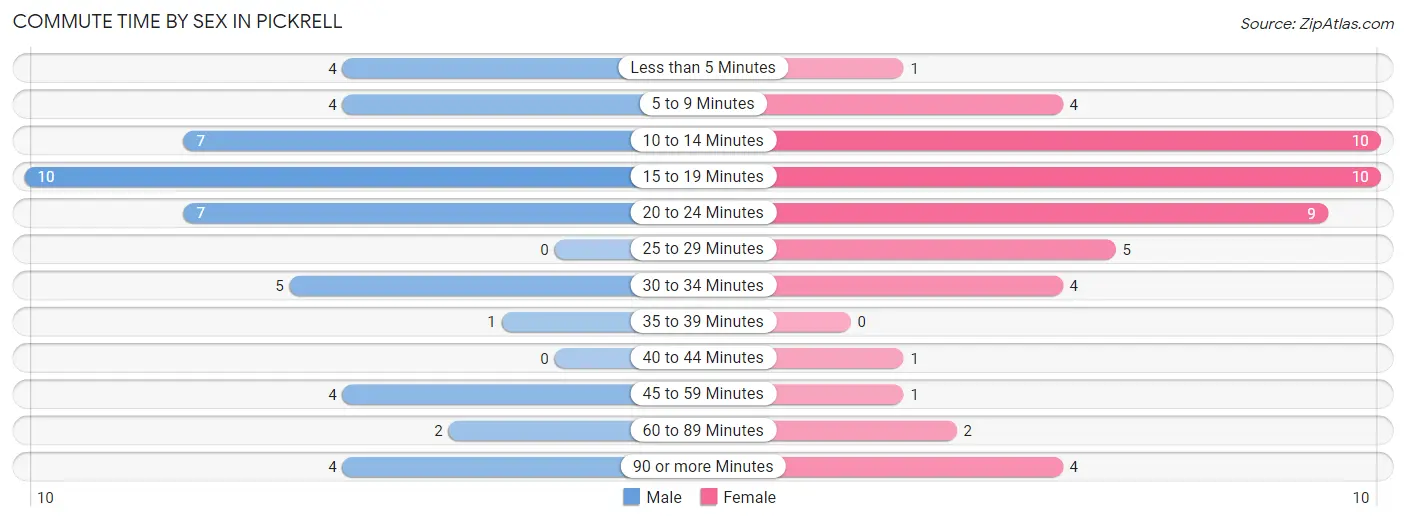
| Commute Time | Male | Female |
| Less than 5 Minutes | 4 (8.3%) | 1 (2.0%) |
| 5 to 9 Minutes | 4 (8.3%) | 4 (7.8%) |
| 10 to 14 Minutes | 7 (14.6%) | 10 (19.6%) |
| 15 to 19 Minutes | 10 (20.8%) | 10 (19.6%) |
| 20 to 24 Minutes | 7 (14.6%) | 9 (17.6%) |
| 25 to 29 Minutes | 0 (0.0%) | 5 (9.8%) |
| 30 to 34 Minutes | 5 (10.4%) | 4 (7.8%) |
| 35 to 39 Minutes | 1 (2.1%) | 0 (0.0%) |
| 40 to 44 Minutes | 0 (0.0%) | 1 (2.0%) |
| 45 to 59 Minutes | 4 (8.3%) | 1 (2.0%) |
| 60 to 89 Minutes | 2 (4.2%) | 2 (3.9%) |
| 90 or more Minutes | 4 (8.3%) | 4 (7.8%) |
Time of Departure to Work by Sex in Pickrell
The most frequent times of departure to work in Pickrell are 7:00 AM to 7:29 AM (12, 25.0%) for males and 7:00 AM to 7:29 AM (17, 33.3%) for females.
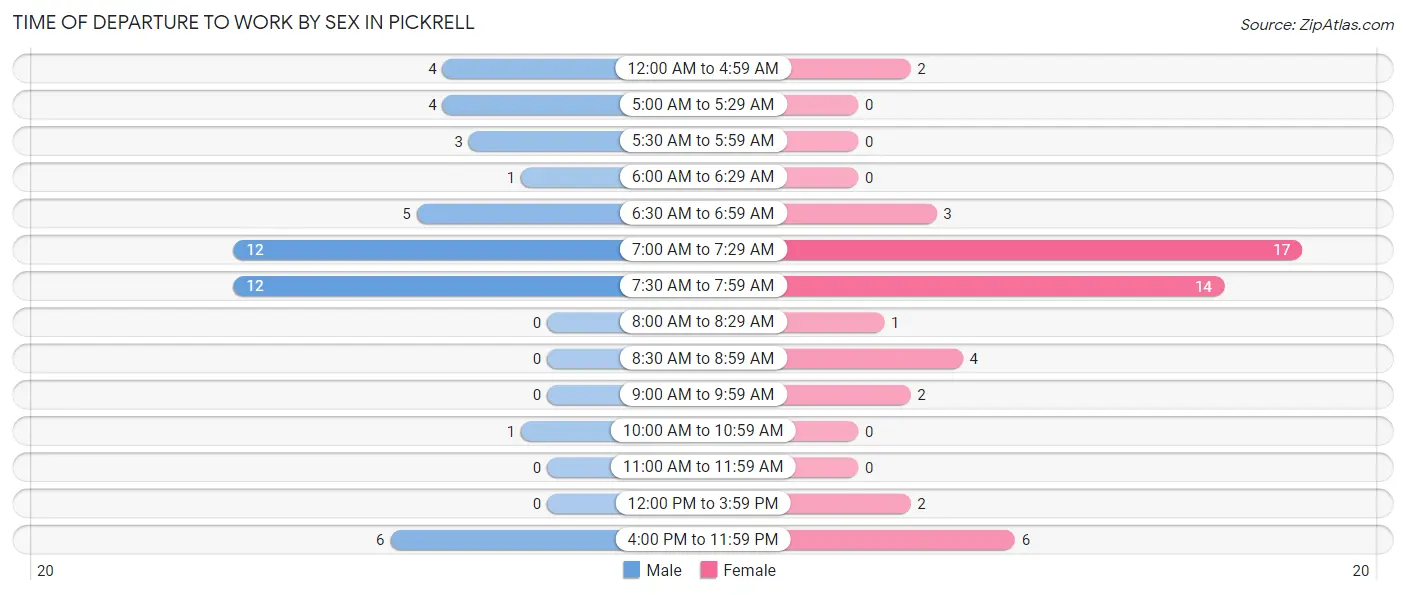
| Time of Departure | Male | Female |
| 12:00 AM to 4:59 AM | 4 (8.3%) | 2 (3.9%) |
| 5:00 AM to 5:29 AM | 4 (8.3%) | 0 (0.0%) |
| 5:30 AM to 5:59 AM | 3 (6.2%) | 0 (0.0%) |
| 6:00 AM to 6:29 AM | 1 (2.1%) | 0 (0.0%) |
| 6:30 AM to 6:59 AM | 5 (10.4%) | 3 (5.9%) |
| 7:00 AM to 7:29 AM | 12 (25.0%) | 17 (33.3%) |
| 7:30 AM to 7:59 AM | 12 (25.0%) | 14 (27.5%) |
| 8:00 AM to 8:29 AM | 0 (0.0%) | 1 (2.0%) |
| 8:30 AM to 8:59 AM | 0 (0.0%) | 4 (7.8%) |
| 9:00 AM to 9:59 AM | 0 (0.0%) | 2 (3.9%) |
| 10:00 AM to 10:59 AM | 1 (2.1%) | 0 (0.0%) |
| 11:00 AM to 11:59 AM | 0 (0.0%) | 0 (0.0%) |
| 12:00 PM to 3:59 PM | 0 (0.0%) | 2 (3.9%) |
| 4:00 PM to 11:59 PM | 6 (12.5%) | 6 (11.8%) |
| Total | 48 (100.0%) | 51 (100.0%) |
Housing Occupancy in Pickrell
Occupancy by Ownership in Pickrell
Of the total 89 dwellings in Pickrell, owner-occupied units account for 82 (92.1%), while renter-occupied units make up 7 (7.9%).
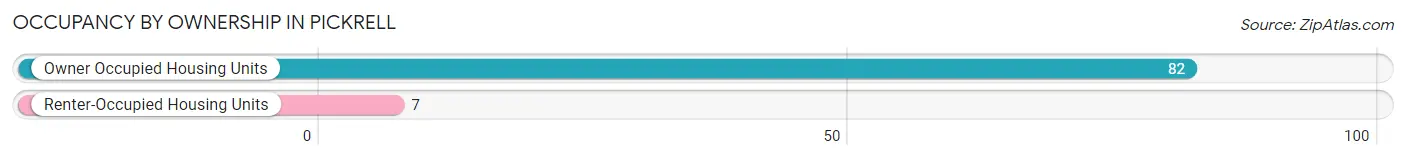
| Occupancy | # Housing Units | % Housing Units |
| Owner Occupied Housing Units | 82 | 92.1% |
| Renter-Occupied Housing Units | 7 | 7.9% |
| Total Occupied Housing Units | 89 | 100.0% |
Occupancy by Household Size in Pickrell
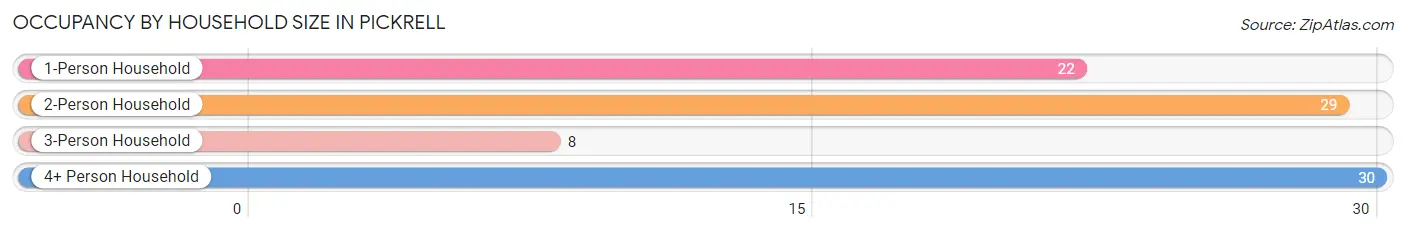
| Household Size | # Housing Units | % Housing Units |
| 1-Person Household | 22 | 24.7% |
| 2-Person Household | 29 | 32.6% |
| 3-Person Household | 8 | 9.0% |
| 4+ Person Household | 30 | 33.7% |
| Total Housing Units | 89 | 100.0% |
Occupancy by Ownership by Household Size in Pickrell
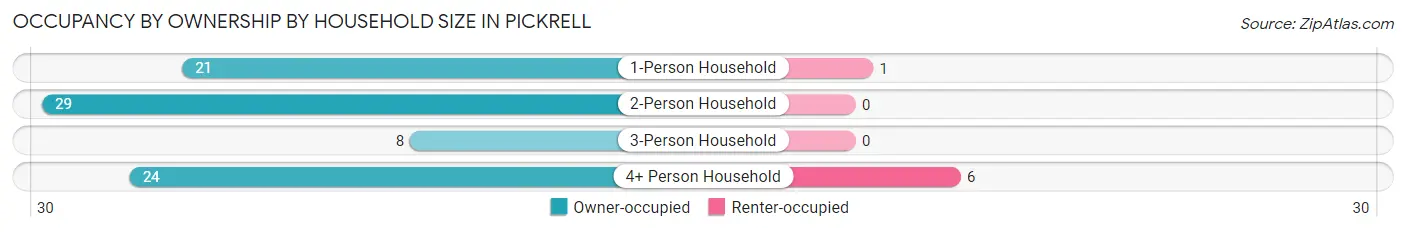
| Household Size | Owner-occupied | Renter-occupied |
| 1-Person Household | 21 (95.5%) | 1 (4.5%) |
| 2-Person Household | 29 (100.0%) | 0 (0.0%) |
| 3-Person Household | 8 (100.0%) | 0 (0.0%) |
| 4+ Person Household | 24 (80.0%) | 6 (20.0%) |
| Total Housing Units | 82 (92.1%) | 7 (7.9%) |
Occupancy by Educational Attainment in Pickrell
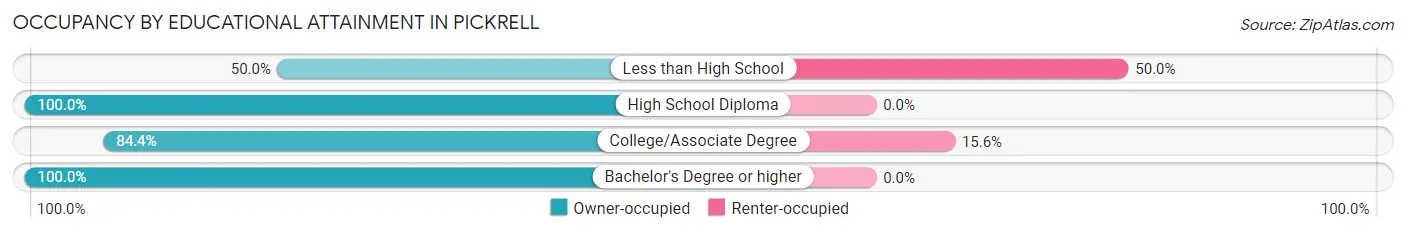
| Household Size | Owner-occupied | Renter-occupied |
| Less than High School | 2 (50.0%) | 2 (50.0%) |
| High School Diploma | 36 (100.0%) | 0 (0.0%) |
| College/Associate Degree | 27 (84.4%) | 5 (15.6%) |
| Bachelor's Degree or higher | 17 (100.0%) | 0 (0.0%) |
Occupancy by Age of Householder in Pickrell
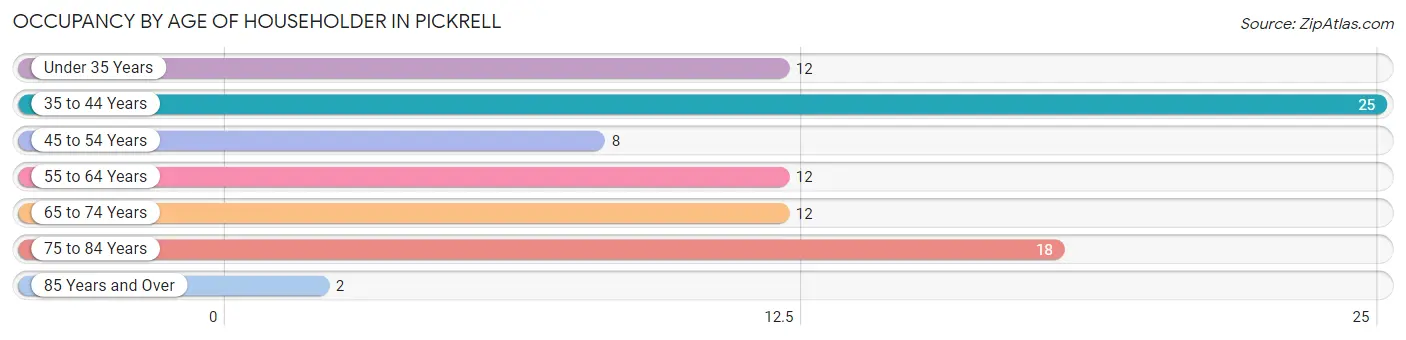
| Age Bracket | # Households | % Households |
| Under 35 Years | 12 | 13.5% |
| 35 to 44 Years | 25 | 28.1% |
| 45 to 54 Years | 8 | 9.0% |
| 55 to 64 Years | 12 | 13.5% |
| 65 to 74 Years | 12 | 13.5% |
| 75 to 84 Years | 18 | 20.2% |
| 85 Years and Over | 2 | 2.2% |
| Total | 89 | 100.0% |
Housing Finances in Pickrell
Median Income by Occupancy in Pickrell
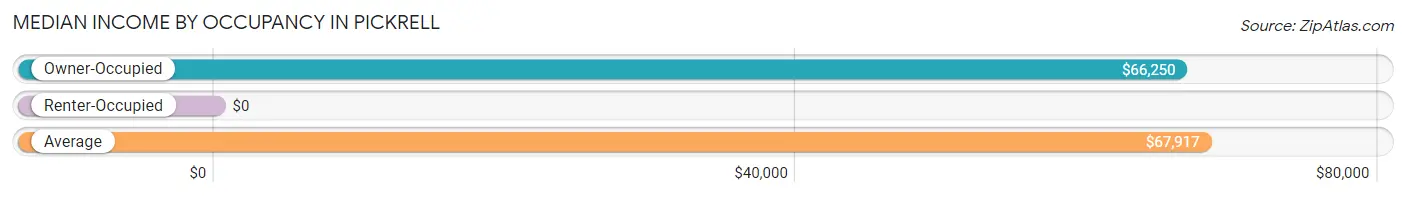
| Occupancy Type | # Households | Median Income |
| Owner-Occupied | 82 (92.1%) | $66,250 |
| Renter-Occupied | 7 (7.9%) | $0 |
| Average | 89 (100.0%) | $67,917 |
Occupancy by Householder Income Bracket in Pickrell
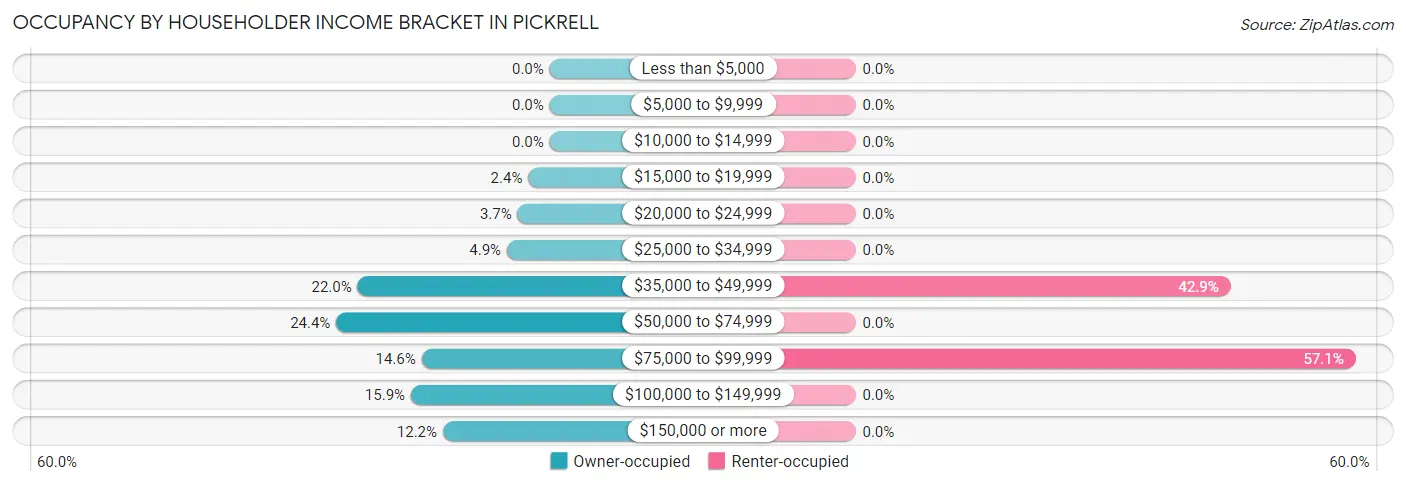
| Income Bracket | Owner-occupied | Renter-occupied |
| Less than $5,000 | 0 (0.0%) | 0 (0.0%) |
| $5,000 to $9,999 | 0 (0.0%) | 0 (0.0%) |
| $10,000 to $14,999 | 0 (0.0%) | 0 (0.0%) |
| $15,000 to $19,999 | 2 (2.4%) | 0 (0.0%) |
| $20,000 to $24,999 | 3 (3.7%) | 0 (0.0%) |
| $25,000 to $34,999 | 4 (4.9%) | 0 (0.0%) |
| $35,000 to $49,999 | 18 (22.0%) | 3 (42.9%) |
| $50,000 to $74,999 | 20 (24.4%) | 0 (0.0%) |
| $75,000 to $99,999 | 12 (14.6%) | 4 (57.1%) |
| $100,000 to $149,999 | 13 (15.9%) | 0 (0.0%) |
| $150,000 or more | 10 (12.2%) | 0 (0.0%) |
| Total | 82 (100.0%) | 7 (100.0%) |
Monthly Housing Cost Tiers in Pickrell
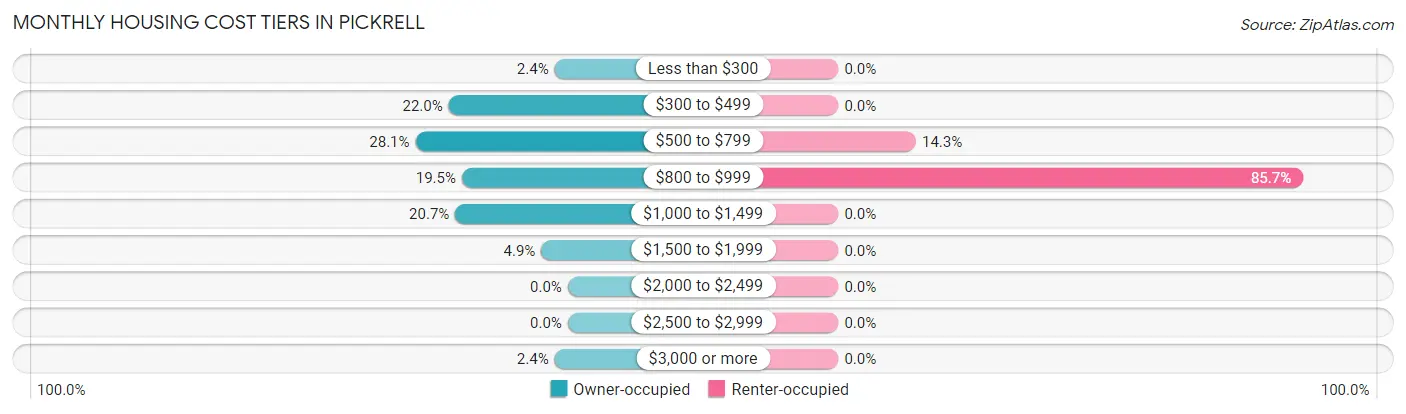
| Monthly Cost | Owner-occupied | Renter-occupied |
| Less than $300 | 2 (2.4%) | 0 (0.0%) |
| $300 to $499 | 18 (22.0%) | 0 (0.0%) |
| $500 to $799 | 23 (28.1%) | 1 (14.3%) |
| $800 to $999 | 16 (19.5%) | 6 (85.7%) |
| $1,000 to $1,499 | 17 (20.7%) | 0 (0.0%) |
| $1,500 to $1,999 | 4 (4.9%) | 0 (0.0%) |
| $2,000 to $2,499 | 0 (0.0%) | 0 (0.0%) |
| $2,500 to $2,999 | 0 (0.0%) | 0 (0.0%) |
| $3,000 or more | 2 (2.4%) | 0 (0.0%) |
| Total | 82 (100.0%) | 7 (100.0%) |
Physical Housing Characteristics in Pickrell
Housing Structures in Pickrell
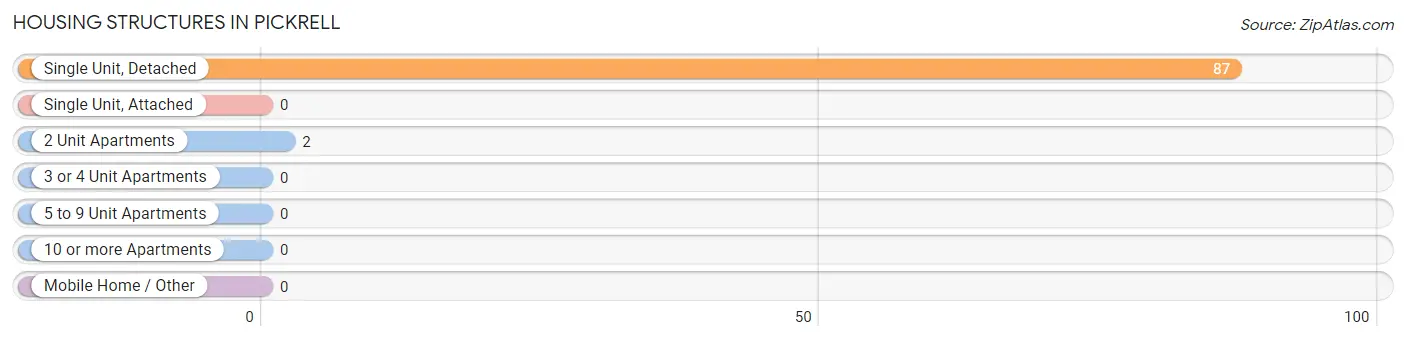
| Structure Type | # Housing Units | % Housing Units |
| Single Unit, Detached | 87 | 97.8% |
| Single Unit, Attached | 0 | 0.0% |
| 2 Unit Apartments | 2 | 2.2% |
| 3 or 4 Unit Apartments | 0 | 0.0% |
| 5 to 9 Unit Apartments | 0 | 0.0% |
| 10 or more Apartments | 0 | 0.0% |
| Mobile Home / Other | 0 | 0.0% |
| Total | 89 | 100.0% |
Housing Structures by Occupancy in Pickrell
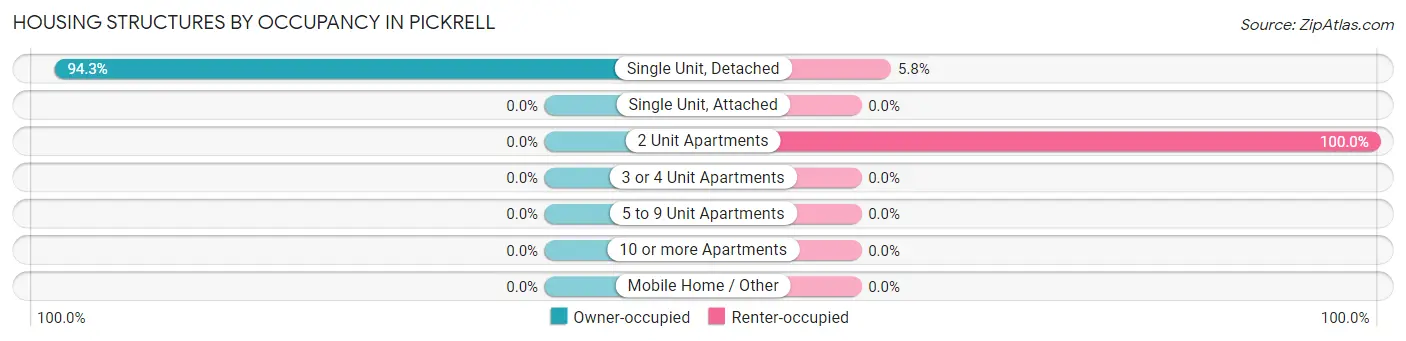
| Structure Type | Owner-occupied | Renter-occupied |
| Single Unit, Detached | 82 (94.3%) | 5 (5.8%) |
| Single Unit, Attached | 0 (0.0%) | 0 (0.0%) |
| 2 Unit Apartments | 0 (0.0%) | 2 (100.0%) |
| 3 or 4 Unit Apartments | 0 (0.0%) | 0 (0.0%) |
| 5 to 9 Unit Apartments | 0 (0.0%) | 0 (0.0%) |
| 10 or more Apartments | 0 (0.0%) | 0 (0.0%) |
| Mobile Home / Other | 0 (0.0%) | 0 (0.0%) |
| Total | 82 (92.1%) | 7 (7.9%) |
Housing Structures by Number of Rooms in Pickrell
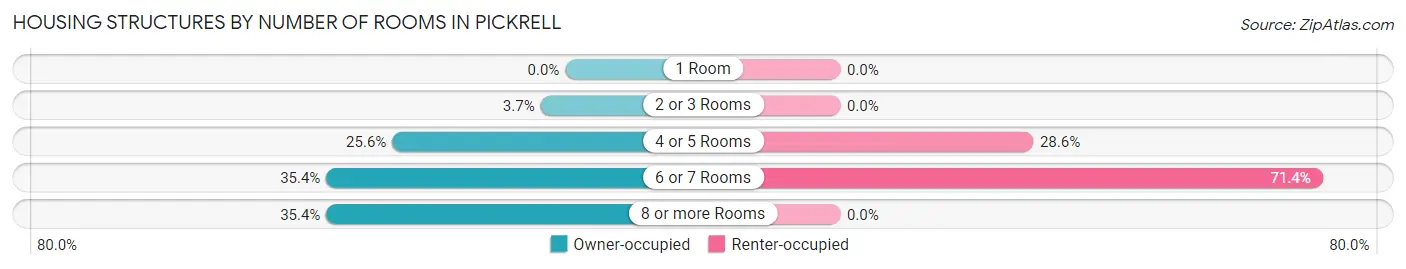
| Number of Rooms | Owner-occupied | Renter-occupied |
| 1 Room | 0 (0.0%) | 0 (0.0%) |
| 2 or 3 Rooms | 3 (3.7%) | 0 (0.0%) |
| 4 or 5 Rooms | 21 (25.6%) | 2 (28.6%) |
| 6 or 7 Rooms | 29 (35.4%) | 5 (71.4%) |
| 8 or more Rooms | 29 (35.4%) | 0 (0.0%) |
| Total | 82 (100.0%) | 7 (100.0%) |
Housing Structure by Heating Type in Pickrell
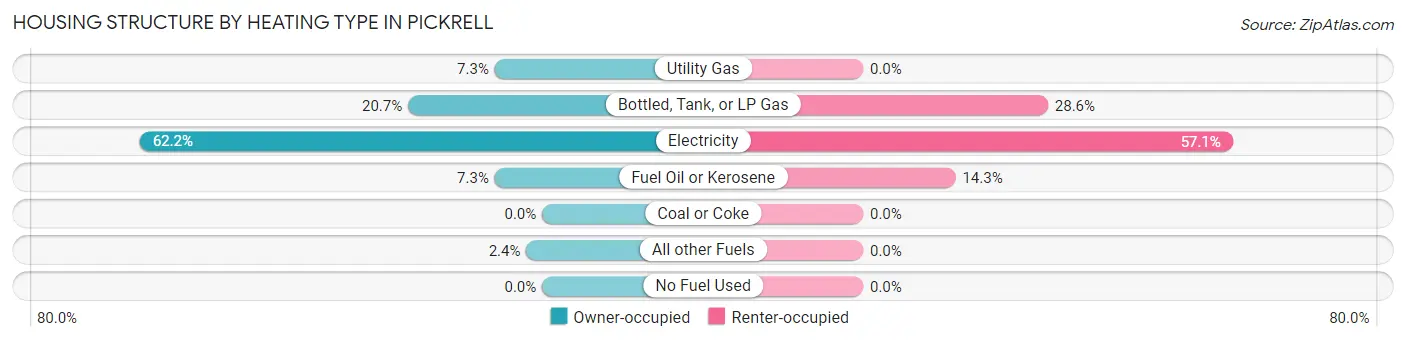
| Heating Type | Owner-occupied | Renter-occupied |
| Utility Gas | 6 (7.3%) | 0 (0.0%) |
| Bottled, Tank, or LP Gas | 17 (20.7%) | 2 (28.6%) |
| Electricity | 51 (62.2%) | 4 (57.1%) |
| Fuel Oil or Kerosene | 6 (7.3%) | 1 (14.3%) |
| Coal or Coke | 0 (0.0%) | 0 (0.0%) |
| All other Fuels | 2 (2.4%) | 0 (0.0%) |
| No Fuel Used | 0 (0.0%) | 0 (0.0%) |
| Total | 82 (100.0%) | 7 (100.0%) |
Household Vehicle Usage in Pickrell
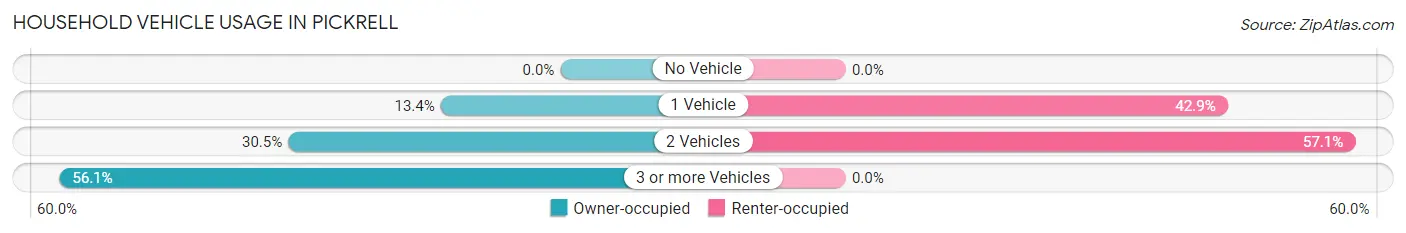
| Vehicles per Household | Owner-occupied | Renter-occupied |
| No Vehicle | 0 (0.0%) | 0 (0.0%) |
| 1 Vehicle | 11 (13.4%) | 3 (42.9%) |
| 2 Vehicles | 25 (30.5%) | 4 (57.1%) |
| 3 or more Vehicles | 46 (56.1%) | 0 (0.0%) |
| Total | 82 (100.0%) | 7 (100.0%) |
Real Estate & Mortgages in Pickrell
Real Estate and Mortgage Overview in Pickrell
| Characteristic | Without Mortgage | With Mortgage |
| Housing Units | 53 | 29 |
| Median Property Value | $145,800 | $177,500 |
| Median Household Income | $72,917 | $3 |
| Monthly Housing Costs | $546 | $2 |
| Real Estate Taxes | $2,405 | $0 |
Property Value by Mortgage Status in Pickrell
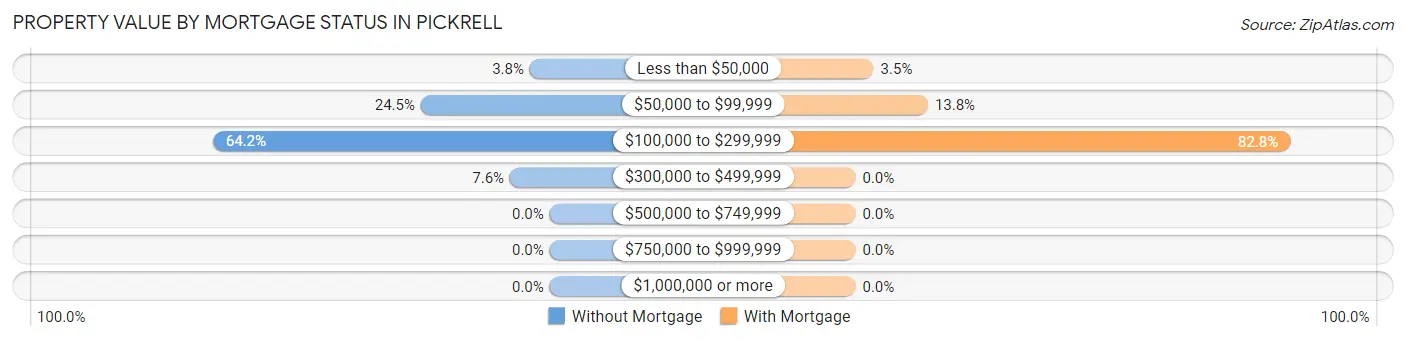
| Property Value | Without Mortgage | With Mortgage |
| Less than $50,000 | 2 (3.8%) | 1 (3.5%) |
| $50,000 to $99,999 | 13 (24.5%) | 4 (13.8%) |
| $100,000 to $299,999 | 34 (64.1%) | 24 (82.8%) |
| $300,000 to $499,999 | 4 (7.5%) | 0 (0.0%) |
| $500,000 to $749,999 | 0 (0.0%) | 0 (0.0%) |
| $750,000 to $999,999 | 0 (0.0%) | 0 (0.0%) |
| $1,000,000 or more | 0 (0.0%) | 0 (0.0%) |
| Total | 53 (100.0%) | 29 (100.0%) |
Household Income by Mortgage Status in Pickrell
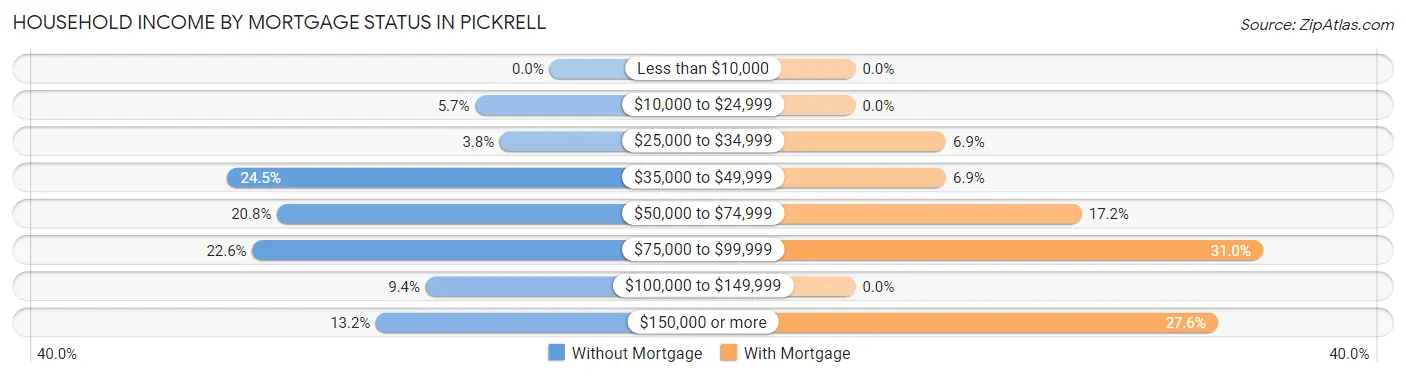
| Household Income | Without Mortgage | With Mortgage |
| Less than $10,000 | 0 (0.0%) | 0 (0.0%) |
| $10,000 to $24,999 | 3 (5.7%) | 0 (0.0%) |
| $25,000 to $34,999 | 2 (3.8%) | 2 (6.9%) |
| $35,000 to $49,999 | 13 (24.5%) | 2 (6.9%) |
| $50,000 to $74,999 | 11 (20.7%) | 5 (17.2%) |
| $75,000 to $99,999 | 12 (22.6%) | 9 (31.0%) |
| $100,000 to $149,999 | 5 (9.4%) | 0 (0.0%) |
| $150,000 or more | 7 (13.2%) | 8 (27.6%) |
| Total | 53 (100.0%) | 29 (100.0%) |
Property Value to Household Income Ratio in Pickrell
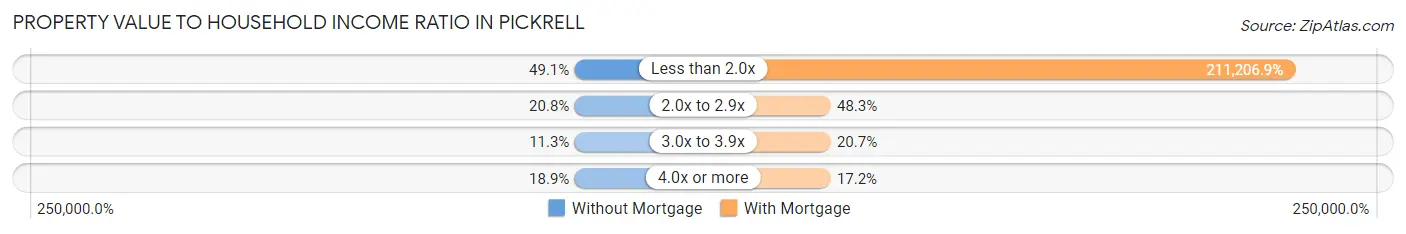
| Value-to-Income Ratio | Without Mortgage | With Mortgage |
| Less than 2.0x | 26 (49.1%) | 61,250 (211,206.9%) |
| 2.0x to 2.9x | 11 (20.7%) | 14 (48.3%) |
| 3.0x to 3.9x | 6 (11.3%) | 6 (20.7%) |
| 4.0x or more | 10 (18.9%) | 5 (17.2%) |
| Total | 53 (100.0%) | 29 (100.0%) |
Real Estate Taxes by Mortgage Status in Pickrell
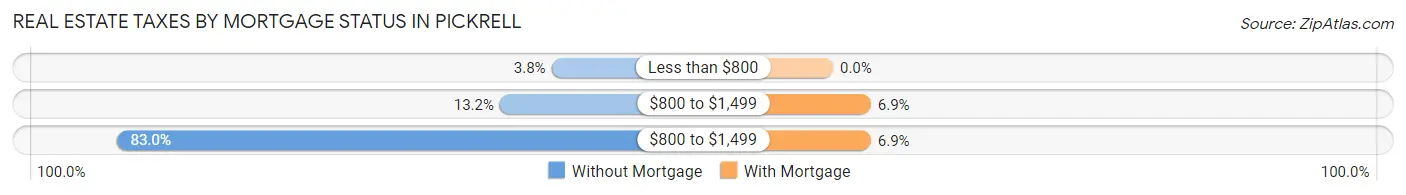
| Property Taxes | Without Mortgage | With Mortgage |
| Less than $800 | 2 (3.8%) | 0 (0.0%) |
| $800 to $1,499 | 7 (13.2%) | 2 (6.9%) |
| $800 to $1,499 | 44 (83.0%) | 2 (6.9%) |
| Total | 53 (100.0%) | 29 (100.0%) |
Health & Disability in Pickrell
Health Insurance Coverage by Age in Pickrell
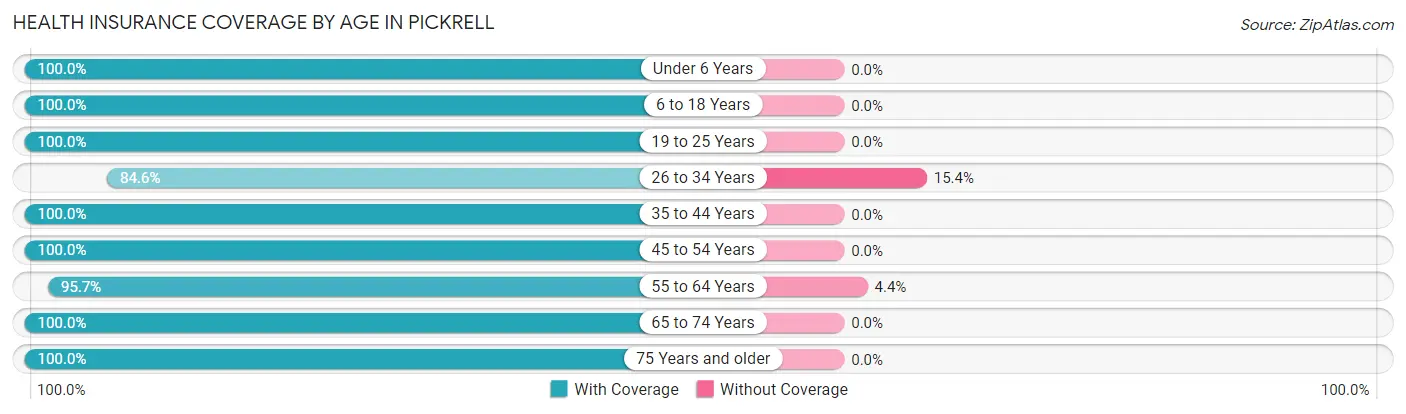
| Age Bracket | With Coverage | Without Coverage |
| Under 6 Years | 28 (100.0%) | 0 (0.0%) |
| 6 to 18 Years | 42 (100.0%) | 0 (0.0%) |
| 19 to 25 Years | 14 (100.0%) | 0 (0.0%) |
| 26 to 34 Years | 11 (84.6%) | 2 (15.4%) |
| 35 to 44 Years | 42 (100.0%) | 0 (0.0%) |
| 45 to 54 Years | 12 (100.0%) | 0 (0.0%) |
| 55 to 64 Years | 22 (95.7%) | 1 (4.3%) |
| 65 to 74 Years | 24 (100.0%) | 0 (0.0%) |
| 75 Years and older | 23 (100.0%) | 0 (0.0%) |
| Total | 218 (98.6%) | 3 (1.4%) |
Health Insurance Coverage by Citizenship Status in Pickrell
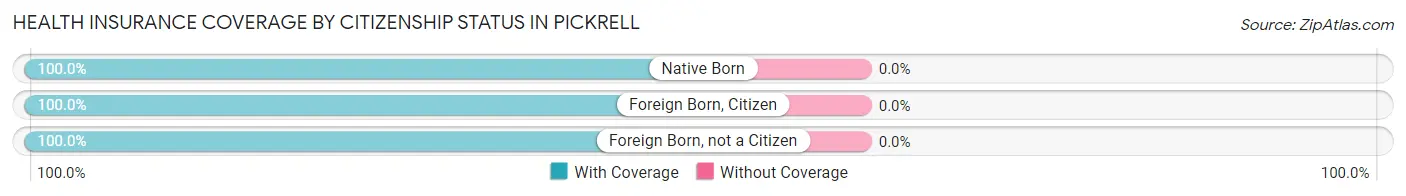
| Citizenship Status | With Coverage | Without Coverage |
| Native Born | 28 (100.0%) | 0 (0.0%) |
| Foreign Born, Citizen | 42 (100.0%) | 0 (0.0%) |
| Foreign Born, not a Citizen | 14 (100.0%) | 0 (0.0%) |
Health Insurance Coverage by Household Income in Pickrell
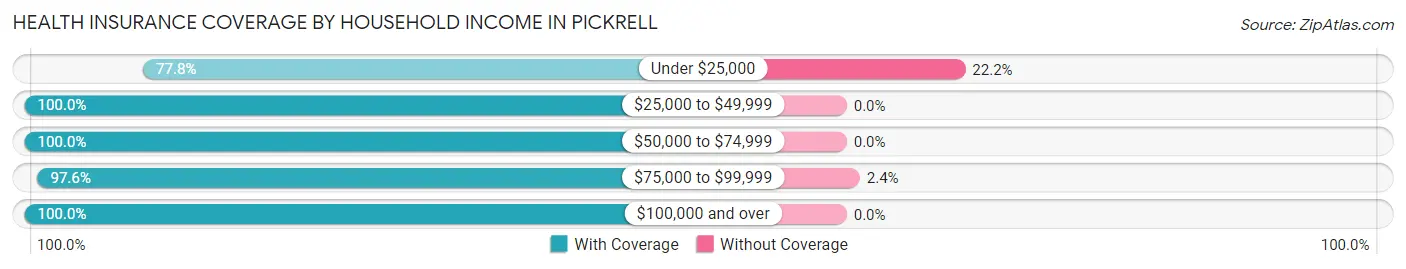
| Household Income | With Coverage | Without Coverage |
| Under $25,000 | 7 (77.8%) | 2 (22.2%) |
| $25,000 to $49,999 | 44 (100.0%) | 0 (0.0%) |
| $50,000 to $74,999 | 41 (100.0%) | 0 (0.0%) |
| $75,000 to $99,999 | 40 (97.6%) | 1 (2.4%) |
| $100,000 and over | 86 (100.0%) | 0 (0.0%) |
Public vs Private Health Insurance Coverage by Age in Pickrell
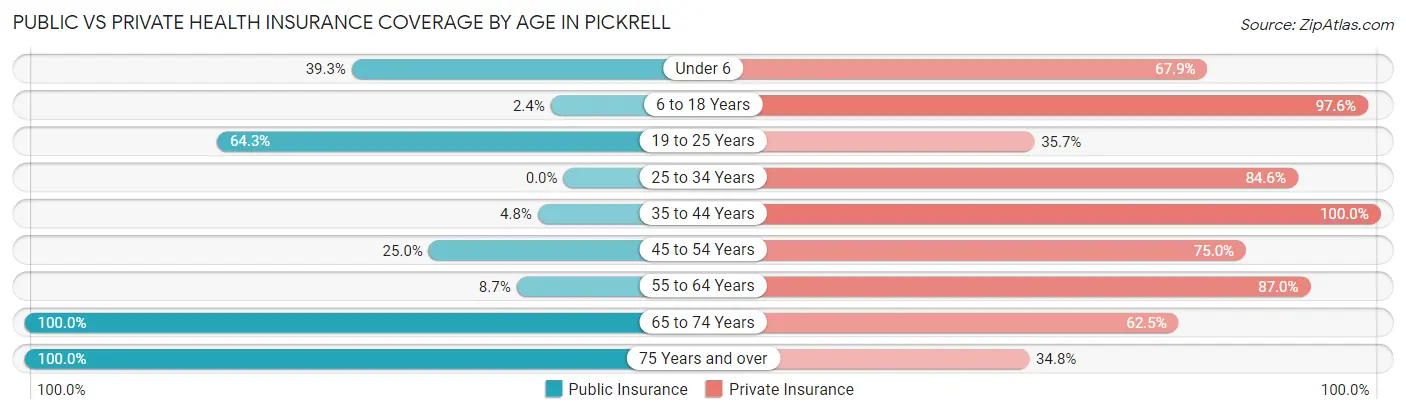
| Age Bracket | Public Insurance | Private Insurance |
| Under 6 | 11 (39.3%) | 19 (67.9%) |
| 6 to 18 Years | 1 (2.4%) | 41 (97.6%) |
| 19 to 25 Years | 9 (64.3%) | 5 (35.7%) |
| 25 to 34 Years | 0 (0.0%) | 11 (84.6%) |
| 35 to 44 Years | 2 (4.8%) | 42 (100.0%) |
| 45 to 54 Years | 3 (25.0%) | 9 (75.0%) |
| 55 to 64 Years | 2 (8.7%) | 20 (87.0%) |
| 65 to 74 Years | 24 (100.0%) | 15 (62.5%) |
| 75 Years and over | 23 (100.0%) | 8 (34.8%) |
| Total | 75 (33.9%) | 170 (76.9%) |
Disability Status by Sex by Age in Pickrell
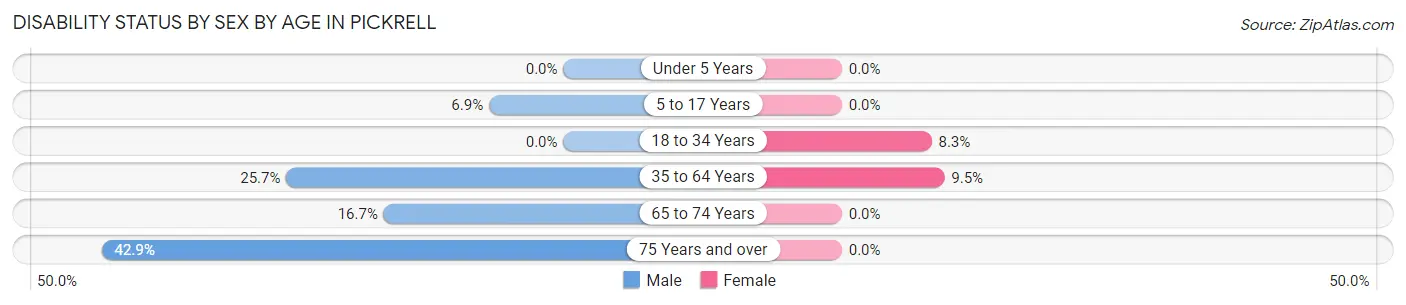
| Age Bracket | Male | Female |
| Under 5 Years | 0 (0.0%) | 0 (0.0%) |
| 5 to 17 Years | 2 (6.9%) | 0 (0.0%) |
| 18 to 34 Years | 0 (0.0%) | 1 (8.3%) |
| 35 to 64 Years | 9 (25.7%) | 4 (9.5%) |
| 65 to 74 Years | 2 (16.7%) | 0 (0.0%) |
| 75 Years and over | 6 (42.9%) | 0 (0.0%) |
Disability Class by Sex by Age in Pickrell
Disability Class: Hearing Difficulty
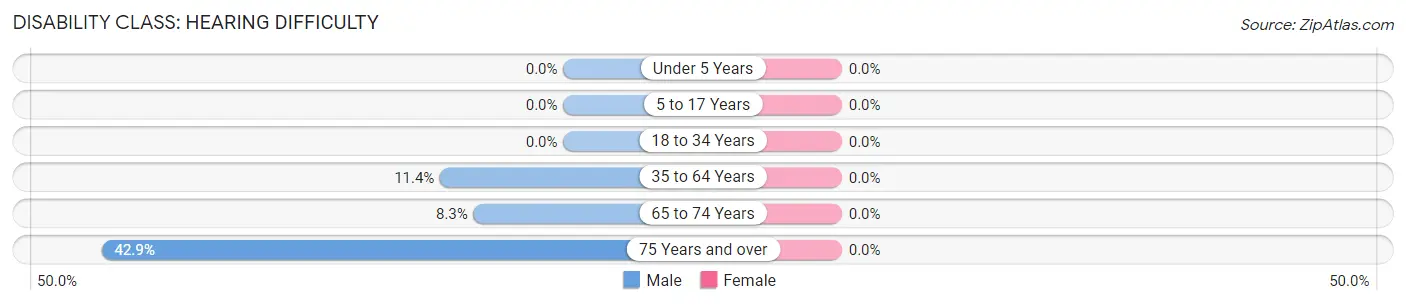
| Age Bracket | Male | Female |
| Under 5 Years | 0 (0.0%) | 0 (0.0%) |
| 5 to 17 Years | 0 (0.0%) | 0 (0.0%) |
| 18 to 34 Years | 0 (0.0%) | 0 (0.0%) |
| 35 to 64 Years | 4 (11.4%) | 0 (0.0%) |
| 65 to 74 Years | 1 (8.3%) | 0 (0.0%) |
| 75 Years and over | 6 (42.9%) | 0 (0.0%) |
Disability Class: Vision Difficulty
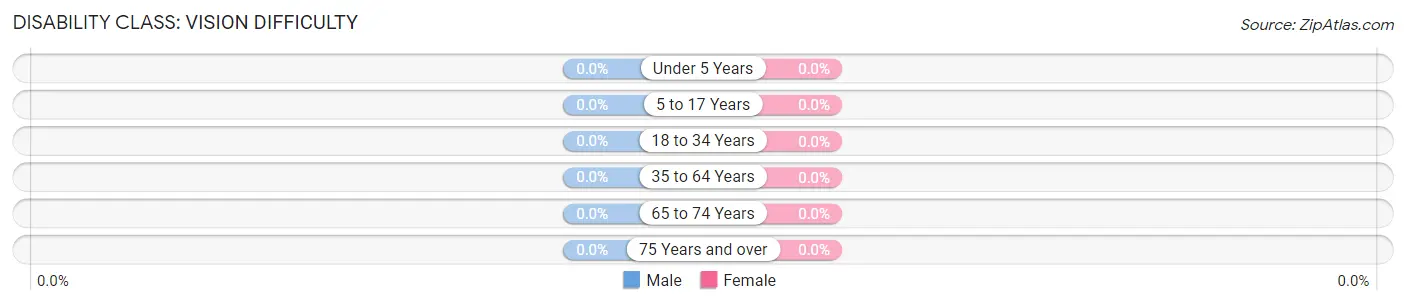
| Age Bracket | Male | Female |
| Under 5 Years | 0 (0.0%) | 0 (0.0%) |
| 5 to 17 Years | 0 (0.0%) | 0 (0.0%) |
| 18 to 34 Years | 0 (0.0%) | 0 (0.0%) |
| 35 to 64 Years | 0 (0.0%) | 0 (0.0%) |
| 65 to 74 Years | 0 (0.0%) | 0 (0.0%) |
| 75 Years and over | 0 (0.0%) | 0 (0.0%) |
Disability Class: Cognitive Difficulty
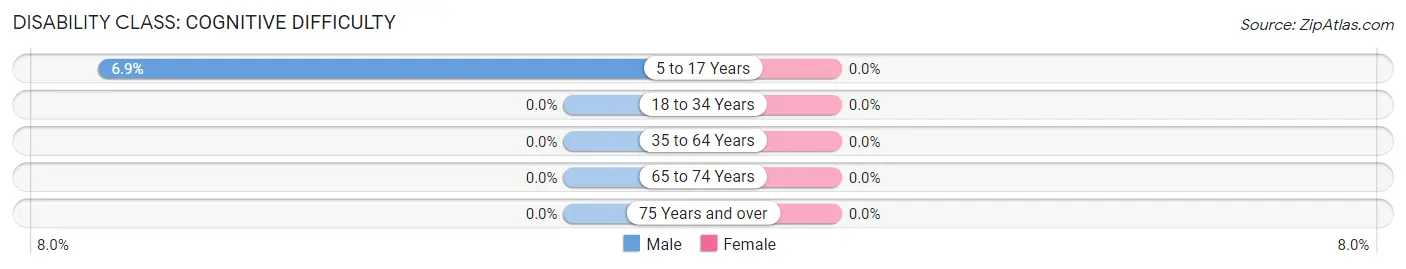
| Age Bracket | Male | Female |
| 5 to 17 Years | 2 (6.9%) | 0 (0.0%) |
| 18 to 34 Years | 0 (0.0%) | 0 (0.0%) |
| 35 to 64 Years | 0 (0.0%) | 0 (0.0%) |
| 65 to 74 Years | 0 (0.0%) | 0 (0.0%) |
| 75 Years and over | 0 (0.0%) | 0 (0.0%) |
Disability Class: Ambulatory Difficulty
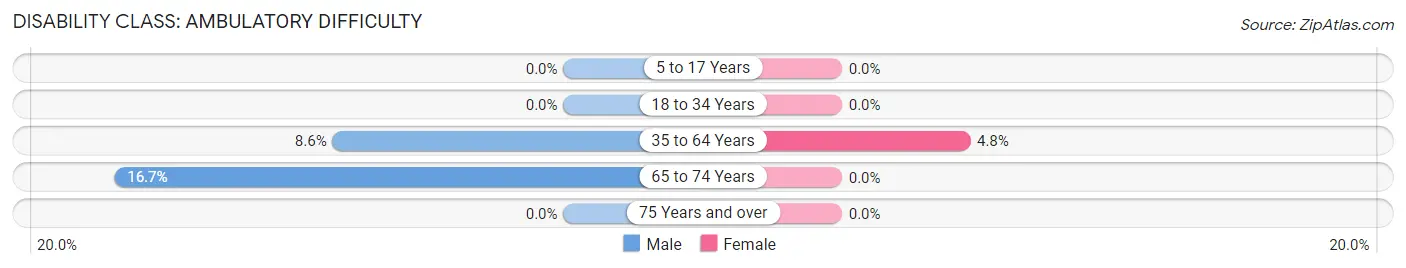
| Age Bracket | Male | Female |
| 5 to 17 Years | 0 (0.0%) | 0 (0.0%) |
| 18 to 34 Years | 0 (0.0%) | 0 (0.0%) |
| 35 to 64 Years | 3 (8.6%) | 2 (4.8%) |
| 65 to 74 Years | 2 (16.7%) | 0 (0.0%) |
| 75 Years and over | 0 (0.0%) | 0 (0.0%) |
Disability Class: Self-Care Difficulty
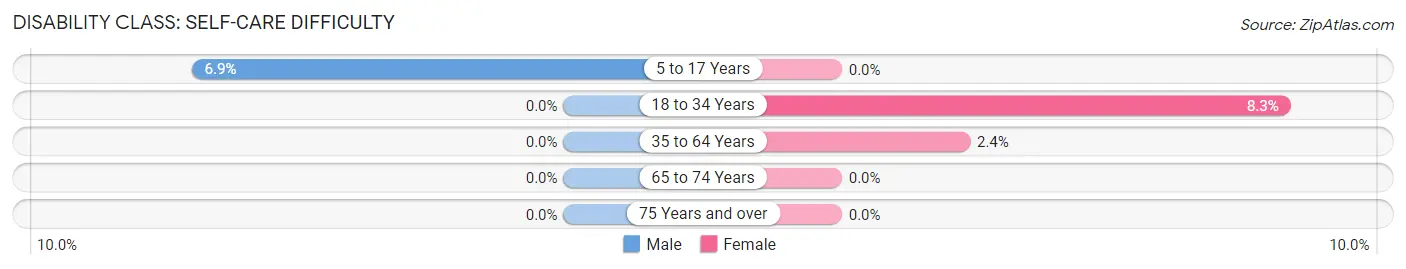
| Age Bracket | Male | Female |
| 5 to 17 Years | 2 (6.9%) | 0 (0.0%) |
| 18 to 34 Years | 0 (0.0%) | 1 (8.3%) |
| 35 to 64 Years | 0 (0.0%) | 1 (2.4%) |
| 65 to 74 Years | 0 (0.0%) | 0 (0.0%) |
| 75 Years and over | 0 (0.0%) | 0 (0.0%) |
Technology Access in Pickrell
Computing Device Access in Pickrell
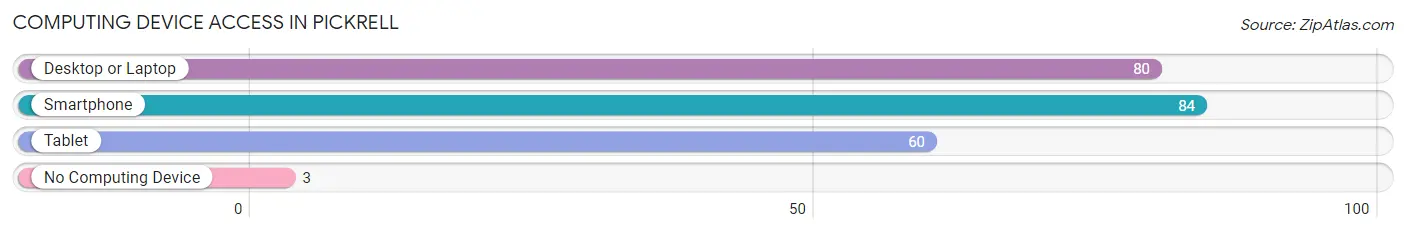
| Device Type | # Households | % Households |
| Desktop or Laptop | 80 | 89.9% |
| Smartphone | 84 | 94.4% |
| Tablet | 60 | 67.4% |
| No Computing Device | 3 | 3.4% |
| Total | 89 | 100.0% |
Internet Access in Pickrell
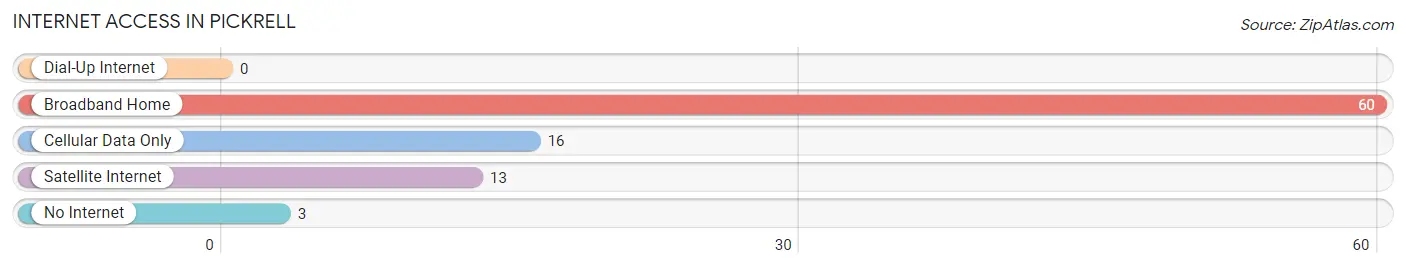
| Internet Type | # Households | % Households |
| Dial-Up Internet | 0 | 0.0% |
| Broadband Home | 60 | 67.4% |
| Cellular Data Only | 16 | 18.0% |
| Satellite Internet | 13 | 14.6% |
| No Internet | 3 | 3.4% |
| Total | 89 | 100.0% |
Pickrell Summary
History
Pickrell is a small village located in Gage County, Nebraska. It was founded in 1871 by a group of settlers from Ohio. The town was named after one of the settlers, William Pickrell. The first post office was established in 1872 and the first school was built in 1873.
The town grew slowly but steadily over the years, and by the early 1900s it had a population of around 500 people. The town was primarily an agricultural community, with most of the residents working in farming and ranching. The town also had a few small businesses, including a general store, a blacksmith shop, and a hotel.
In the early 1900s, the town was connected to the rest of the state by the Burlington and Missouri River Railroad. This allowed the town to become more connected to the rest of the state and to the rest of the country.
In the 1950s, the town began to decline as many of the residents moved away to larger cities. By the 1970s, the population had dropped to around 200 people. However, in recent years, the town has seen a resurgence in population and is now home to around 500 people.
Geography
Pickrell is located in Gage County, Nebraska. It is situated in the southeastern part of the state, about 25 miles south of Lincoln. The town is located on the banks of the Big Blue River, which flows through the area.
The town is surrounded by rolling hills and farmland. The area is known for its fertile soil and is home to many farms and ranches. The town is also located near several lakes, including Lake McConaughy and Lake Ogallala.
Economy
The economy of Pickrell is primarily based on agriculture. The town is home to many farms and ranches, which produce a variety of crops, including corn, soybeans, and wheat. The town also has a few small businesses, including a general store, a blacksmith shop, and a hotel.
The town is also home to a few manufacturing companies, which produce a variety of products, including furniture, clothing, and electronics. The town is also home to a few restaurants and bars, which provide employment to many of the town’s residents.
Demographics
As of the 2010 census, the population of Pickrell was 514 people. The town is predominantly white, with 92.3% of the population being white. The town also has a small Hispanic population, with 4.7% of the population being Hispanic. The town also has a small African American population, with 1.2% of the population being African American.
The median household income in Pickrell is $45,000, which is slightly lower than the national median of $50,000. The median age in Pickrell is 38.7 years, which is slightly higher than the national median of 37.5 years. The town has a poverty rate of 11.3%, which is slightly higher than the national poverty rate of 10.5%.
Common Questions
What is the Total Population of Pickrell?
Total Population of Pickrell is 221.
What is the Total Male Population of Pickrell?
Total Male Population of Pickrell is 116.
What is the Total Female Population of Pickrell?
Total Female Population of Pickrell is 105.
What is the Ratio of Males per 100 Females in Pickrell?
There are 110.48 Males per 100 Females in Pickrell.
What is the Ratio of Females per 100 Males in Pickrell?
There are 90.52 Females per 100 Males in Pickrell.
What is the Median Population Age in Pickrell?
Median Population Age in Pickrell is 39.5 Years.
What is the Average Family Size in Pickrell
Average Family Size in Pickrell is 2.9 People.
What is the Average Household Size in Pickrell
Average Household Size in Pickrell is 2.5 People.
What is Per Capita Income in Pickrell?
Per Capita income in Pickrell is $32,600.
What is the Median Family Income in Pickrell?
Median Family Income in Pickrell is $83,750.
What is the Median Household income in Pickrell?
Median Household Income in Pickrell is $67,917.
What is Income or Wage Gap in Pickrell?
Income or Wage Gap in Pickrell is 39.2%.
Women in Pickrell earn 60.8 cents for every dollar earned by a man.
What is Inequality or Gini Index in Pickrell?
Inequality or Gini Index in Pickrell is 0.34.
How Large is the Labor Force in Pickrell?
There are 99 People in the Labor Forcein in Pickrell.
What is the Percentage of People in the Labor Force in Pickrell?
62.3% of People are in the Labor Force in Pickrell.