Tuttle, ND
Tuttle Map
Tuttle Overview
53
TOTAL POPULATION
35
MALE POPULATION
18
FEMALE POPULATION
194.44
MALES / 100 FEMALES
51.43
FEMALES / 100 MALES
59.8
MEDIAN AGE
1.9
AVG FAMILY SIZE
1.6
AVG HOUSEHOLD SIZE
$42,268
PER CAPITA INCOME
$43,750
AVG FAMILY INCOME
$39,375
AVG HOUSEHOLD INCOME
0.53
INEQUALITY / GINI INDEX
27
LABOR FORCE [ PEOPLE ]
50.9%
PERCENT IN LABOR FORCE
Tuttle Zip Codes
Tuttle Area Codes
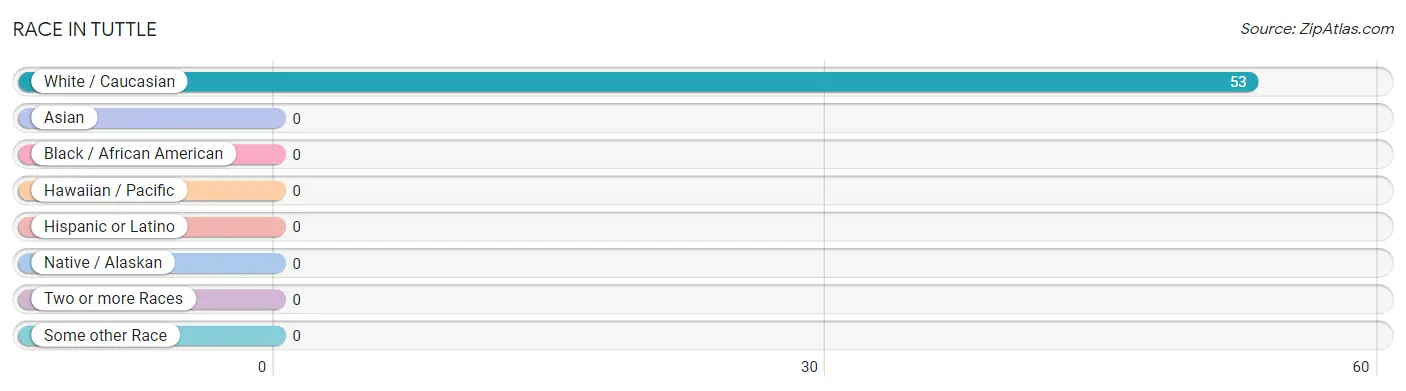
Race in Tuttle
The most populous races in Tuttle are , and White / Caucasian (53 | 100.0%).
| Race | # Population | % Population |
| Asian | 0 | 0.0% |
| Black / African American | 0 | 0.0% |
| Hawaiian / Pacific | 0 | 0.0% |
| Hispanic or Latino | 0 | 0.0% |
| Native / Alaskan | 0 | 0.0% |
| White / Caucasian | 53 | 100.0% |
| Two or more Races | 0 | 0.0% |
| Some other Race | 0 | 0.0% |
| Total | 53 | 100.0% |
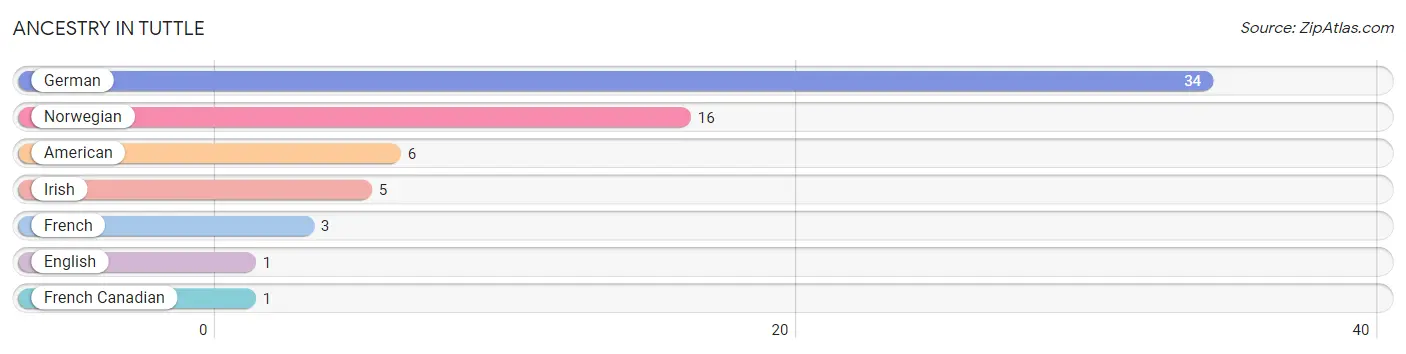
Ancestry in Tuttle
The most populous ancestries reported in Tuttle are German (34 | 64.1%), Norwegian (16 | 30.2%), American (6 | 11.3%), Irish (5 | 9.4%), and French (3 | 5.7%), together accounting for 120.8% of all Tuttle residents.
| Ancestry | # Population | % Population |
| American | 6 | 11.3% |
| English | 1 | 1.9% |
| French | 3 | 5.7% |
| French Canadian | 1 | 1.9% |
| German | 34 | 64.1% |
| Irish | 5 | 9.4% |
| Norwegian | 16 | 30.2% | View All 7 Rows |
Immigrants in Tuttle

| Immigration Origin | # Population | % Population | View All 0 Rows |
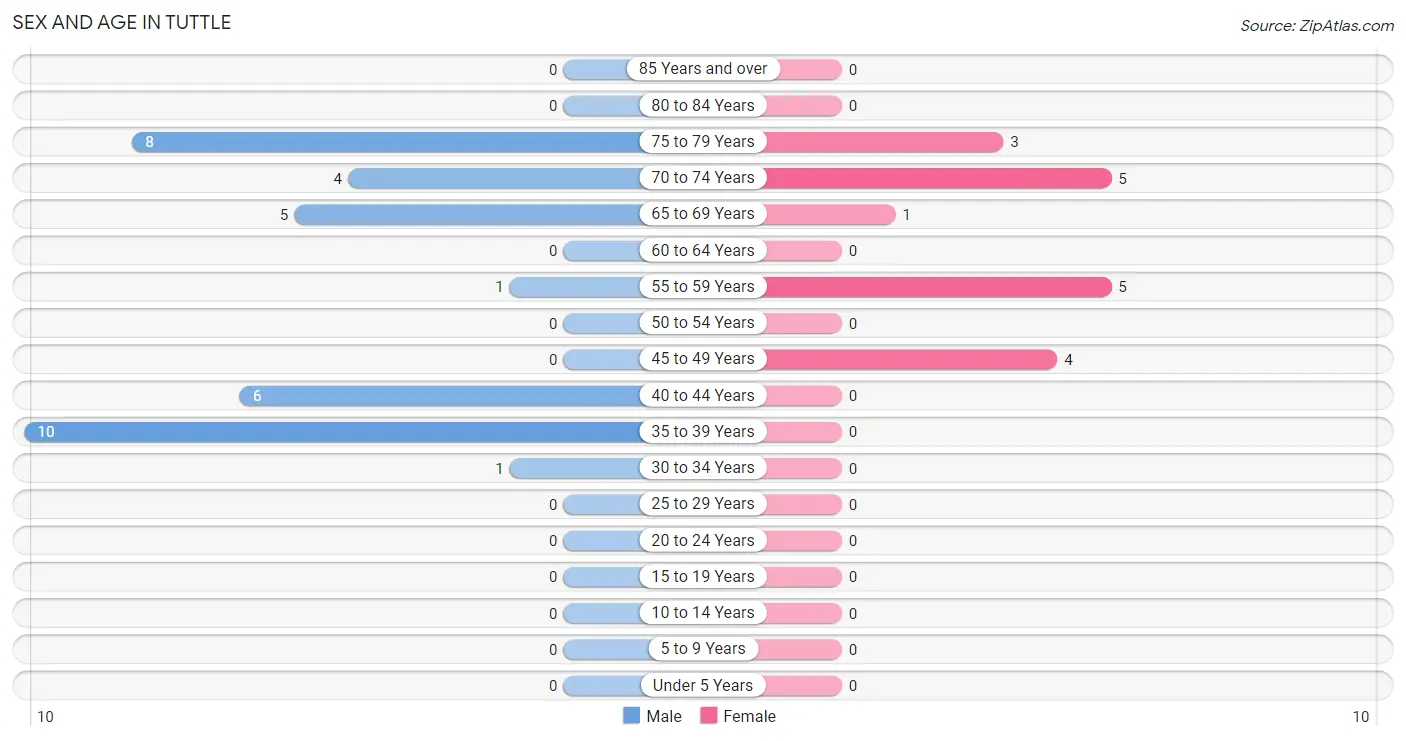
Sex and Age in Tuttle
Sex and Age in Tuttle
The most populous age groups in Tuttle are 35 to 39 Years (10 | 28.6%) for men and 55 to 59 Years (5 | 27.8%) for women.
| Age Bracket | Male | Female |
| Under 5 Years | 0 (0.0%) | 0 (0.0%) |
| 5 to 9 Years | 0 (0.0%) | 0 (0.0%) |
| 10 to 14 Years | 0 (0.0%) | 0 (0.0%) |
| 15 to 19 Years | 0 (0.0%) | 0 (0.0%) |
| 20 to 24 Years | 0 (0.0%) | 0 (0.0%) |
| 25 to 29 Years | 0 (0.0%) | 0 (0.0%) |
| 30 to 34 Years | 1 (2.9%) | 0 (0.0%) |
| 35 to 39 Years | 10 (28.6%) | 0 (0.0%) |
| 40 to 44 Years | 6 (17.1%) | 0 (0.0%) |
| 45 to 49 Years | 0 (0.0%) | 4 (22.2%) |
| 50 to 54 Years | 0 (0.0%) | 0 (0.0%) |
| 55 to 59 Years | 1 (2.9%) | 5 (27.8%) |
| 60 to 64 Years | 0 (0.0%) | 0 (0.0%) |
| 65 to 69 Years | 5 (14.3%) | 1 (5.6%) |
| 70 to 74 Years | 4 (11.4%) | 5 (27.8%) |
| 75 to 79 Years | 8 (22.9%) | 3 (16.7%) |
| 80 to 84 Years | 0 (0.0%) | 0 (0.0%) |
| 85 Years and over | 0 (0.0%) | 0 (0.0%) |
| Total | 35 (100.0%) | 18 (100.0%) |
Families and Households in Tuttle
Median Family Size in Tuttle
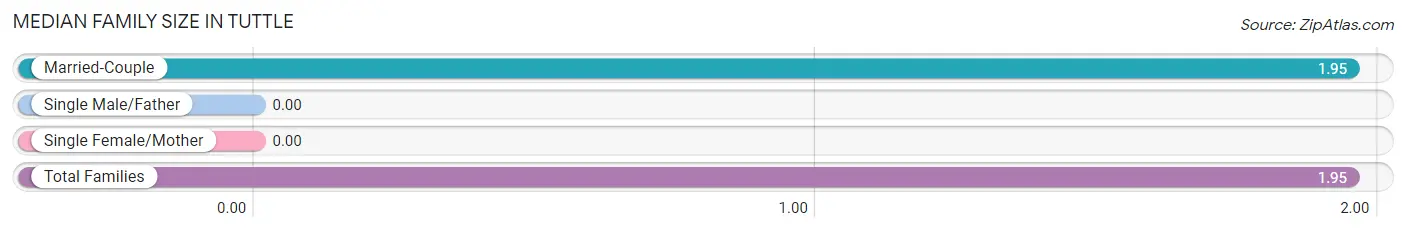
| Family Type | # Families | Family Size |
| Married-Couple | 20 (100.0%) | 1.95 |
| Single Male/Father | 0 (0.0%) | - |
| Single Female/Mother | 0 (0.0%) | - |
| Total Families | 20 (100.0%) | 1.95 |
Median Household Size in Tuttle
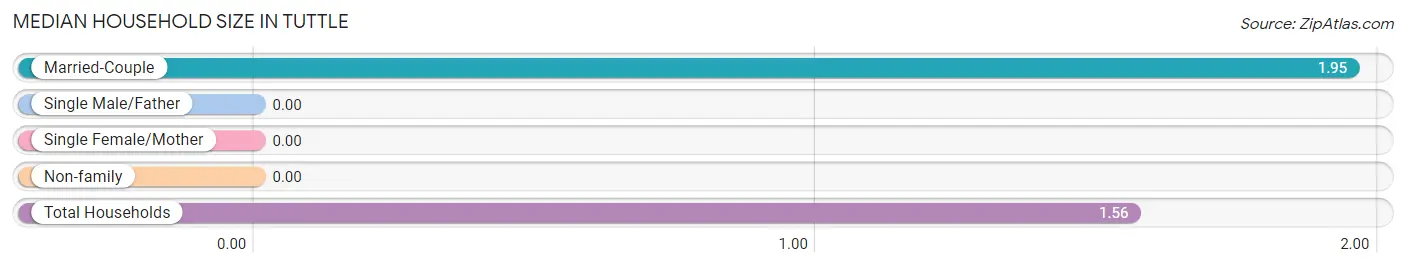
| Household Type | # Households | Household Size |
| Married-Couple | 20 (58.8%) | 1.95 |
| Single Male/Father | 0 (0.0%) | - |
| Single Female/Mother | 0 (0.0%) | - |
| Non-family | 14 (41.2%) | - |
| Total Households | 34 (100.0%) | 1.56 |
Household Size by Marriage Status in Tuttle
Out of a total of 34 households in Tuttle, 20 (58.8%) are family households, while 14 (41.2%) are nonfamily households. The most numerous type of family households are 2-person households, comprising 18, and the most common type of nonfamily households are 1-person households, comprising 14.
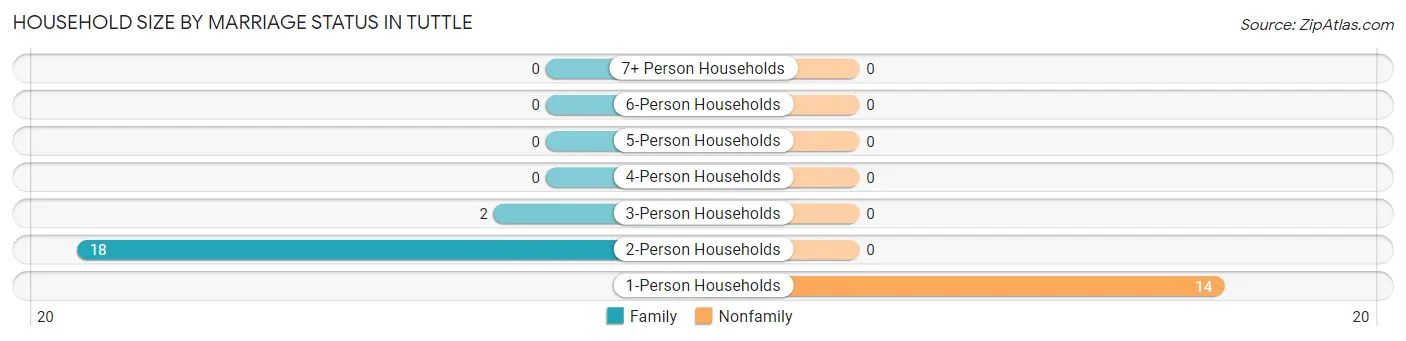
| Household Size | Family Households | Nonfamily Households |
| 1-Person Households | - | 14 (41.2%) |
| 2-Person Households | 18 (52.9%) | 0 (0.0%) |
| 3-Person Households | 2 (5.9%) | 0 (0.0%) |
| 4-Person Households | 0 (0.0%) | 0 (0.0%) |
| 5-Person Households | 0 (0.0%) | 0 (0.0%) |
| 6-Person Households | 0 (0.0%) | 0 (0.0%) |
| 7+ Person Households | 0 (0.0%) | 0 (0.0%) |
| Total | 20 (58.8%) | 14 (41.2%) |
Female Fertility in Tuttle
Fertility by Age in Tuttle
| Age Bracket | Women with Births | Births / 1,000 Women |
| 15 to 19 years | 0 (0.0%) | 0.0 |
| 20 to 34 years | 0 (0.0%) | 0.0 |
| 35 to 50 years | 0 (0.0%) | 0.0 |
| Total | 0 (0.0%) | 0.0 |
Fertility by Age by Marriage Status in Tuttle
| Age Bracket | Married | Unmarried |
| 15 to 19 years | 0 (0.0%) | 0 (0.0%) |
| 20 to 34 years | 0 (0.0%) | 0 (0.0%) |
| 35 to 50 years | 0 (0.0%) | 0 (0.0%) |
| Total | 0 (0.0%) | 0 (0.0%) |
Fertility by Education in Tuttle
| Educational Attainment | Women with Births | Births / 1,000 Women |
| Less than High School | 0 (0.0%) | 0.0 |
| High School Diploma | 0 (0.0%) | 0.0 |
| College or Associate's Degree | 0 (0.0%) | 0.0 |
| Bachelor's Degree | 0 (0.0%) | 0.0 |
| Graduate Degree | 0 (0.0%) | 0.0 |
| Total | 0 (0.0%) | 0.0 |
Fertility by Education by Marriage Status in Tuttle
| Educational Attainment | Married | Unmarried |
| Less than High School | 0 (0.0%) | 0 (0.0%) |
| High School Diploma | 0 (0.0%) | 0 (0.0%) |
| College or Associate's Degree | 0 (0.0%) | 0 (0.0%) |
| Bachelor's Degree | 0 (0.0%) | 0 (0.0%) |
| Graduate Degree | 0 (0.0%) | 0 (0.0%) |
| Total | 0 (0.0%) | 0 (0.0%) |
Income in Tuttle
Income Overview in Tuttle
Per Capita Income in Tuttle is $42,268, while median incomes of families and households are $43,750 and $39,375 respectively.
| Characteristic | Number | Measure |
| Per Capita Income | 53 | $42,268 |
| Median Family Income | 20 | $43,750 |
| Mean Family Income | 20 | $45,195 |
| Median Household Income | 34 | $39,375 |
| Mean Household Income | 34 | $68,962 |
| Income Deficit | 20 | $0 |
| Wage / Income Gap (%) | 53 | 0.00% |
| Wage / Income Gap ($) | 53 | 100.00¢ per $1 |
| Gini / Inequality Index | 53 | 0.53 |
Earnings by Sex in Tuttle
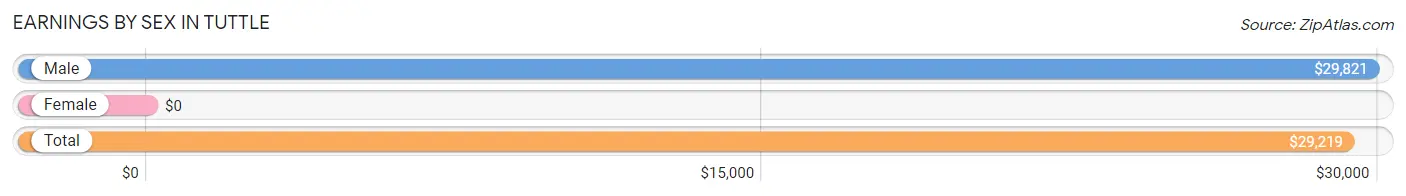
| Sex | Number | Average Earnings |
| Male | 23 (85.2%) | $29,821 |
| Female | 4 (14.8%) | $0 |
| Total | 27 (100.0%) | $29,219 |
Earnings by Sex by Income Bracket in Tuttle
The most common earnings brackets in Tuttle are $25,000 to $29,999 for men (7 | 30.4%) and $12,500 to $14,999 for women (3 | 75.0%).
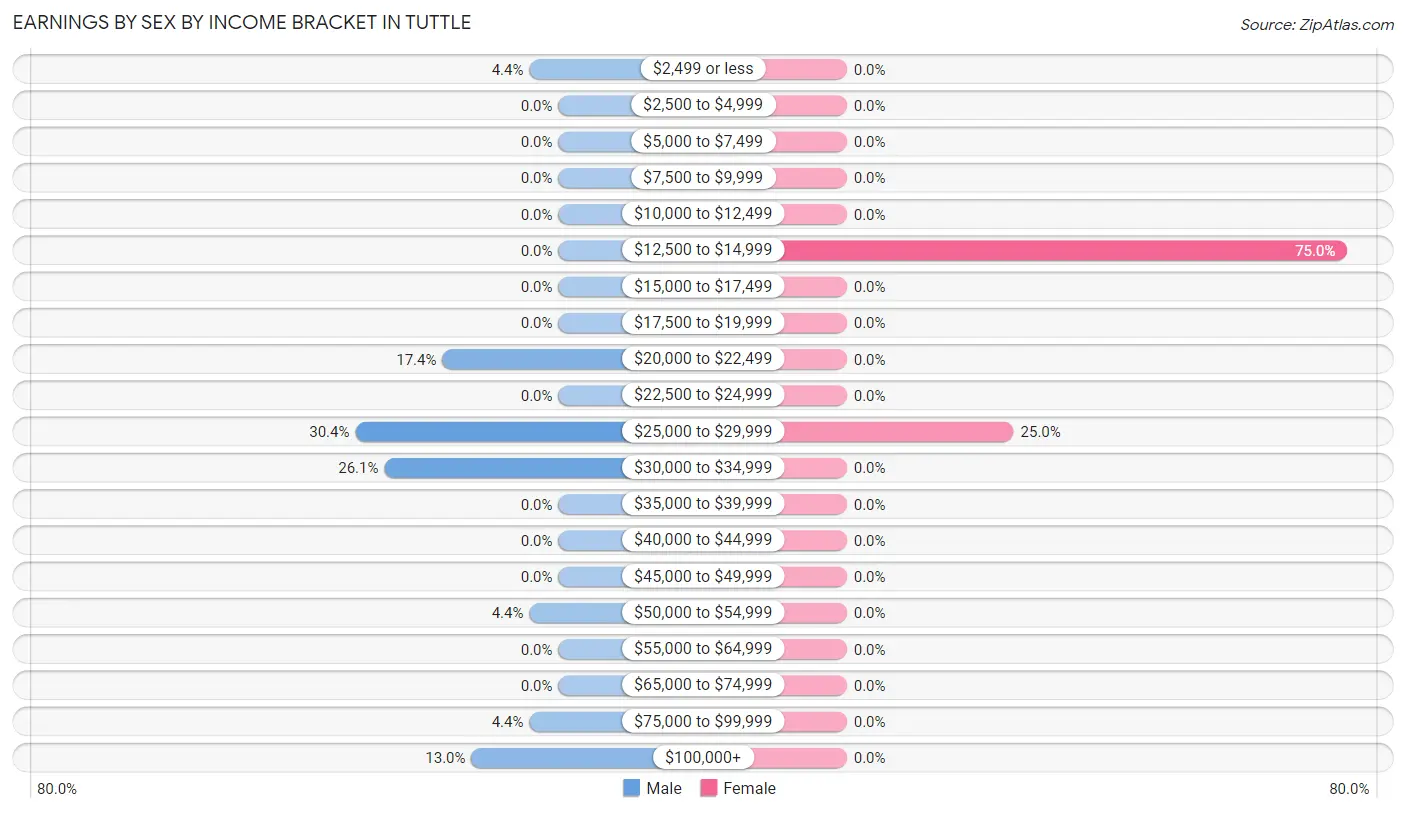
| Income | Male | Female |
| $2,499 or less | 1 (4.3%) | 0 (0.0%) |
| $2,500 to $4,999 | 0 (0.0%) | 0 (0.0%) |
| $5,000 to $7,499 | 0 (0.0%) | 0 (0.0%) |
| $7,500 to $9,999 | 0 (0.0%) | 0 (0.0%) |
| $10,000 to $12,499 | 0 (0.0%) | 0 (0.0%) |
| $12,500 to $14,999 | 0 (0.0%) | 3 (75.0%) |
| $15,000 to $17,499 | 0 (0.0%) | 0 (0.0%) |
| $17,500 to $19,999 | 0 (0.0%) | 0 (0.0%) |
| $20,000 to $22,499 | 4 (17.4%) | 0 (0.0%) |
| $22,500 to $24,999 | 0 (0.0%) | 0 (0.0%) |
| $25,000 to $29,999 | 7 (30.4%) | 1 (25.0%) |
| $30,000 to $34,999 | 6 (26.1%) | 0 (0.0%) |
| $35,000 to $39,999 | 0 (0.0%) | 0 (0.0%) |
| $40,000 to $44,999 | 0 (0.0%) | 0 (0.0%) |
| $45,000 to $49,999 | 0 (0.0%) | 0 (0.0%) |
| $50,000 to $54,999 | 1 (4.3%) | 0 (0.0%) |
| $55,000 to $64,999 | 0 (0.0%) | 0 (0.0%) |
| $65,000 to $74,999 | 0 (0.0%) | 0 (0.0%) |
| $75,000 to $99,999 | 1 (4.3%) | 0 (0.0%) |
| $100,000+ | 3 (13.0%) | 0 (0.0%) |
| Total | 23 (100.0%) | 4 (100.0%) |
Earnings by Sex by Educational Attainment in Tuttle
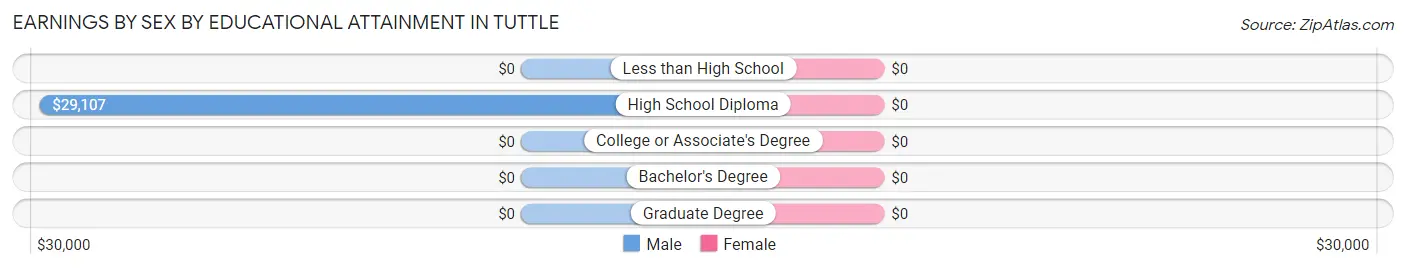
| Educational Attainment | Male Income | Female Income |
| Less than High School | - | - |
| High School Diploma | $29,107 | $0 |
| College or Associate's Degree | - | - |
| Bachelor's Degree | - | - |
| Graduate Degree | - | - |
| Total | $29,821 | $0 |
Family Income in Tuttle
Family Income Brackets in Tuttle
According to the Tuttle family income data, there are 12 families falling into the $35,000 to $49,999 income range, which is the most common income bracket and makes up 60.0% of all families.
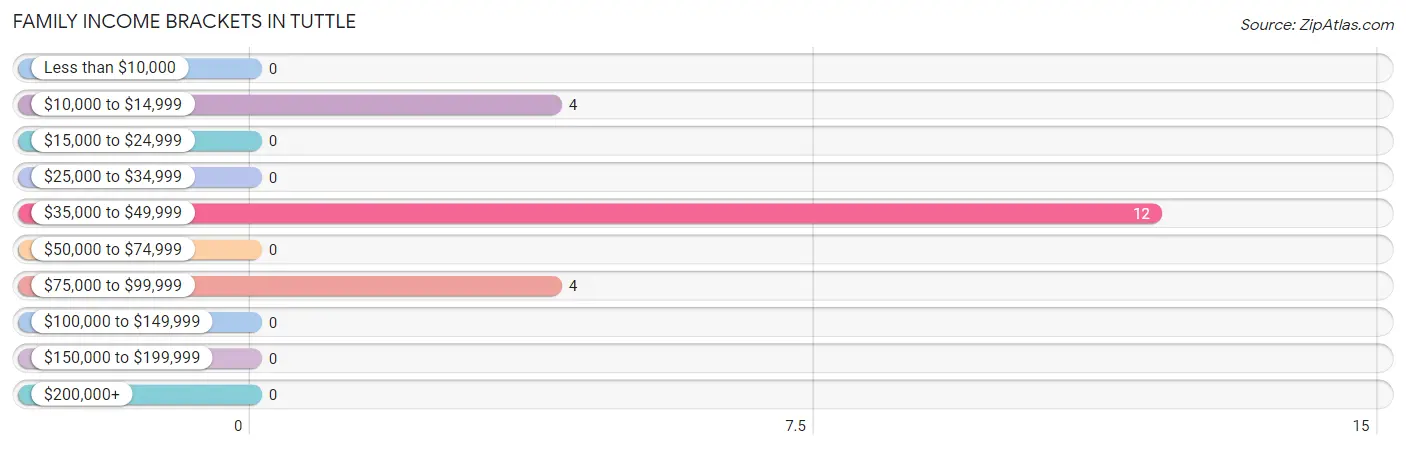
| Income Bracket | # Families | % Families |
| Less than $10,000 | 0 | 0.0% |
| $10,000 to $14,999 | 4 | 20.0% |
| $15,000 to $24,999 | 0 | 0.0% |
| $25,000 to $34,999 | 0 | 0.0% |
| $35,000 to $49,999 | 12 | 60.0% |
| $50,000 to $74,999 | 0 | 0.0% |
| $75,000 to $99,999 | 4 | 20.0% |
| $100,000 to $149,999 | 0 | 0.0% |
| $150,000 to $199,999 | 0 | 0.0% |
| $200,000+ | 0 | 0.0% |
Family Income by Famaliy Size in Tuttle
2-person families (18 | 90.0%) account for the highest median family income in Tuttle with $43,125 per family, while 2-person families (18 | 90.0%) have the highest median income of $21,562 per family member.
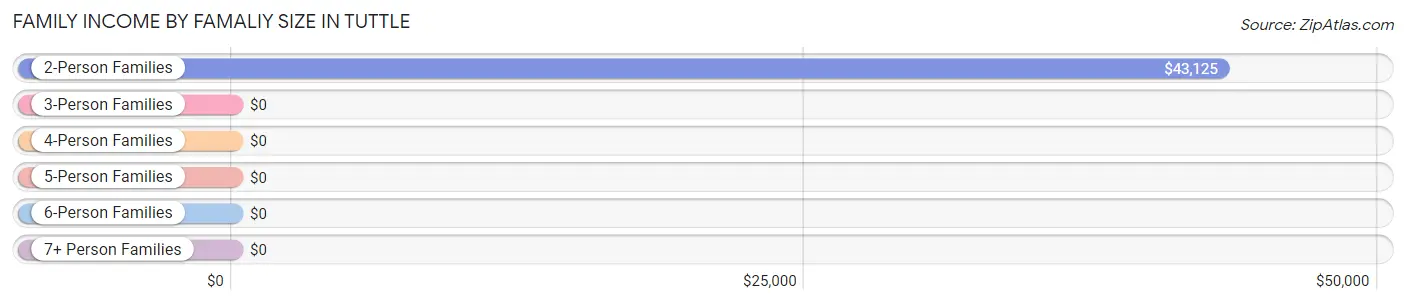
| Income Bracket | # Families | Median Income |
| 2-Person Families | 18 (90.0%) | $43,125 |
| 3-Person Families | 2 (10.0%) | $0 |
| 4-Person Families | 0 (0.0%) | $0 |
| 5-Person Families | 0 (0.0%) | $0 |
| 6-Person Families | 0 (0.0%) | $0 |
| 7+ Person Families | 0 (0.0%) | $0 |
| Total | 20 (100.0%) | $43,750 |
Family Income by Number of Earners in Tuttle
| Number of Earners | # Families | Median Income |
| No Earners | 8 (40.0%) | $0 |
| 1 Earner | 6 (30.0%) | $0 |
| 2 Earners | 6 (30.0%) | $0 |
| 3+ Earners | 0 (0.0%) | $0 |
| Total | 20 (100.0%) | $43,750 |
Household Income in Tuttle
Household Income Brackets in Tuttle
With 12 households falling in the category, the $35,000 to $49,999 income range is the most frequent in Tuttle, accounting for 35.3% of all households.
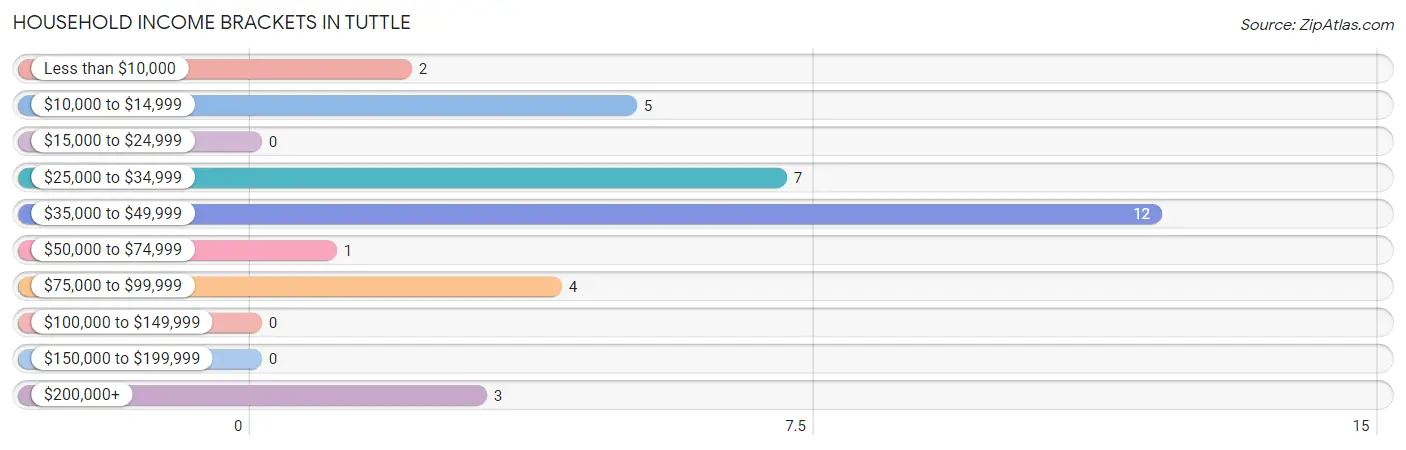
| Income Bracket | # Households | % Households |
| Less than $10,000 | 2 | 5.9% |
| $10,000 to $14,999 | 5 | 14.7% |
| $15,000 to $24,999 | 0 | 0.0% |
| $25,000 to $34,999 | 7 | 20.6% |
| $35,000 to $49,999 | 12 | 35.3% |
| $50,000 to $74,999 | 1 | 2.9% |
| $75,000 to $99,999 | 4 | 11.8% |
| $100,000 to $149,999 | 0 | 0.0% |
| $150,000 to $199,999 | 0 | 0.0% |
| $200,000+ | 3 | 8.8% |
Household Income by Householder Age in Tuttle
The median household income in Tuttle is $39,375, with the highest median household income of $38,750 found in the 65+ years age bracket for the primary householder. A total of 18 households (52.9%) fall into this category.
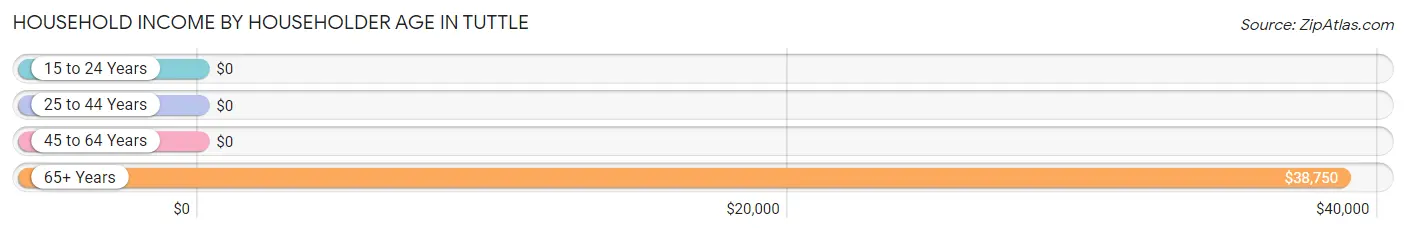
| Income Bracket | # Households | Median Income |
| 15 to 24 Years | 0 (0.0%) | $0 |
| 25 to 44 Years | 10 (29.4%) | $0 |
| 45 to 64 Years | 6 (17.6%) | $0 |
| 65+ Years | 18 (52.9%) | $38,750 |
| Total | 34 (100.0%) | $39,375 |
Poverty in Tuttle
Income Below Poverty by Sex and Age in Tuttle
With 17.1% poverty level for males and 16.7% for females among the residents of Tuttle, 75 year old and over males and 75 year old and over females are the most vulnerable to poverty, with 4 males (50.0%) and 3 females (100.0%) in their respective age groups living below the poverty level.
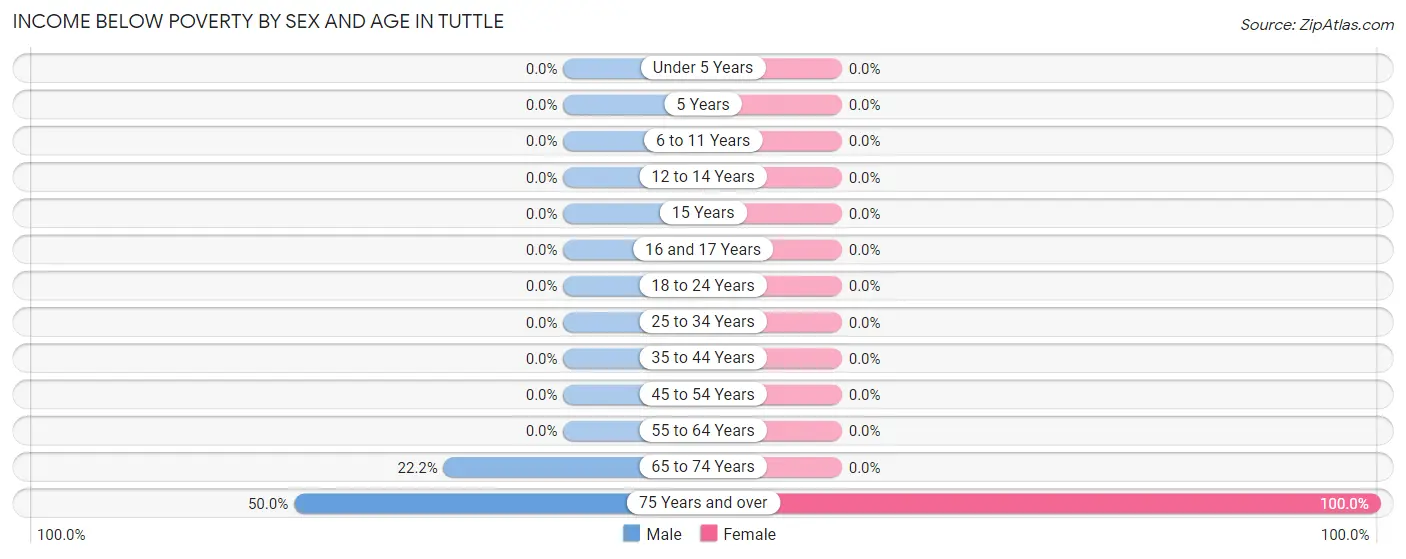
| Age Bracket | Male | Female |
| Under 5 Years | 0 (0.0%) | 0 (0.0%) |
| 5 Years | 0 (0.0%) | 0 (0.0%) |
| 6 to 11 Years | 0 (0.0%) | 0 (0.0%) |
| 12 to 14 Years | 0 (0.0%) | 0 (0.0%) |
| 15 Years | 0 (0.0%) | 0 (0.0%) |
| 16 and 17 Years | 0 (0.0%) | 0 (0.0%) |
| 18 to 24 Years | 0 (0.0%) | 0 (0.0%) |
| 25 to 34 Years | 0 (0.0%) | 0 (0.0%) |
| 35 to 44 Years | 0 (0.0%) | 0 (0.0%) |
| 45 to 54 Years | 0 (0.0%) | 0 (0.0%) |
| 55 to 64 Years | 0 (0.0%) | 0 (0.0%) |
| 65 to 74 Years | 2 (22.2%) | 0 (0.0%) |
| 75 Years and over | 4 (50.0%) | 3 (100.0%) |
| Total | 6 (17.1%) | 3 (16.7%) |
Income Above Poverty by Sex and Age in Tuttle
According to the poverty statistics in Tuttle, males aged 25 to 34 years and females aged 45 to 54 years are the age groups that are most secure financially, with 100.0% of males and 100.0% of females in these age groups living above the poverty line.
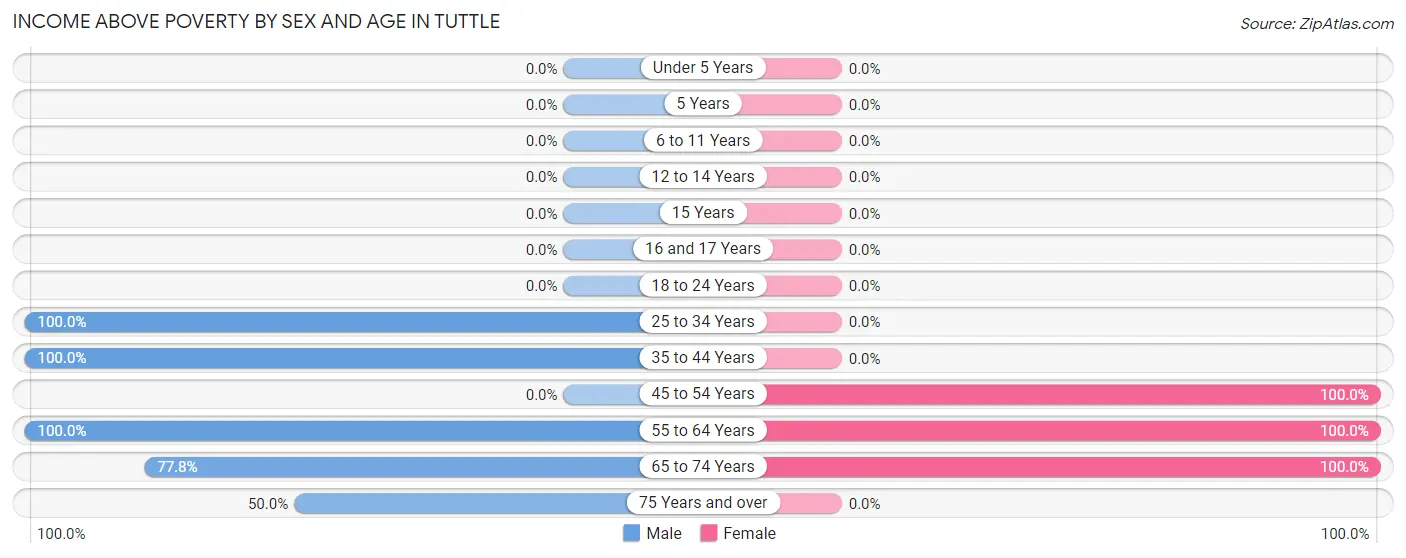
| Age Bracket | Male | Female |
| Under 5 Years | 0 (0.0%) | 0 (0.0%) |
| 5 Years | 0 (0.0%) | 0 (0.0%) |
| 6 to 11 Years | 0 (0.0%) | 0 (0.0%) |
| 12 to 14 Years | 0 (0.0%) | 0 (0.0%) |
| 15 Years | 0 (0.0%) | 0 (0.0%) |
| 16 and 17 Years | 0 (0.0%) | 0 (0.0%) |
| 18 to 24 Years | 0 (0.0%) | 0 (0.0%) |
| 25 to 34 Years | 1 (100.0%) | 0 (0.0%) |
| 35 to 44 Years | 16 (100.0%) | 0 (0.0%) |
| 45 to 54 Years | 0 (0.0%) | 4 (100.0%) |
| 55 to 64 Years | 1 (100.0%) | 5 (100.0%) |
| 65 to 74 Years | 7 (77.8%) | 6 (100.0%) |
| 75 Years and over | 4 (50.0%) | 0 (0.0%) |
| Total | 29 (82.9%) | 15 (83.3%) |
Income Below Poverty Among Married-Couple Families in Tuttle
The poverty statistics for married-couple families in Tuttle show that 20.0% or 4 of the total 20 families live below the poverty line. Families with no children have the highest poverty rate of 20.0%, comprising of 4 families. On the other hand, families with no children have the lowest poverty rate of 20.0%, which includes 4 families.
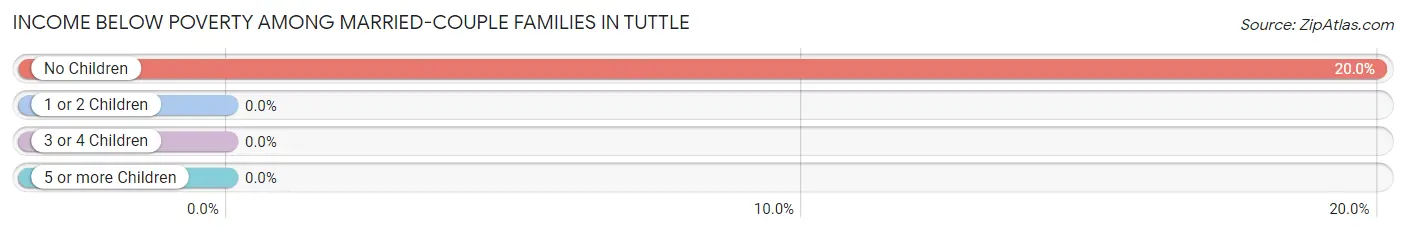
| Children | Above Poverty | Below Poverty |
| No Children | 16 (80.0%) | 4 (20.0%) |
| 1 or 2 Children | 0 (0.0%) | 0 (0.0%) |
| 3 or 4 Children | 0 (0.0%) | 0 (0.0%) |
| 5 or more Children | 0 (0.0%) | 0 (0.0%) |
| Total | 16 (80.0%) | 4 (20.0%) |
Income Below Poverty Among Single-Parent Households in Tuttle
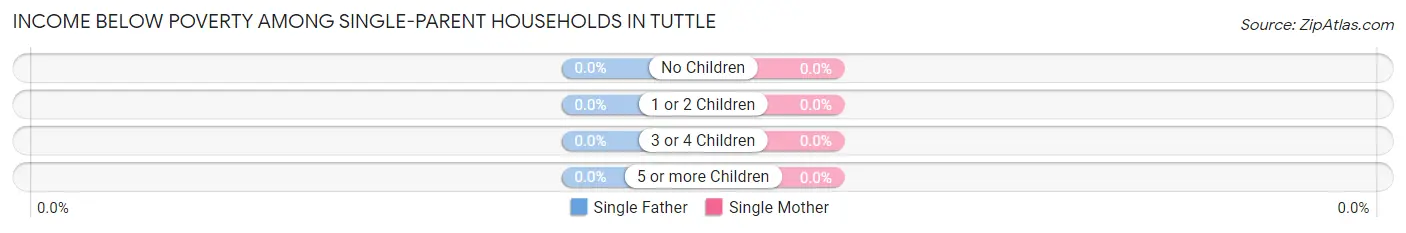
| Children | Single Father | Single Mother |
| No Children | 0 (0.0%) | 0 (0.0%) |
| 1 or 2 Children | 0 (0.0%) | 0 (0.0%) |
| 3 or 4 Children | 0 (0.0%) | 0 (0.0%) |
| 5 or more Children | 0 (0.0%) | 0 (0.0%) |
| Total | 0 (0.0%) | 0 (0.0%) |
Income Below Poverty Among Married-Couple vs Single-Parent Households in Tuttle
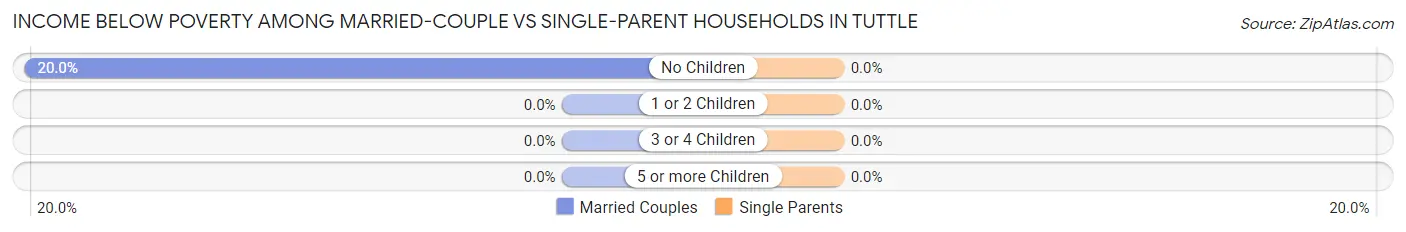
| Children | Married-Couple Families | Single-Parent Households |
| No Children | 4 (20.0%) | 0 (0.0%) |
| 1 or 2 Children | 0 (0.0%) | 0 (0.0%) |
| 3 or 4 Children | 0 (0.0%) | 0 (0.0%) |
| 5 or more Children | 0 (0.0%) | 0 (0.0%) |
| Total | 4 (20.0%) | 0 (0.0%) |
Employment Characteristics in Tuttle
Employment by Class of Employer in Tuttle
Among the 27 employed individuals in Tuttle, self-employed (not incorporated) (15 | 55.6%), private company employees (9 | 33.3%), and not-for-profit organizations (3 | 11.1%) make up the most common classes of employment.
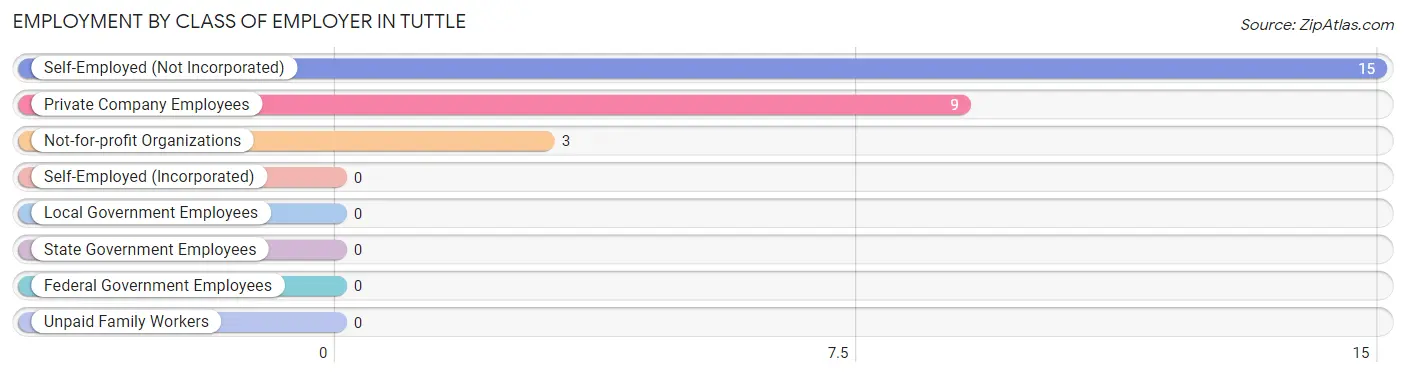
| Employer Class | # Employees | % Employees |
| Private Company Employees | 9 | 33.3% |
| Self-Employed (Incorporated) | 0 | 0.0% |
| Self-Employed (Not Incorporated) | 15 | 55.6% |
| Not-for-profit Organizations | 3 | 11.1% |
| Local Government Employees | 0 | 0.0% |
| State Government Employees | 0 | 0.0% |
| Federal Government Employees | 0 | 0.0% |
| Unpaid Family Workers | 0 | 0.0% |
| Total | 27 | 100.0% |
Employment Status by Age in Tuttle
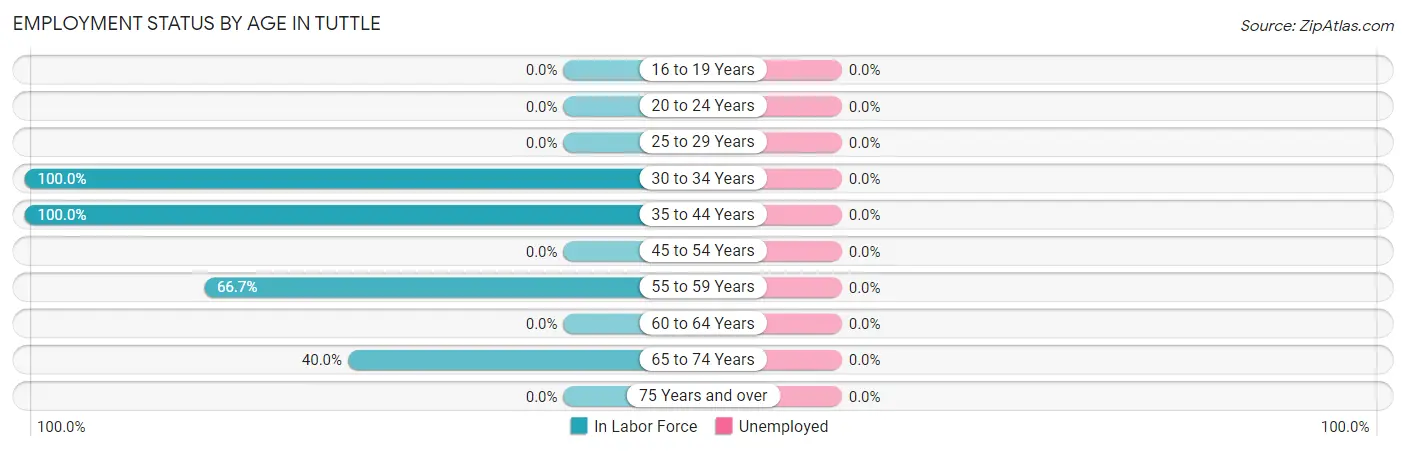
| Age Bracket | In Labor Force | Unemployed |
| 16 to 19 Years | 0 (0.0%) | 0 (0.0%) |
| 20 to 24 Years | 0 (0.0%) | 0 (0.0%) |
| 25 to 29 Years | 0 (0.0%) | 0 (0.0%) |
| 30 to 34 Years | 1 (100.0%) | 0 (0.0%) |
| 35 to 44 Years | 16 (100.0%) | 0 (0.0%) |
| 45 to 54 Years | 0 (0.0%) | 0 (0.0%) |
| 55 to 59 Years | 4 (66.7%) | 0 (0.0%) |
| 60 to 64 Years | 0 (0.0%) | 0 (0.0%) |
| 65 to 74 Years | 6 (40.0%) | 0 (0.0%) |
| 75 Years and over | 0 (0.0%) | 0 (0.0%) |
| Total | 27 (50.9%) | 0 (0.0%) |
Employment Status by Educational Attainment in Tuttle
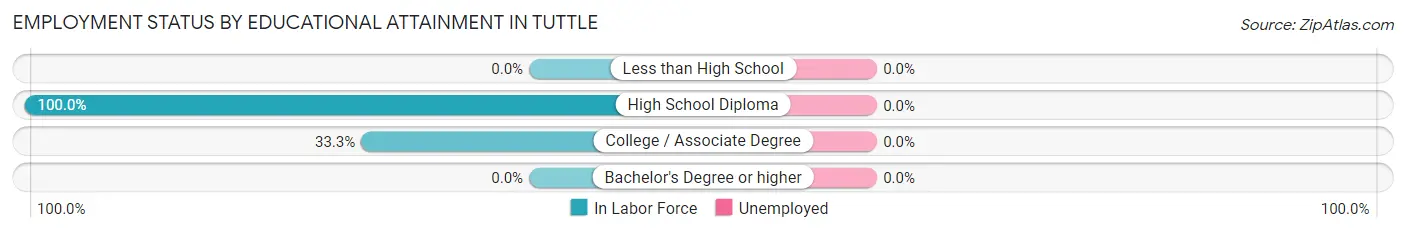
| Educational Attainment | In Labor Force | Unemployed |
| Less than High School | 0 (0.0%) | 0 (0.0%) |
| High School Diploma | 18 (100.0%) | 0 (0.0%) |
| College / Associate Degree | 3 (33.3%) | 0 (0.0%) |
| Bachelor's Degree or higher | 0 (0.0%) | 0 (0.0%) |
| Total | 21 (77.8%) | 0 (0.0%) |
Employment Occupations by Sex in Tuttle
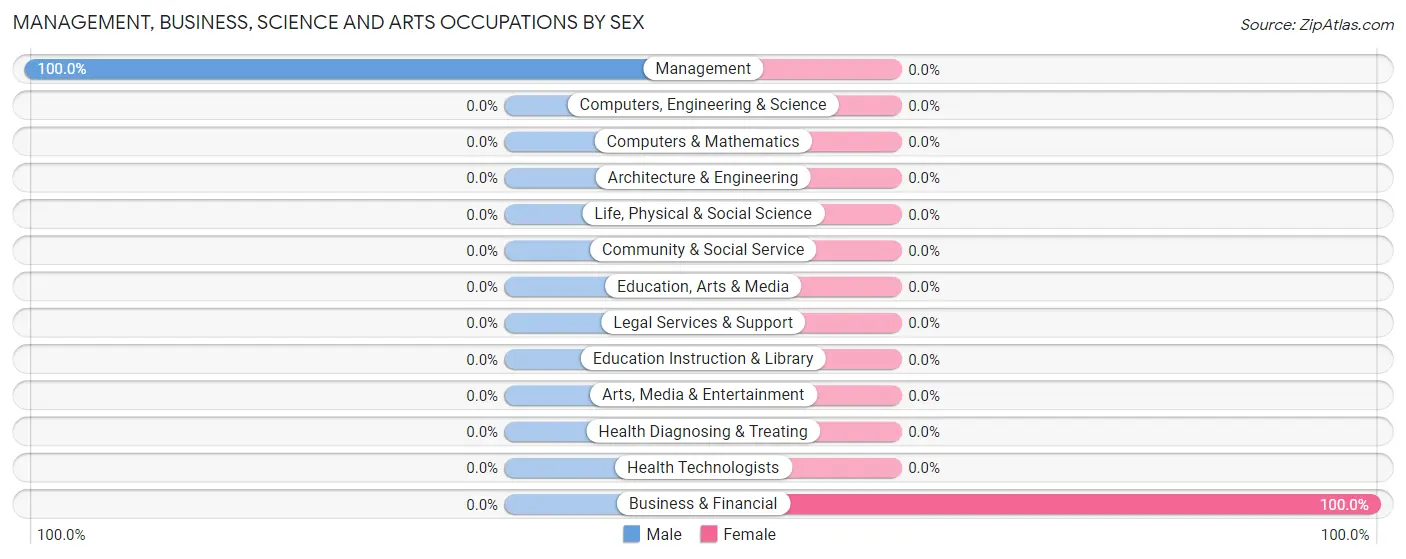
Management, Business, Science and Arts Occupations
The most common Management, Business, Science and Arts occupations in Tuttle are Management (10 | 37.0%), and Business & Financial (1 | 3.7%).
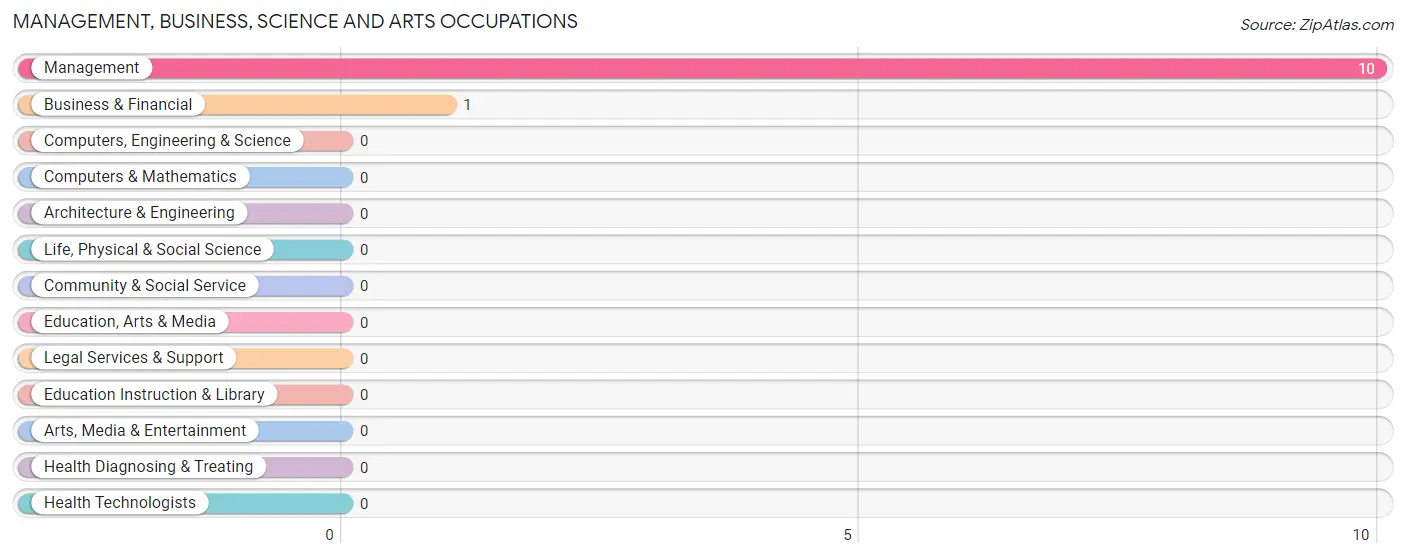
Management, Business, Science and Arts Occupations by Sex
| Occupation | Male | Female |
| Management | 10 (100.0%) | 0 (0.0%) |
| Business & Financial | 0 (0.0%) | 1 (100.0%) |
| Computers, Engineering & Science | 0 (0.0%) | 0 (0.0%) |
| Computers & Mathematics | 0 (0.0%) | 0 (0.0%) |
| Architecture & Engineering | 0 (0.0%) | 0 (0.0%) |
| Life, Physical & Social Science | 0 (0.0%) | 0 (0.0%) |
| Community & Social Service | 0 (0.0%) | 0 (0.0%) |
| Education, Arts & Media | 0 (0.0%) | 0 (0.0%) |
| Legal Services & Support | 0 (0.0%) | 0 (0.0%) |
| Education Instruction & Library | 0 (0.0%) | 0 (0.0%) |
| Arts, Media & Entertainment | 0 (0.0%) | 0 (0.0%) |
| Health Diagnosing & Treating | 0 (0.0%) | 0 (0.0%) |
| Health Technologists | 0 (0.0%) | 0 (0.0%) |
| Total (Category) | 10 (90.9%) | 1 (9.1%) |
| Total (Overall) | 23 (85.2%) | 4 (14.8%) |
Services Occupations
The most common Services occupations in Tuttle are , and Cleaning & Maintenance (3 | 11.1%).
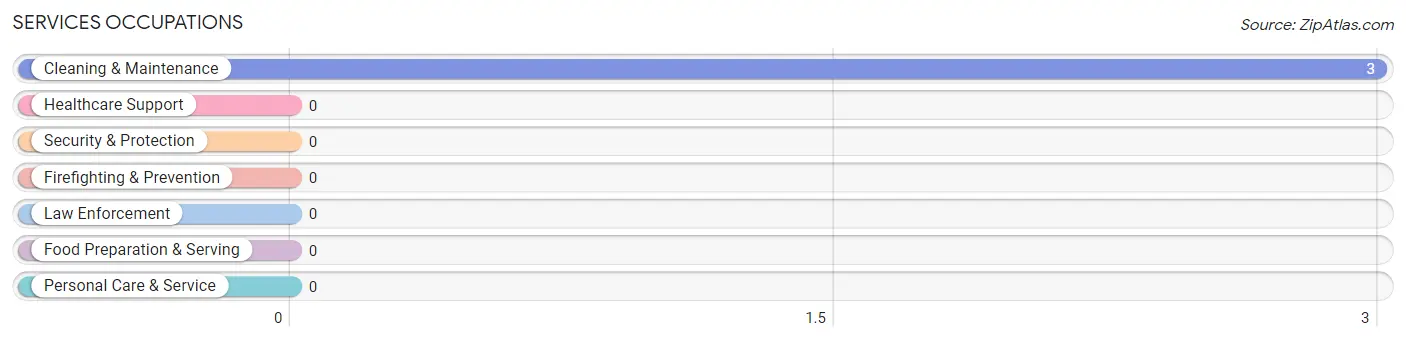
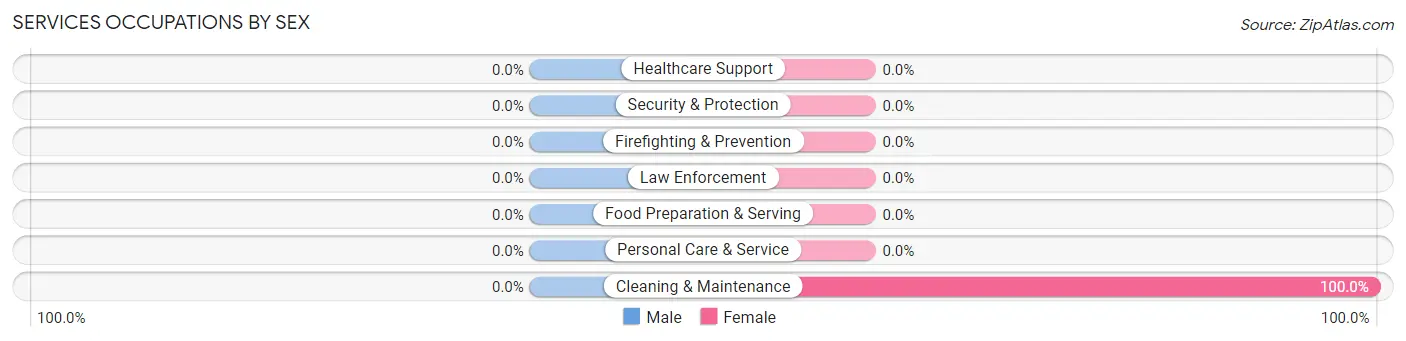
Services Occupations by Sex
| Occupation | Male | Female |
| Healthcare Support | 0 (0.0%) | 0 (0.0%) |
| Security & Protection | 0 (0.0%) | 0 (0.0%) |
| Firefighting & Prevention | 0 (0.0%) | 0 (0.0%) |
| Law Enforcement | 0 (0.0%) | 0 (0.0%) |
| Food Preparation & Serving | 0 (0.0%) | 0 (0.0%) |
| Cleaning & Maintenance | 0 (0.0%) | 3 (100.0%) |
| Personal Care & Service | 0 (0.0%) | 0 (0.0%) |
| Total (Category) | 0 (0.0%) | 3 (100.0%) |
| Total (Overall) | 23 (85.2%) | 4 (14.8%) |
Sales and Office Occupations
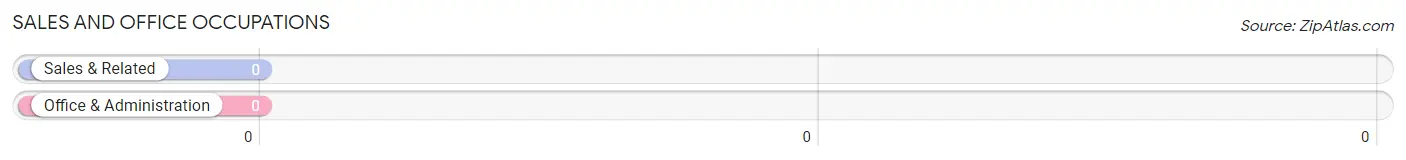
Sales and Office Occupations by Sex
| Occupation | Male | Female |
| Sales & Related | 0 (0.0%) | 0 (0.0%) |
| Office & Administration | 0 (0.0%) | 0 (0.0%) |
| Total (Category) | 0 (0.0%) | 0 (0.0%) |
| Total (Overall) | 23 (85.2%) | 4 (14.8%) |
Natural Resources, Construction and Maintenance Occupations
The most common Natural Resources, Construction and Maintenance occupations in Tuttle are Farming, Fishing & Forestry (6 | 22.2%), and Construction & Extraction (6 | 22.2%).
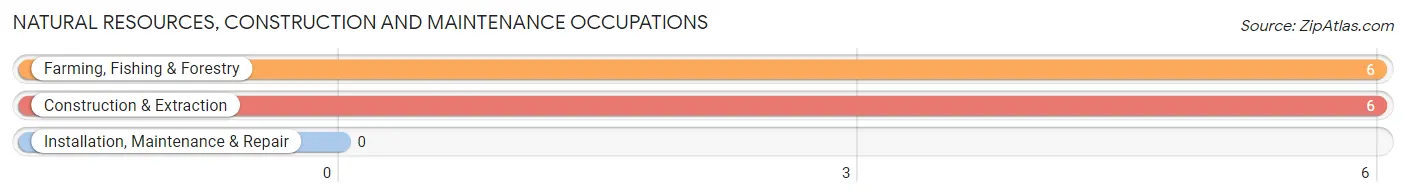
Natural Resources, Construction and Maintenance Occupations by Sex
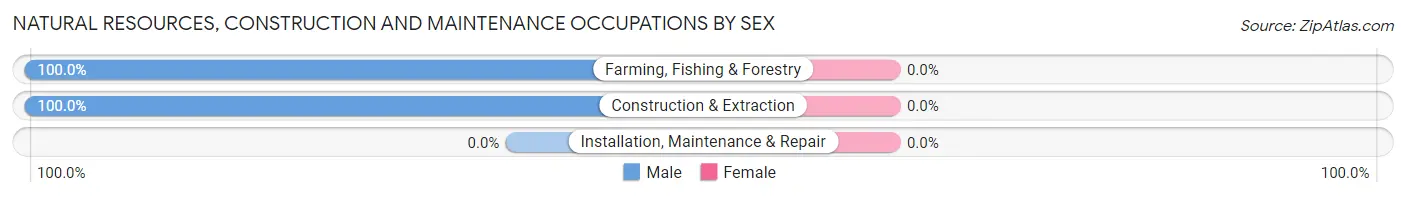
| Occupation | Male | Female |
| Farming, Fishing & Forestry | 6 (100.0%) | 0 (0.0%) |
| Construction & Extraction | 6 (100.0%) | 0 (0.0%) |
| Installation, Maintenance & Repair | 0 (0.0%) | 0 (0.0%) |
| Total (Category) | 12 (100.0%) | 0 (0.0%) |
| Total (Overall) | 23 (85.2%) | 4 (14.8%) |
Production, Transportation and Moving Occupations
The most common Production, Transportation and Moving occupations in Tuttle are , and Transportation (1 | 3.7%).
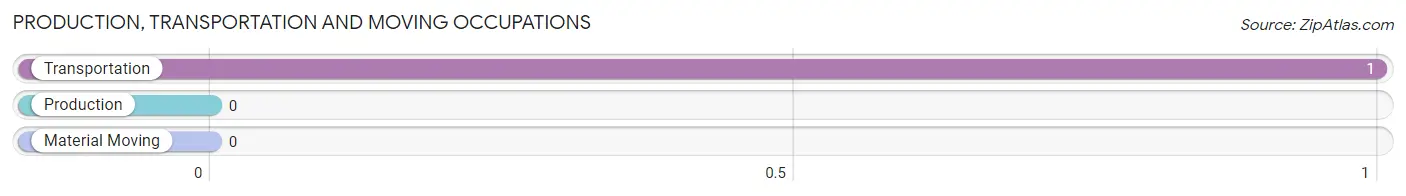
Production, Transportation and Moving Occupations by Sex
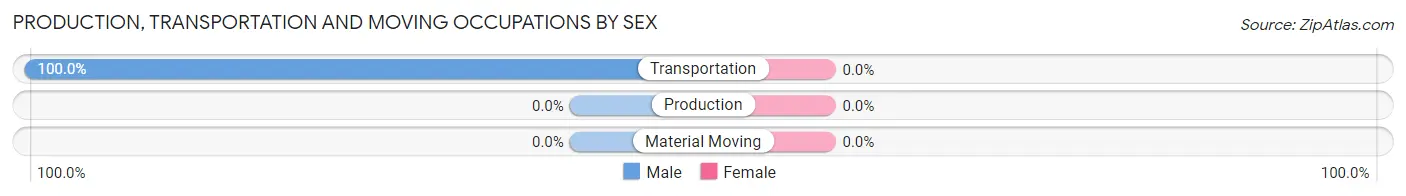
| Occupation | Male | Female |
| Production | 0 (0.0%) | 0 (0.0%) |
| Transportation | 1 (100.0%) | 0 (0.0%) |
| Material Moving | 0 (0.0%) | 0 (0.0%) |
| Total (Category) | 1 (100.0%) | 0 (0.0%) |
| Total (Overall) | 23 (85.2%) | 4 (14.8%) |
Employment Industries by Sex in Tuttle
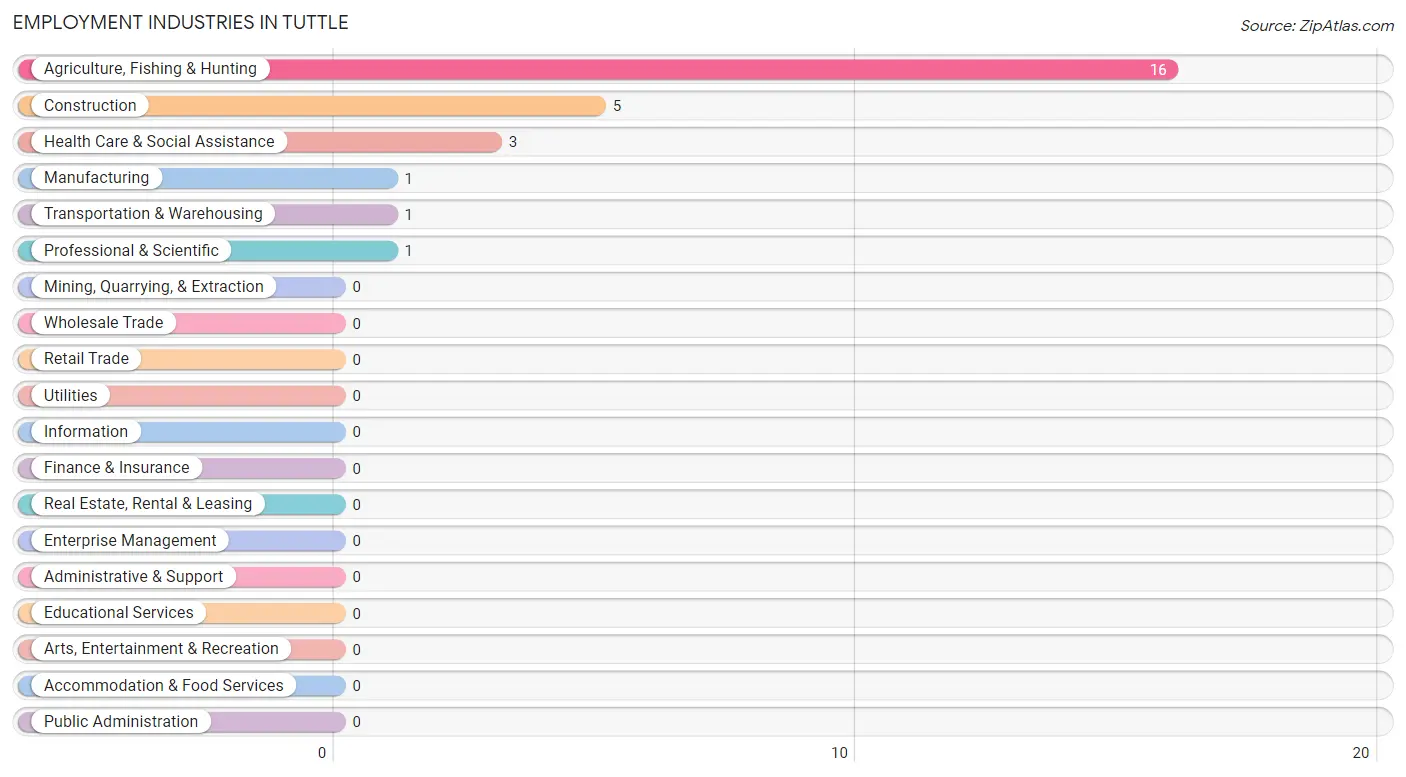
Employment Industries in Tuttle
The major employment industries in Tuttle include Agriculture, Fishing & Hunting (16 | 59.3%), Construction (5 | 18.5%), Health Care & Social Assistance (3 | 11.1%), Manufacturing (1 | 3.7%), and Transportation & Warehousing (1 | 3.7%).
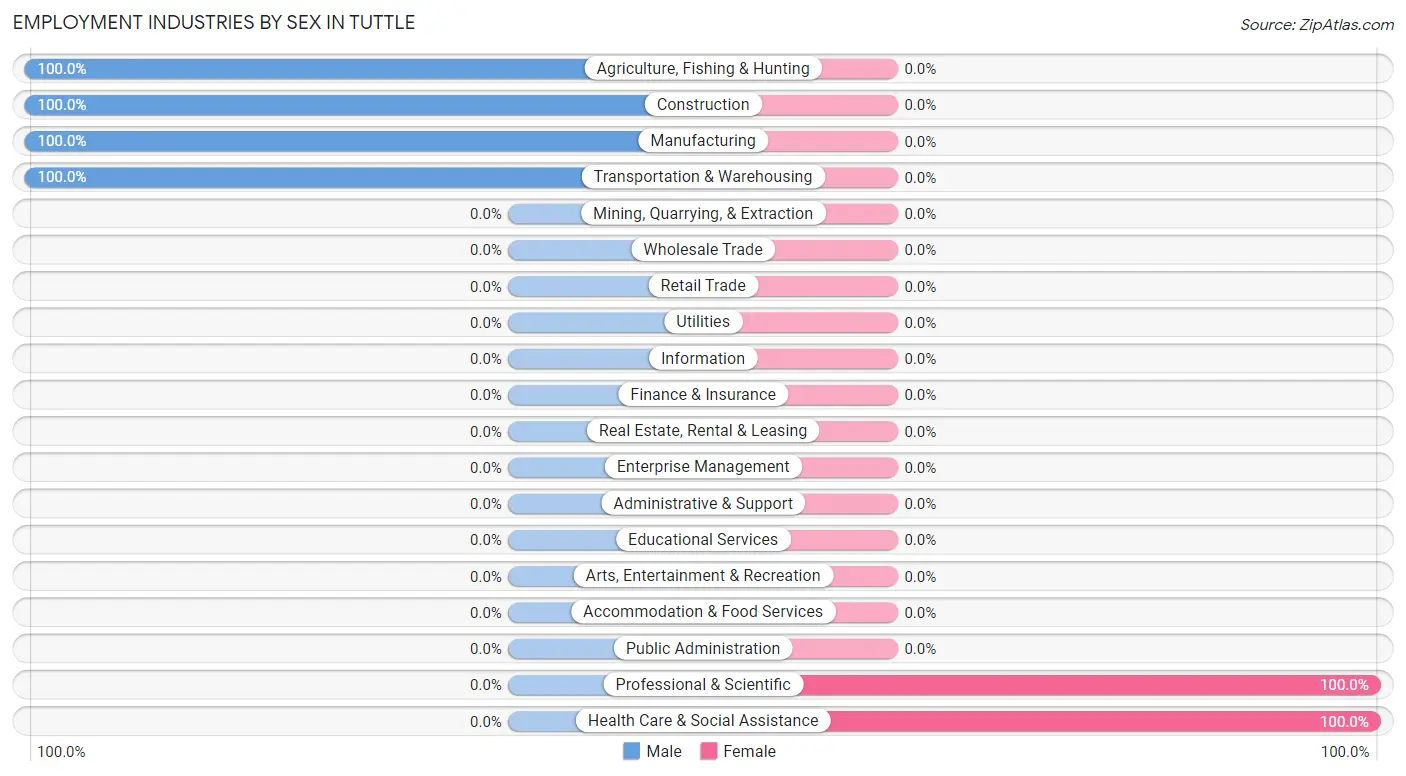
Employment Industries by Sex in Tuttle
The Tuttle industries that see more men than women are Agriculture, Fishing & Hunting (100.0%), Construction (100.0%), and Manufacturing (100.0%), whereas the industries that tend to have a higher number of women are Professional & Scientific (100.0%), and Health Care & Social Assistance (100.0%).
| Industry | Male | Female |
| Agriculture, Fishing & Hunting | 16 (100.0%) | 0 (0.0%) |
| Mining, Quarrying, & Extraction | 0 (0.0%) | 0 (0.0%) |
| Construction | 5 (100.0%) | 0 (0.0%) |
| Manufacturing | 1 (100.0%) | 0 (0.0%) |
| Wholesale Trade | 0 (0.0%) | 0 (0.0%) |
| Retail Trade | 0 (0.0%) | 0 (0.0%) |
| Transportation & Warehousing | 1 (100.0%) | 0 (0.0%) |
| Utilities | 0 (0.0%) | 0 (0.0%) |
| Information | 0 (0.0%) | 0 (0.0%) |
| Finance & Insurance | 0 (0.0%) | 0 (0.0%) |
| Real Estate, Rental & Leasing | 0 (0.0%) | 0 (0.0%) |
| Professional & Scientific | 0 (0.0%) | 1 (100.0%) |
| Enterprise Management | 0 (0.0%) | 0 (0.0%) |
| Administrative & Support | 0 (0.0%) | 0 (0.0%) |
| Educational Services | 0 (0.0%) | 0 (0.0%) |
| Health Care & Social Assistance | 0 (0.0%) | 3 (100.0%) |
| Arts, Entertainment & Recreation | 0 (0.0%) | 0 (0.0%) |
| Accommodation & Food Services | 0 (0.0%) | 0 (0.0%) |
| Public Administration | 0 (0.0%) | 0 (0.0%) |
| Total | 23 (85.2%) | 4 (14.8%) |
Education in Tuttle
School Enrollment in Tuttle
| School Level | # Students | % Students |
| Nursery / Preschool | 0 | 0.0% |
| Kindergarten | 0 | 0.0% |
| Elementary School | 0 | 0.0% |
| Middle School | 0 | 0.0% |
| High School | 0 | 0.0% |
| College / Undergraduate | 0 | 0.0% |
| Graduate / Professional | 0 | 0.0% |
| Total | 0 | 0.0% |
School Enrollment by Age by Funding Source in Tuttle
| Age Bracket | Public School | Private School |
| 3 to 4 Year Olds | 0 (0.0%) | 0 (0.0%) |
| 5 to 9 Year Old | 0 (0.0%) | 0 (0.0%) |
| 10 to 14 Year Olds | 0 (0.0%) | 0 (0.0%) |
| 15 to 17 Year Olds | 0 (0.0%) | 0 (0.0%) |
| 18 to 19 Year Olds | 0 (0.0%) | 0 (0.0%) |
| 20 to 24 Year Olds | 0 (0.0%) | 0 (0.0%) |
| 25 to 34 Year Olds | 0 (0.0%) | 0 (0.0%) |
| 35 Years and over | 0 (0.0%) | 0 (0.0%) |
| Total | 0 (0.0%) | 0 (0.0%) |
Educational Attainment by Field of Study in Tuttle
| Field of Study | # Graduates | % Graduates |
| Computers & Mathematics | 0 | 0.0% |
| Bio, Nature & Agricultural | 0 | 0.0% |
| Physical & Health Sciences | 0 | 0.0% |
| Psychology | 0 | 0.0% |
| Social Sciences | 0 | 0.0% |
| Engineering | 0 | 0.0% |
| Multidisciplinary Studies | 0 | 0.0% |
| Science & Technology | 0 | 0.0% |
| Business | 0 | 0.0% |
| Education | 0 | 0.0% |
| Literature & Languages | 0 | 0.0% |
| Liberal Arts & History | 0 | 0.0% |
| Visual & Performing Arts | 0 | 0.0% |
| Communications | 0 | 0.0% |
| Arts & Humanities | 0 | 0.0% |
| Total | 0 | 0.0% |
Transportation & Commute in Tuttle
Vehicle Availability by Sex in Tuttle
The most prevalent vehicle ownership categories in Tuttle are males with 1 vehicle (10, accounting for 43.5%) and females with 1 vehicle (0, making up 250.0%).
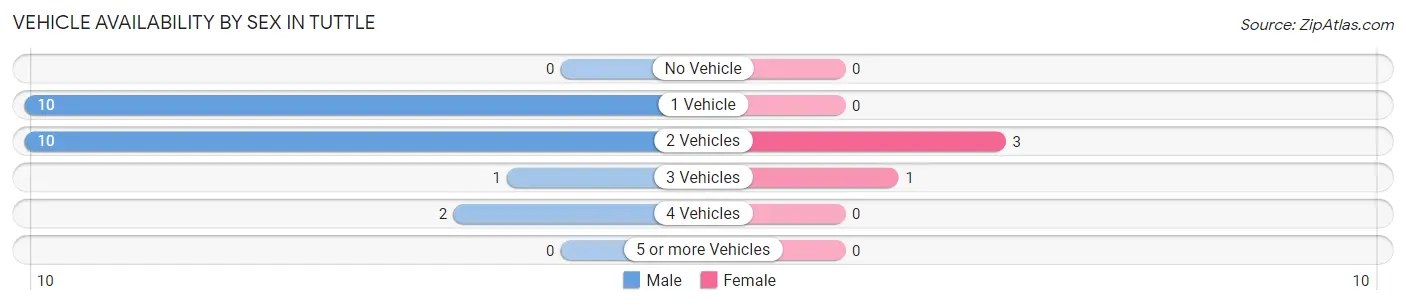
| Vehicles Available | Male | Female |
| No Vehicle | 0 (0.0%) | 0 (0.0%) |
| 1 Vehicle | 10 (43.5%) | 0 (0.0%) |
| 2 Vehicles | 10 (43.5%) | 3 (75.0%) |
| 3 Vehicles | 1 (4.3%) | 1 (25.0%) |
| 4 Vehicles | 2 (8.7%) | 0 (0.0%) |
| 5 or more Vehicles | 0 (0.0%) | 0 (0.0%) |
| Total | 23 (100.0%) | 4 (100.0%) |
Commute Time in Tuttle
The most frequently occuring commute durations in Tuttle are 30 to 34 minutes (13 commuters, 48.1%), 15 to 19 minutes (7 commuters, 25.9%), and 45 to 59 minutes (4 commuters, 14.8%).
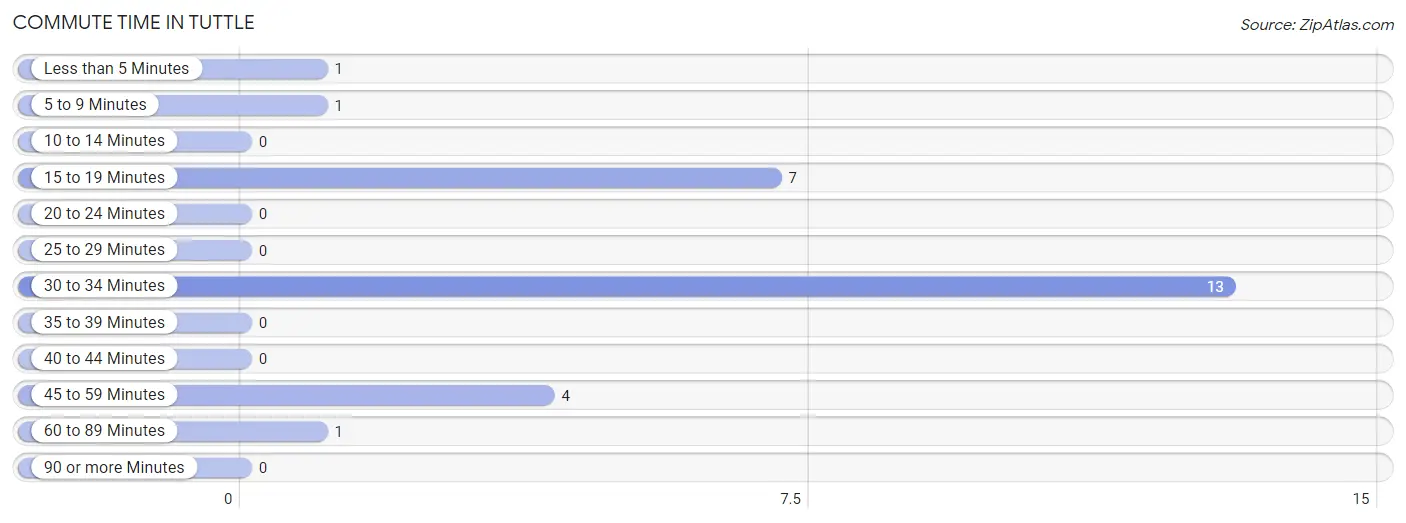
| Commute Time | # Commuters | % Commuters |
| Less than 5 Minutes | 1 | 3.7% |
| 5 to 9 Minutes | 1 | 3.7% |
| 10 to 14 Minutes | 0 | 0.0% |
| 15 to 19 Minutes | 7 | 25.9% |
| 20 to 24 Minutes | 0 | 0.0% |
| 25 to 29 Minutes | 0 | 0.0% |
| 30 to 34 Minutes | 13 | 48.1% |
| 35 to 39 Minutes | 0 | 0.0% |
| 40 to 44 Minutes | 0 | 0.0% |
| 45 to 59 Minutes | 4 | 14.8% |
| 60 to 89 Minutes | 1 | 3.7% |
| 90 or more Minutes | 0 | 0.0% |
Commute Time by Sex in Tuttle
The most common commute times in Tuttle are 30 to 34 minutes (10 commuters, 43.5%) for males and 30 to 34 minutes (3 commuters, 75.0%) for females.
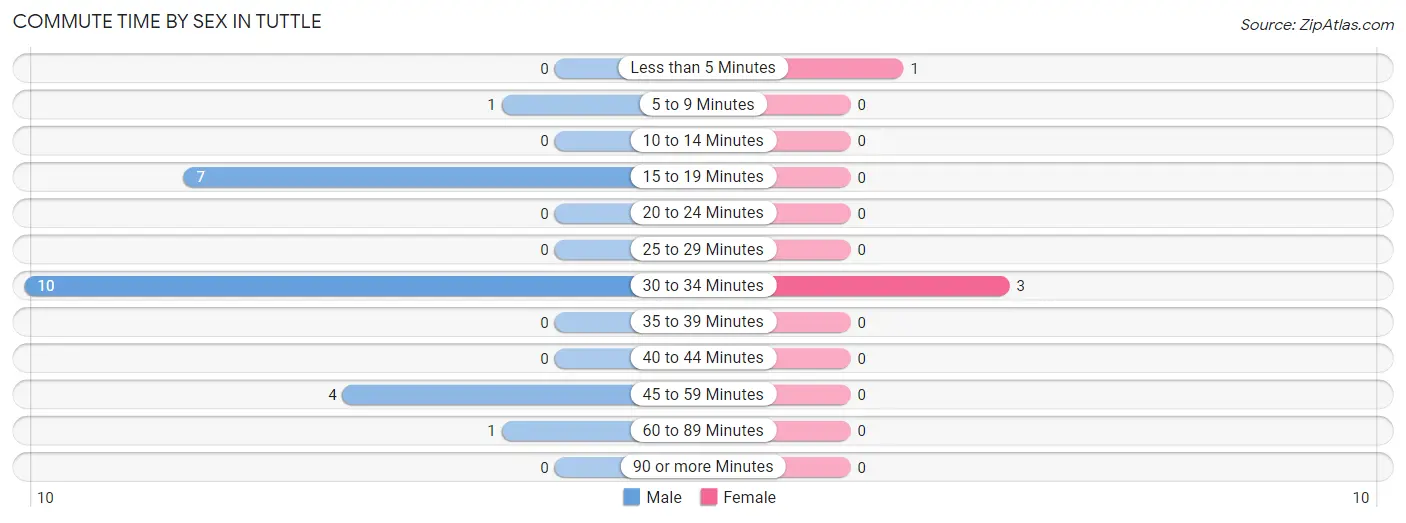
| Commute Time | Male | Female |
| Less than 5 Minutes | 0 (0.0%) | 1 (25.0%) |
| 5 to 9 Minutes | 1 (4.3%) | 0 (0.0%) |
| 10 to 14 Minutes | 0 (0.0%) | 0 (0.0%) |
| 15 to 19 Minutes | 7 (30.4%) | 0 (0.0%) |
| 20 to 24 Minutes | 0 (0.0%) | 0 (0.0%) |
| 25 to 29 Minutes | 0 (0.0%) | 0 (0.0%) |
| 30 to 34 Minutes | 10 (43.5%) | 3 (75.0%) |
| 35 to 39 Minutes | 0 (0.0%) | 0 (0.0%) |
| 40 to 44 Minutes | 0 (0.0%) | 0 (0.0%) |
| 45 to 59 Minutes | 4 (17.4%) | 0 (0.0%) |
| 60 to 89 Minutes | 1 (4.3%) | 0 (0.0%) |
| 90 or more Minutes | 0 (0.0%) | 0 (0.0%) |
Time of Departure to Work by Sex in Tuttle
The most frequent times of departure to work in Tuttle are 7:00 AM to 7:29 AM (8, 34.8%) for males and 6:00 AM to 6:29 AM (3, 75.0%) for females.
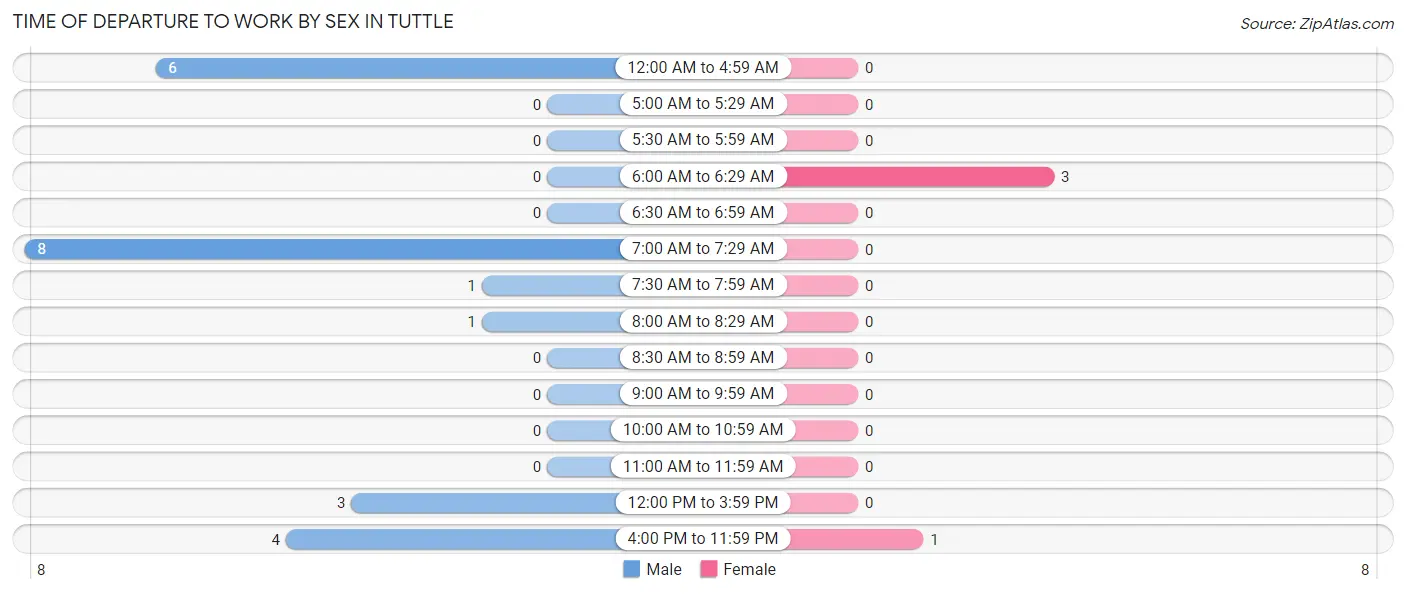
| Time of Departure | Male | Female |
| 12:00 AM to 4:59 AM | 6 (26.1%) | 0 (0.0%) |
| 5:00 AM to 5:29 AM | 0 (0.0%) | 0 (0.0%) |
| 5:30 AM to 5:59 AM | 0 (0.0%) | 0 (0.0%) |
| 6:00 AM to 6:29 AM | 0 (0.0%) | 3 (75.0%) |
| 6:30 AM to 6:59 AM | 0 (0.0%) | 0 (0.0%) |
| 7:00 AM to 7:29 AM | 8 (34.8%) | 0 (0.0%) |
| 7:30 AM to 7:59 AM | 1 (4.3%) | 0 (0.0%) |
| 8:00 AM to 8:29 AM | 1 (4.3%) | 0 (0.0%) |
| 8:30 AM to 8:59 AM | 0 (0.0%) | 0 (0.0%) |
| 9:00 AM to 9:59 AM | 0 (0.0%) | 0 (0.0%) |
| 10:00 AM to 10:59 AM | 0 (0.0%) | 0 (0.0%) |
| 11:00 AM to 11:59 AM | 0 (0.0%) | 0 (0.0%) |
| 12:00 PM to 3:59 PM | 3 (13.0%) | 0 (0.0%) |
| 4:00 PM to 11:59 PM | 4 (17.4%) | 1 (25.0%) |
| Total | 23 (100.0%) | 4 (100.0%) |
Housing Occupancy in Tuttle
Occupancy by Ownership in Tuttle
Of the total 34 dwellings in Tuttle, owner-occupied units account for 22 (64.7%), while renter-occupied units make up 12 (35.3%).
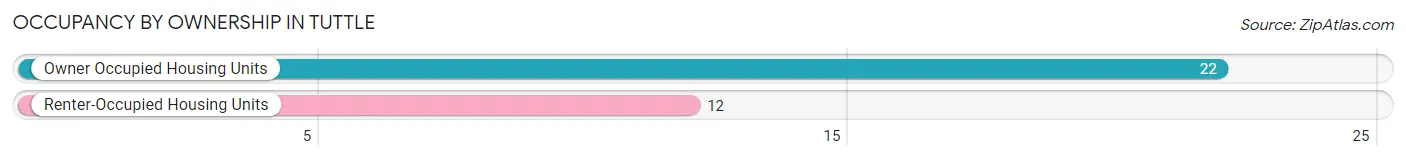
| Occupancy | # Housing Units | % Housing Units |
| Owner Occupied Housing Units | 22 | 64.7% |
| Renter-Occupied Housing Units | 12 | 35.3% |
| Total Occupied Housing Units | 34 | 100.0% |
Occupancy by Household Size in Tuttle
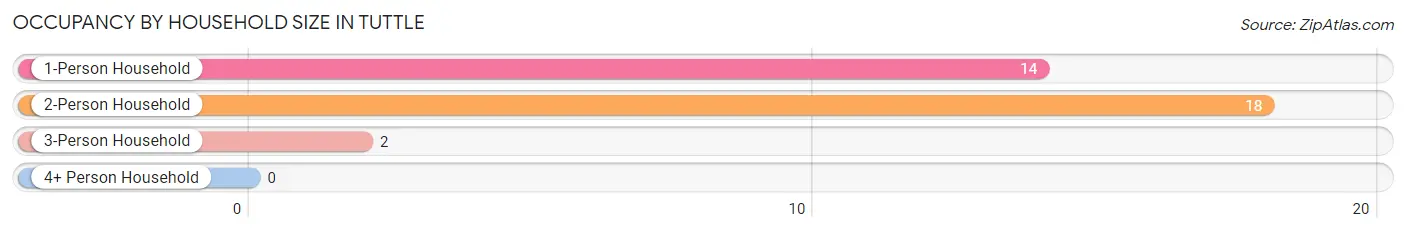
| Household Size | # Housing Units | % Housing Units |
| 1-Person Household | 14 | 41.2% |
| 2-Person Household | 18 | 52.9% |
| 3-Person Household | 2 | 5.9% |
| 4+ Person Household | 0 | 0.0% |
| Total Housing Units | 34 | 100.0% |
Occupancy by Ownership by Household Size in Tuttle
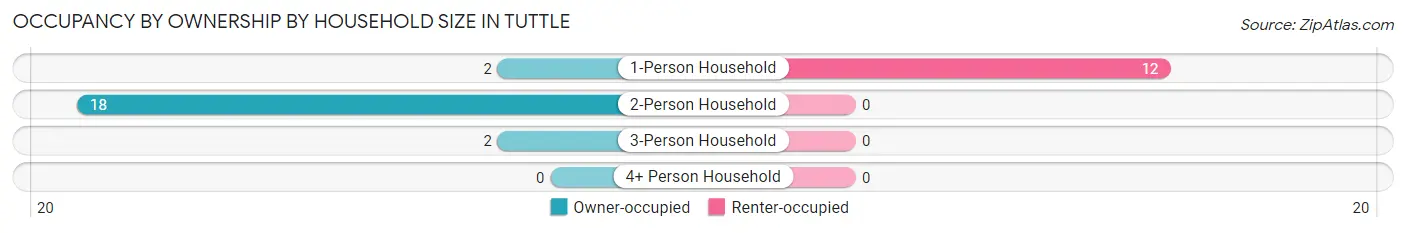
| Household Size | Owner-occupied | Renter-occupied |
| 1-Person Household | 2 (14.3%) | 12 (85.7%) |
| 2-Person Household | 18 (100.0%) | 0 (0.0%) |
| 3-Person Household | 2 (100.0%) | 0 (0.0%) |
| 4+ Person Household | 0 (0.0%) | 0 (0.0%) |
| Total Housing Units | 22 (64.7%) | 12 (35.3%) |
Occupancy by Educational Attainment in Tuttle
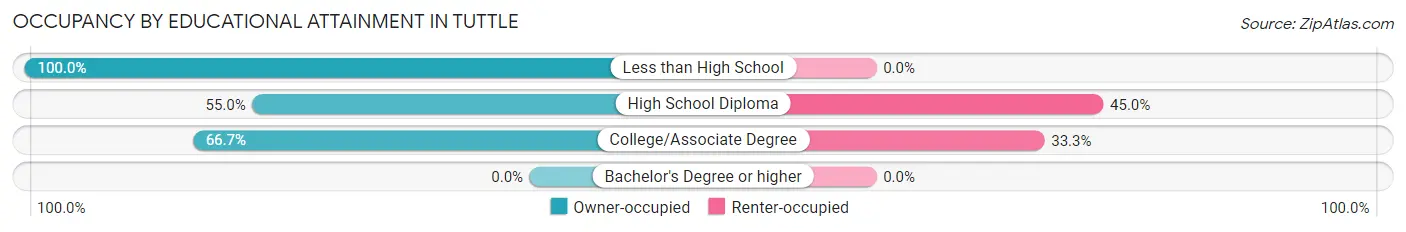
| Household Size | Owner-occupied | Renter-occupied |
| Less than High School | 5 (100.0%) | 0 (0.0%) |
| High School Diploma | 11 (55.0%) | 9 (45.0%) |
| College/Associate Degree | 6 (66.7%) | 3 (33.3%) |
| Bachelor's Degree or higher | 0 (0.0%) | 0 (0.0%) |
Occupancy by Age of Householder in Tuttle
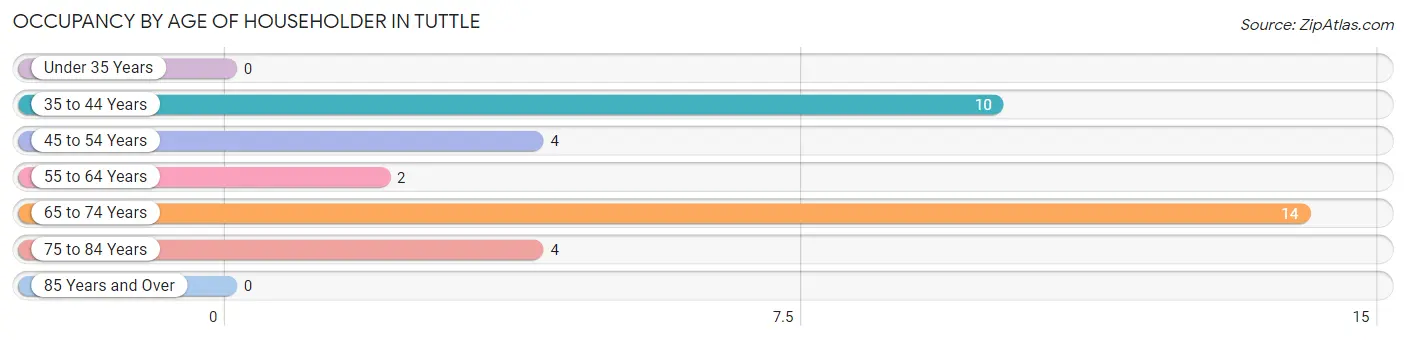
| Age Bracket | # Households | % Households |
| Under 35 Years | 0 | 0.0% |
| 35 to 44 Years | 10 | 29.4% |
| 45 to 54 Years | 4 | 11.8% |
| 55 to 64 Years | 2 | 5.9% |
| 65 to 74 Years | 14 | 41.2% |
| 75 to 84 Years | 4 | 11.8% |
| 85 Years and Over | 0 | 0.0% |
| Total | 34 | 100.0% |
Housing Finances in Tuttle
Median Income by Occupancy in Tuttle
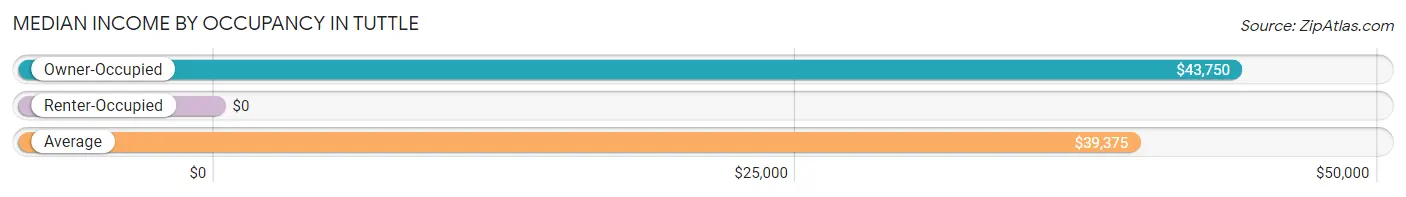
| Occupancy Type | # Households | Median Income |
| Owner-Occupied | 22 (64.7%) | $43,750 |
| Renter-Occupied | 12 (35.3%) | $0 |
| Average | 34 (100.0%) | $39,375 |
Occupancy by Householder Income Bracket in Tuttle
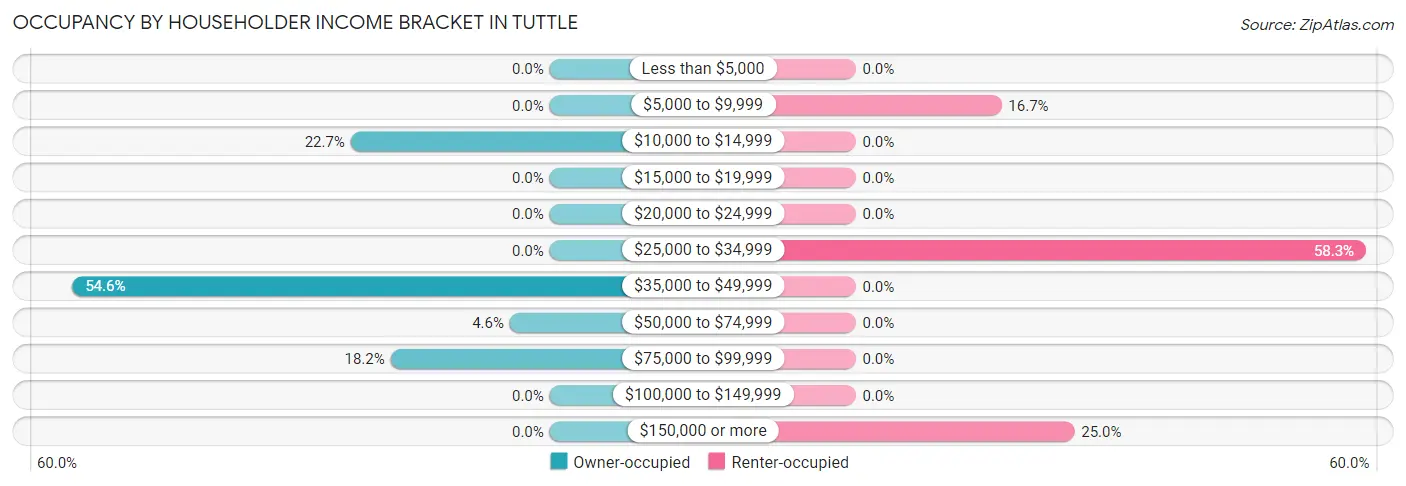
| Income Bracket | Owner-occupied | Renter-occupied |
| Less than $5,000 | 0 (0.0%) | 0 (0.0%) |
| $5,000 to $9,999 | 0 (0.0%) | 2 (16.7%) |
| $10,000 to $14,999 | 5 (22.7%) | 0 (0.0%) |
| $15,000 to $19,999 | 0 (0.0%) | 0 (0.0%) |
| $20,000 to $24,999 | 0 (0.0%) | 0 (0.0%) |
| $25,000 to $34,999 | 0 (0.0%) | 7 (58.3%) |
| $35,000 to $49,999 | 12 (54.5%) | 0 (0.0%) |
| $50,000 to $74,999 | 1 (4.5%) | 0 (0.0%) |
| $75,000 to $99,999 | 4 (18.2%) | 0 (0.0%) |
| $100,000 to $149,999 | 0 (0.0%) | 0 (0.0%) |
| $150,000 or more | 0 (0.0%) | 3 (25.0%) |
| Total | 22 (100.0%) | 12 (100.0%) |
Monthly Housing Cost Tiers in Tuttle
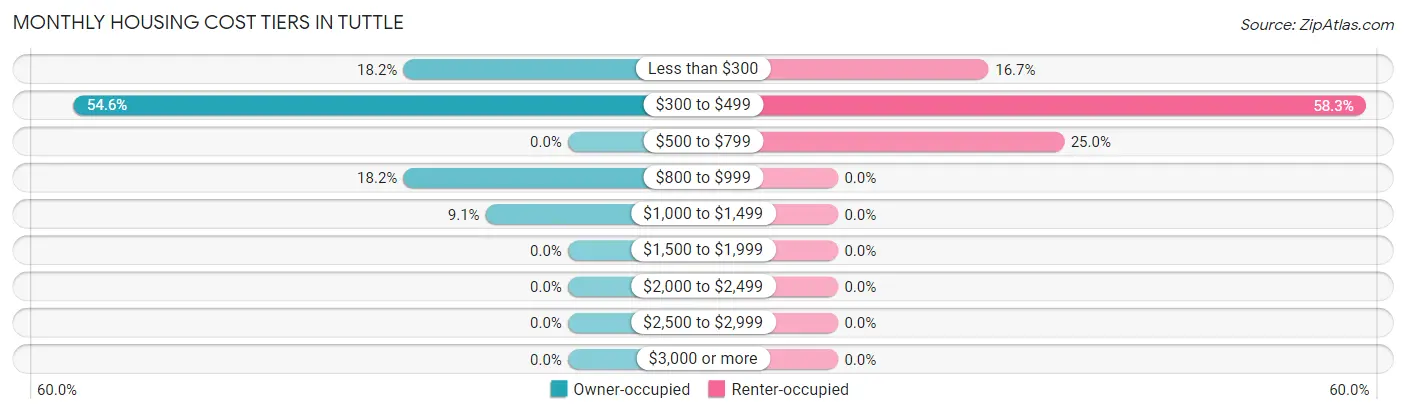
| Monthly Cost | Owner-occupied | Renter-occupied |
| Less than $300 | 4 (18.2%) | 2 (16.7%) |
| $300 to $499 | 12 (54.5%) | 7 (58.3%) |
| $500 to $799 | 0 (0.0%) | 3 (25.0%) |
| $800 to $999 | 4 (18.2%) | 0 (0.0%) |
| $1,000 to $1,499 | 2 (9.1%) | 0 (0.0%) |
| $1,500 to $1,999 | 0 (0.0%) | 0 (0.0%) |
| $2,000 to $2,499 | 0 (0.0%) | 0 (0.0%) |
| $2,500 to $2,999 | 0 (0.0%) | 0 (0.0%) |
| $3,000 or more | 0 (0.0%) | 0 (0.0%) |
| Total | 22 (100.0%) | 12 (100.0%) |
Physical Housing Characteristics in Tuttle
Housing Structures in Tuttle
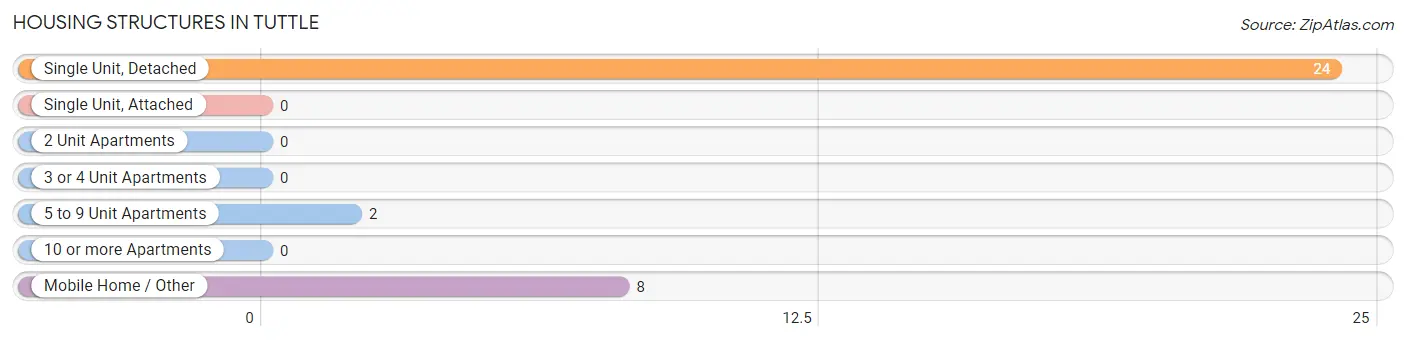
| Structure Type | # Housing Units | % Housing Units |
| Single Unit, Detached | 24 | 70.6% |
| Single Unit, Attached | 0 | 0.0% |
| 2 Unit Apartments | 0 | 0.0% |
| 3 or 4 Unit Apartments | 0 | 0.0% |
| 5 to 9 Unit Apartments | 2 | 5.9% |
| 10 or more Apartments | 0 | 0.0% |
| Mobile Home / Other | 8 | 23.5% |
| Total | 34 | 100.0% |
Housing Structures by Occupancy in Tuttle
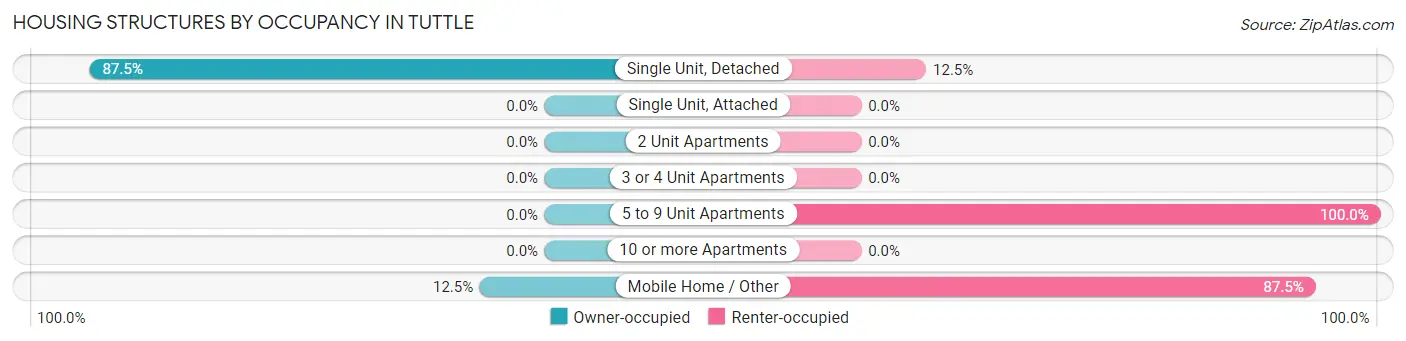
| Structure Type | Owner-occupied | Renter-occupied |
| Single Unit, Detached | 21 (87.5%) | 3 (12.5%) |
| Single Unit, Attached | 0 (0.0%) | 0 (0.0%) |
| 2 Unit Apartments | 0 (0.0%) | 0 (0.0%) |
| 3 or 4 Unit Apartments | 0 (0.0%) | 0 (0.0%) |
| 5 to 9 Unit Apartments | 0 (0.0%) | 2 (100.0%) |
| 10 or more Apartments | 0 (0.0%) | 0 (0.0%) |
| Mobile Home / Other | 1 (12.5%) | 7 (87.5%) |
| Total | 22 (64.7%) | 12 (35.3%) |
Housing Structures by Number of Rooms in Tuttle
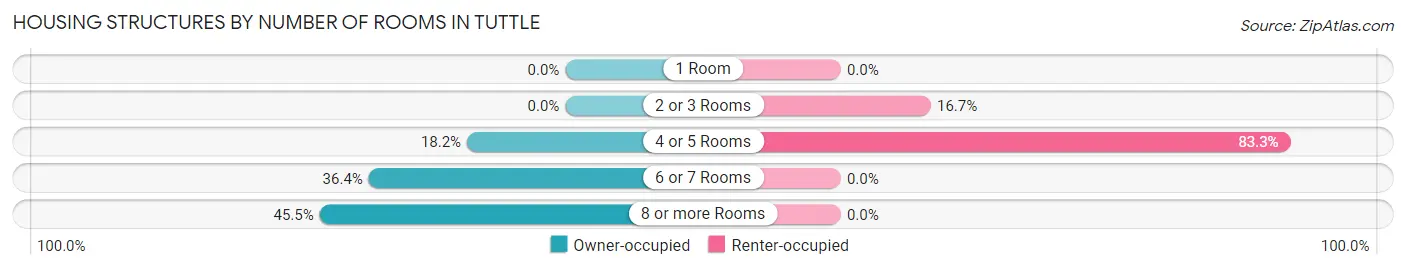
| Number of Rooms | Owner-occupied | Renter-occupied |
| 1 Room | 0 (0.0%) | 0 (0.0%) |
| 2 or 3 Rooms | 0 (0.0%) | 2 (16.7%) |
| 4 or 5 Rooms | 4 (18.2%) | 10 (83.3%) |
| 6 or 7 Rooms | 8 (36.4%) | 0 (0.0%) |
| 8 or more Rooms | 10 (45.5%) | 0 (0.0%) |
| Total | 22 (100.0%) | 12 (100.0%) |
Housing Structure by Heating Type in Tuttle
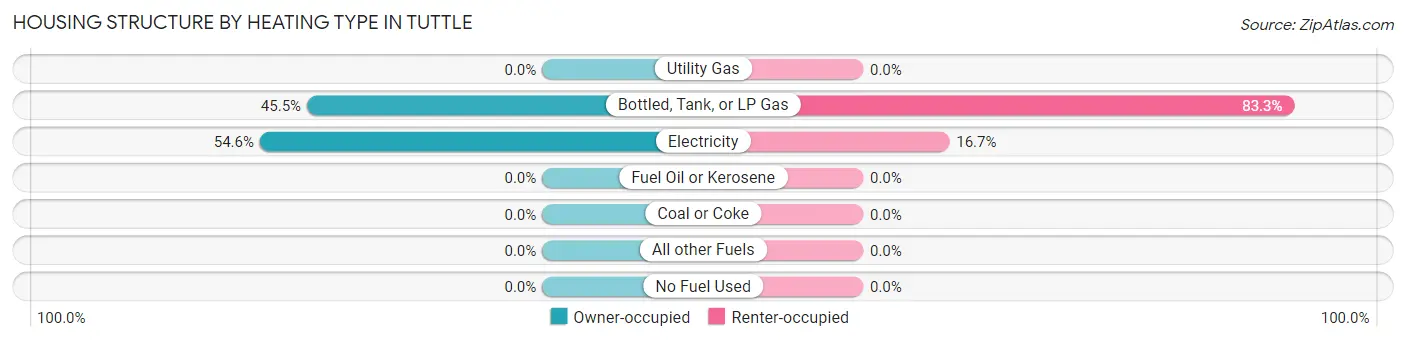
| Heating Type | Owner-occupied | Renter-occupied |
| Utility Gas | 0 (0.0%) | 0 (0.0%) |
| Bottled, Tank, or LP Gas | 10 (45.5%) | 10 (83.3%) |
| Electricity | 12 (54.5%) | 2 (16.7%) |
| Fuel Oil or Kerosene | 0 (0.0%) | 0 (0.0%) |
| Coal or Coke | 0 (0.0%) | 0 (0.0%) |
| All other Fuels | 0 (0.0%) | 0 (0.0%) |
| No Fuel Used | 0 (0.0%) | 0 (0.0%) |
| Total | 22 (100.0%) | 12 (100.0%) |
Household Vehicle Usage in Tuttle
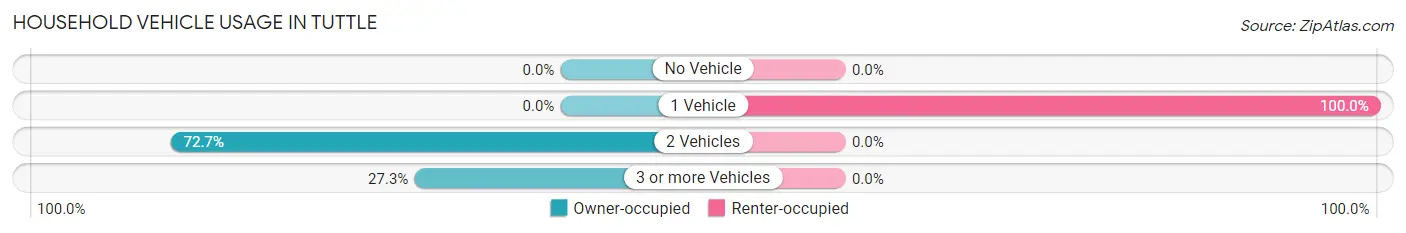
| Vehicles per Household | Owner-occupied | Renter-occupied |
| No Vehicle | 0 (0.0%) | 0 (0.0%) |
| 1 Vehicle | 0 (0.0%) | 12 (100.0%) |
| 2 Vehicles | 16 (72.7%) | 0 (0.0%) |
| 3 or more Vehicles | 6 (27.3%) | 0 (0.0%) |
| Total | 22 (100.0%) | 12 (100.0%) |
Real Estate & Mortgages in Tuttle
Real Estate and Mortgage Overview in Tuttle
| Characteristic | Without Mortgage | With Mortgage |
| Housing Units | 16 | 6 |
| Median Property Value | - | - |
| Median Household Income | $39,375 | $0 |
| Monthly Housing Costs | $350 | $0 |
| Real Estate Taxes | - | - |
Property Value by Mortgage Status in Tuttle
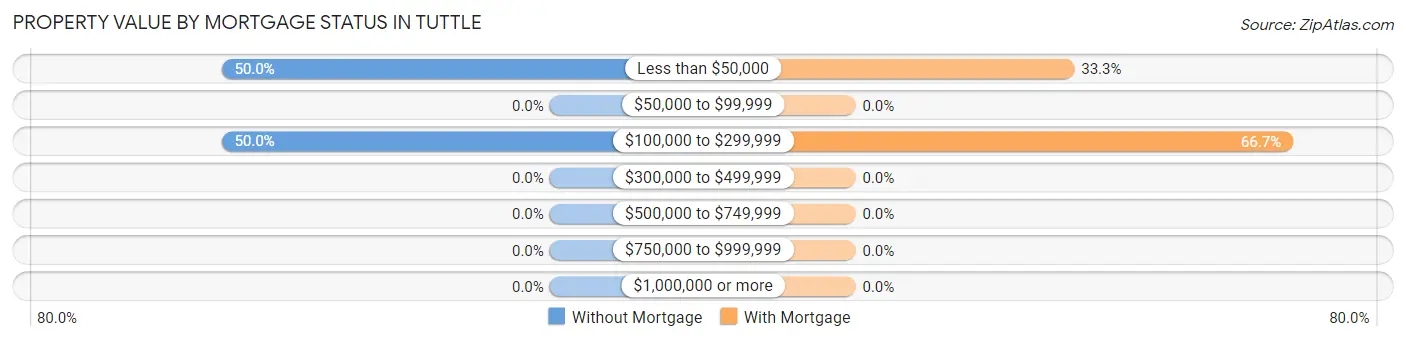
| Property Value | Without Mortgage | With Mortgage |
| Less than $50,000 | 8 (50.0%) | 2 (33.3%) |
| $50,000 to $99,999 | 0 (0.0%) | 0 (0.0%) |
| $100,000 to $299,999 | 8 (50.0%) | 4 (66.7%) |
| $300,000 to $499,999 | 0 (0.0%) | 0 (0.0%) |
| $500,000 to $749,999 | 0 (0.0%) | 0 (0.0%) |
| $750,000 to $999,999 | 0 (0.0%) | 0 (0.0%) |
| $1,000,000 or more | 0 (0.0%) | 0 (0.0%) |
| Total | 16 (100.0%) | 6 (100.0%) |
Household Income by Mortgage Status in Tuttle
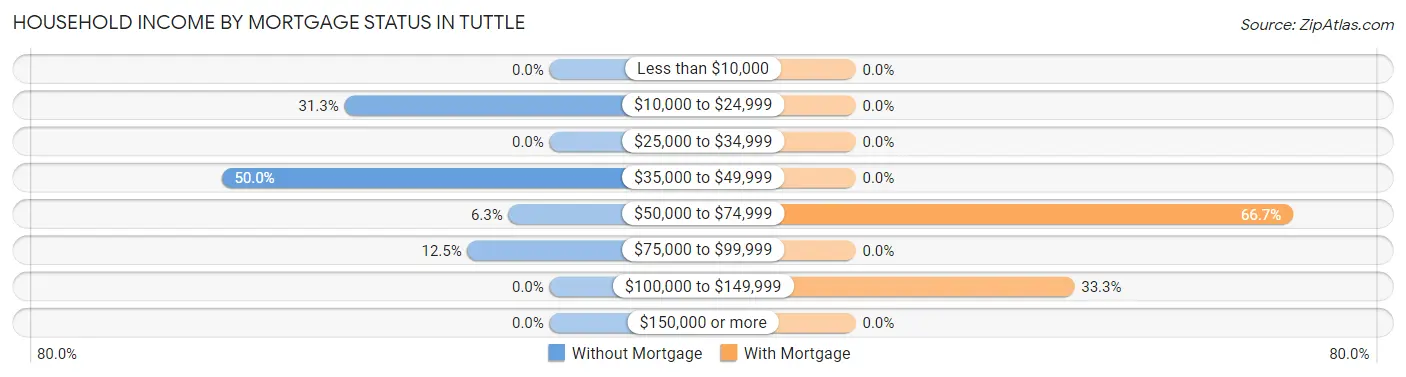
| Household Income | Without Mortgage | With Mortgage |
| Less than $10,000 | 0 (0.0%) | 0 (0.0%) |
| $10,000 to $24,999 | 5 (31.2%) | 0 (0.0%) |
| $25,000 to $34,999 | 0 (0.0%) | 0 (0.0%) |
| $35,000 to $49,999 | 8 (50.0%) | 0 (0.0%) |
| $50,000 to $74,999 | 1 (6.2%) | 4 (66.7%) |
| $75,000 to $99,999 | 2 (12.5%) | 0 (0.0%) |
| $100,000 to $149,999 | 0 (0.0%) | 2 (33.3%) |
| $150,000 or more | 0 (0.0%) | 0 (0.0%) |
| Total | 16 (100.0%) | 6 (100.0%) |
Property Value to Household Income Ratio in Tuttle
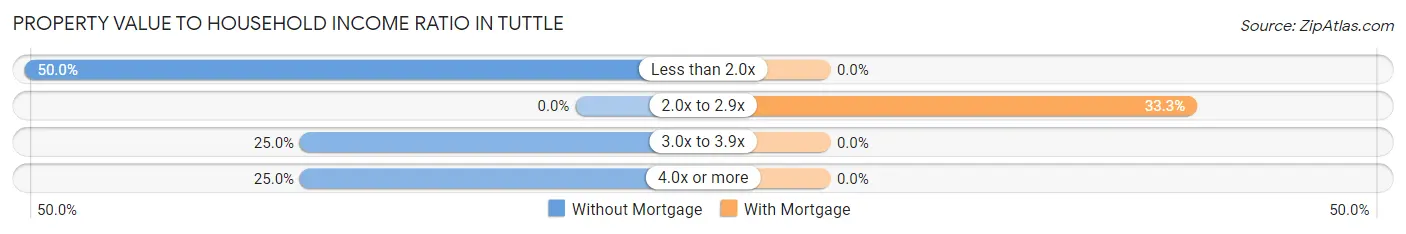
| Value-to-Income Ratio | Without Mortgage | With Mortgage |
| Less than 2.0x | 8 (50.0%) | 0 (0.0%) |
| 2.0x to 2.9x | 0 (0.0%) | 2 (33.3%) |
| 3.0x to 3.9x | 4 (25.0%) | 0 (0.0%) |
| 4.0x or more | 4 (25.0%) | 0 (0.0%) |
| Total | 16 (100.0%) | 6 (100.0%) |
Real Estate Taxes by Mortgage Status in Tuttle
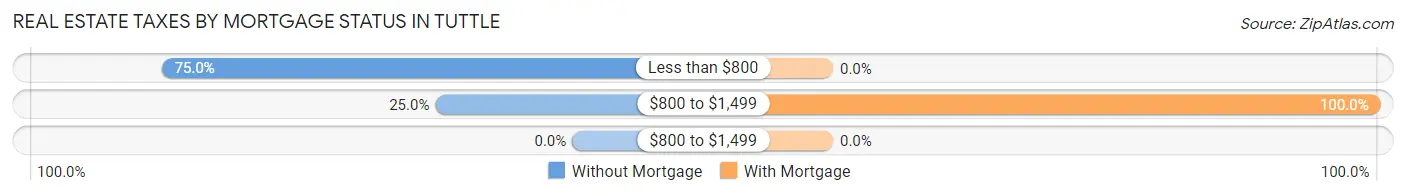
| Property Taxes | Without Mortgage | With Mortgage |
| Less than $800 | 12 (75.0%) | 0 (0.0%) |
| $800 to $1,499 | 4 (25.0%) | 6 (100.0%) |
| $800 to $1,499 | 0 (0.0%) | 0 (0.0%) |
| Total | 16 (100.0%) | 6 (100.0%) |
Health & Disability in Tuttle
Health Insurance Coverage by Age in Tuttle
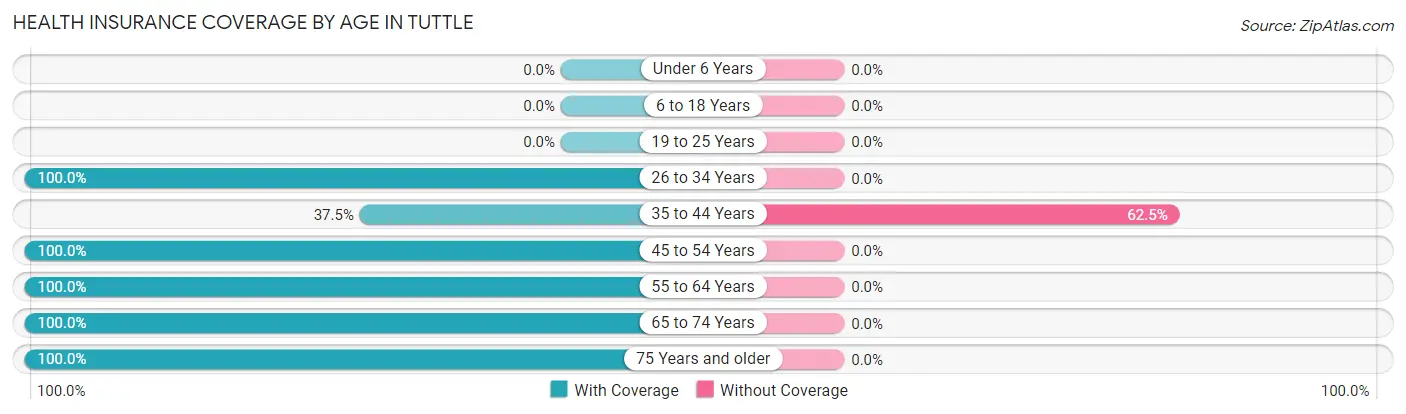
| Age Bracket | With Coverage | Without Coverage |
| Under 6 Years | 0 (0.0%) | 0 (0.0%) |
| 6 to 18 Years | 0 (0.0%) | 0 (0.0%) |
| 19 to 25 Years | 0 (0.0%) | 0 (0.0%) |
| 26 to 34 Years | 1 (100.0%) | 0 (0.0%) |
| 35 to 44 Years | 6 (37.5%) | 10 (62.5%) |
| 45 to 54 Years | 4 (100.0%) | 0 (0.0%) |
| 55 to 64 Years | 6 (100.0%) | 0 (0.0%) |
| 65 to 74 Years | 15 (100.0%) | 0 (0.0%) |
| 75 Years and older | 11 (100.0%) | 0 (0.0%) |
| Total | 43 (81.1%) | 10 (18.9%) |
Health Insurance Coverage by Citizenship Status in Tuttle
| Citizenship Status | With Coverage | Without Coverage |
| Native Born | 0 (0.0%) | 0 (0.0%) |
| Foreign Born, Citizen | 0 (0.0%) | 0 (0.0%) |
| Foreign Born, not a Citizen | 0 (0.0%) | 0 (0.0%) |
Health Insurance Coverage by Household Income in Tuttle
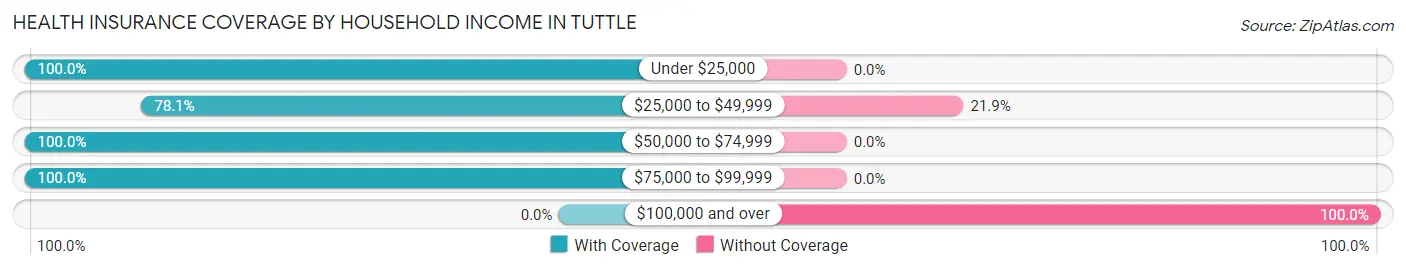
| Household Income | With Coverage | Without Coverage |
| Under $25,000 | 10 (100.0%) | 0 (0.0%) |
| $25,000 to $49,999 | 25 (78.1%) | 7 (21.9%) |
| $50,000 to $74,999 | 1 (100.0%) | 0 (0.0%) |
| $75,000 to $99,999 | 7 (100.0%) | 0 (0.0%) |
| $100,000 and over | 0 (0.0%) | 3 (100.0%) |
Public vs Private Health Insurance Coverage by Age in Tuttle
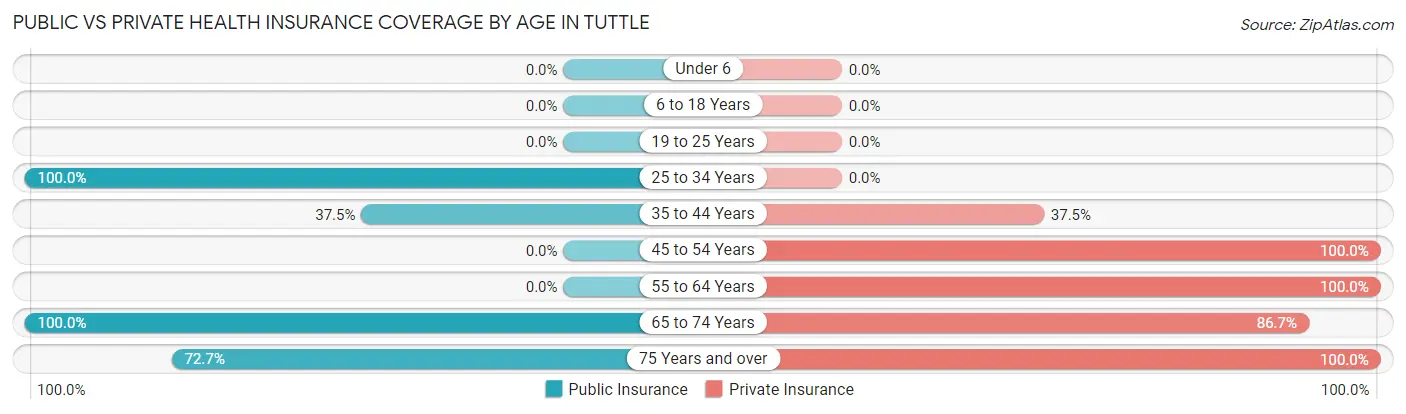
| Age Bracket | Public Insurance | Private Insurance |
| Under 6 | 0 (0.0%) | 0 (0.0%) |
| 6 to 18 Years | 0 (0.0%) | 0 (0.0%) |
| 19 to 25 Years | 0 (0.0%) | 0 (0.0%) |
| 25 to 34 Years | 1 (100.0%) | 0 (0.0%) |
| 35 to 44 Years | 6 (37.5%) | 6 (37.5%) |
| 45 to 54 Years | 0 (0.0%) | 4 (100.0%) |
| 55 to 64 Years | 0 (0.0%) | 6 (100.0%) |
| 65 to 74 Years | 15 (100.0%) | 13 (86.7%) |
| 75 Years and over | 8 (72.7%) | 11 (100.0%) |
| Total | 30 (56.6%) | 40 (75.5%) |
Disability Status by Sex by Age in Tuttle
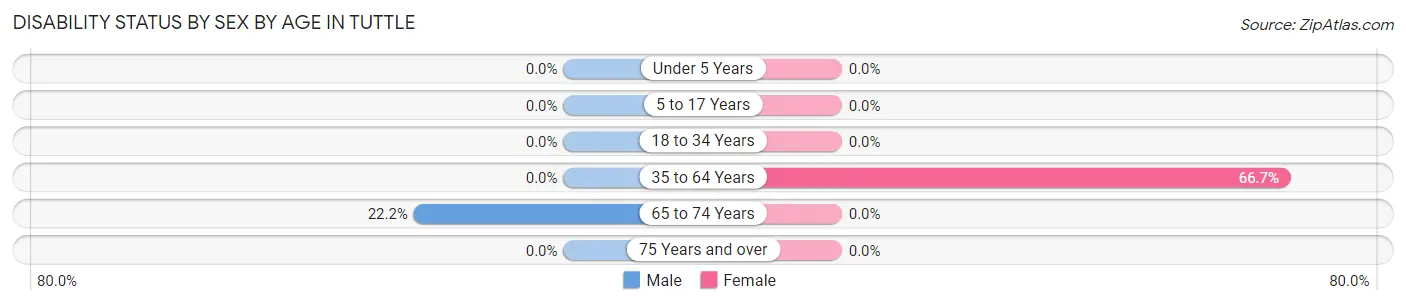
| Age Bracket | Male | Female |
| Under 5 Years | 0 (0.0%) | 0 (0.0%) |
| 5 to 17 Years | 0 (0.0%) | 0 (0.0%) |
| 18 to 34 Years | 0 (0.0%) | 0 (0.0%) |
| 35 to 64 Years | 0 (0.0%) | 6 (66.7%) |
| 65 to 74 Years | 2 (22.2%) | 0 (0.0%) |
| 75 Years and over | 0 (0.0%) | 0 (0.0%) |
Disability Class by Sex by Age in Tuttle
Disability Class: Hearing Difficulty
| Age Bracket | Male | Female |
| Under 5 Years | 0 (0.0%) | 0 (0.0%) |
| 5 to 17 Years | 0 (0.0%) | 0 (0.0%) |
| 18 to 34 Years | 0 (0.0%) | 0 (0.0%) |
| 35 to 64 Years | 0 (0.0%) | 0 (0.0%) |
| 65 to 74 Years | 0 (0.0%) | 0 (0.0%) |
| 75 Years and over | 0 (0.0%) | 0 (0.0%) |
Disability Class: Vision Difficulty
| Age Bracket | Male | Female |
| Under 5 Years | 0 (0.0%) | 0 (0.0%) |
| 5 to 17 Years | 0 (0.0%) | 0 (0.0%) |
| 18 to 34 Years | 0 (0.0%) | 0 (0.0%) |
| 35 to 64 Years | 0 (0.0%) | 0 (0.0%) |
| 65 to 74 Years | 0 (0.0%) | 0 (0.0%) |
| 75 Years and over | 0 (0.0%) | 0 (0.0%) |
Disability Class: Cognitive Difficulty
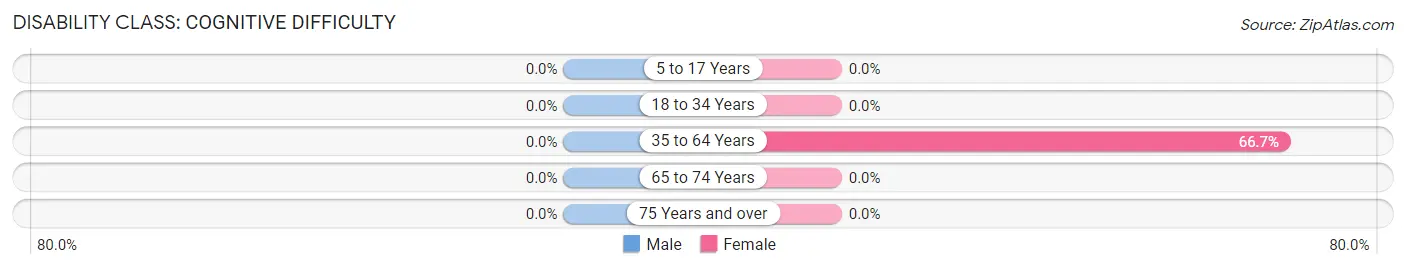
| Age Bracket | Male | Female |
| 5 to 17 Years | 0 (0.0%) | 0 (0.0%) |
| 18 to 34 Years | 0 (0.0%) | 0 (0.0%) |
| 35 to 64 Years | 0 (0.0%) | 6 (66.7%) |
| 65 to 74 Years | 0 (0.0%) | 0 (0.0%) |
| 75 Years and over | 0 (0.0%) | 0 (0.0%) |
Disability Class: Ambulatory Difficulty
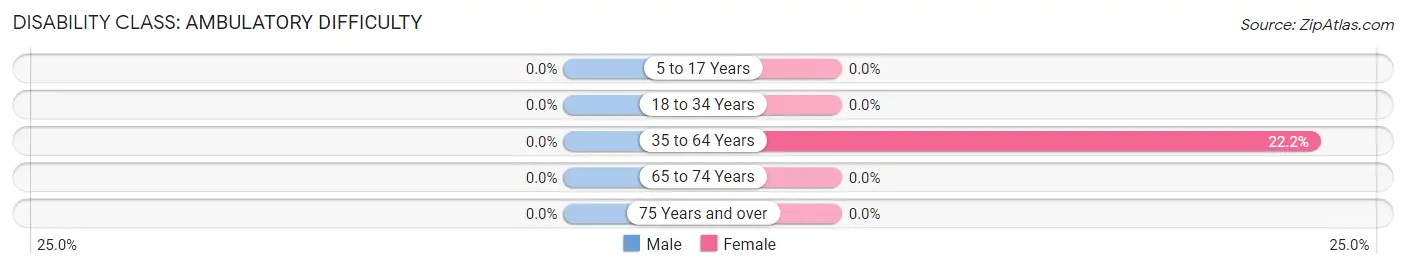
| Age Bracket | Male | Female |
| 5 to 17 Years | 0 (0.0%) | 0 (0.0%) |
| 18 to 34 Years | 0 (0.0%) | 0 (0.0%) |
| 35 to 64 Years | 0 (0.0%) | 2 (22.2%) |
| 65 to 74 Years | 0 (0.0%) | 0 (0.0%) |
| 75 Years and over | 0 (0.0%) | 0 (0.0%) |
Disability Class: Self-Care Difficulty
| Age Bracket | Male | Female |
| 5 to 17 Years | 0 (0.0%) | 0 (0.0%) |
| 18 to 34 Years | 0 (0.0%) | 0 (0.0%) |
| 35 to 64 Years | 0 (0.0%) | 0 (0.0%) |
| 65 to 74 Years | 0 (0.0%) | 0 (0.0%) |
| 75 Years and over | 0 (0.0%) | 0 (0.0%) |
Technology Access in Tuttle
Computing Device Access in Tuttle
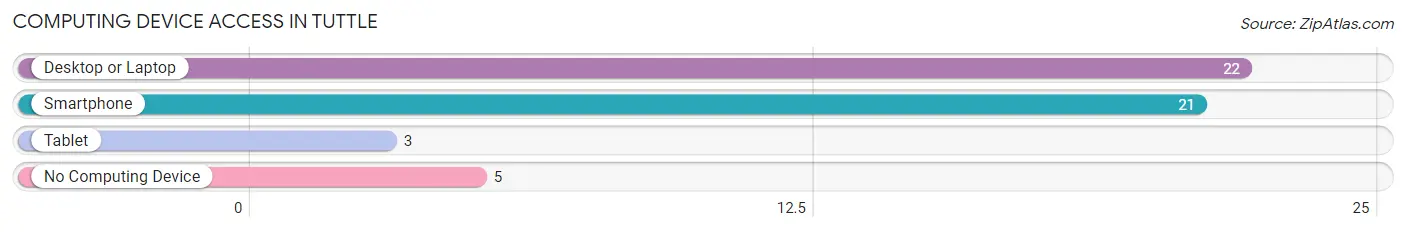
| Device Type | # Households | % Households |
| Desktop or Laptop | 22 | 64.7% |
| Smartphone | 21 | 61.8% |
| Tablet | 3 | 8.8% |
| No Computing Device | 5 | 14.7% |
| Total | 34 | 100.0% |
Internet Access in Tuttle
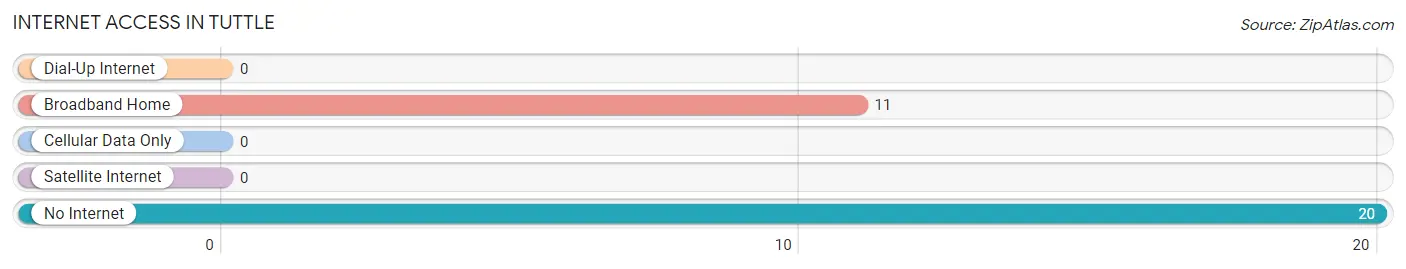
| Internet Type | # Households | % Households |
| Dial-Up Internet | 0 | 0.0% |
| Broadband Home | 11 | 32.4% |
| Cellular Data Only | 0 | 0.0% |
| Satellite Internet | 0 | 0.0% |
| No Internet | 20 | 58.8% |
| Total | 34 | 100.0% |
Tuttle Summary
Tuttle is a small city located in Cass County, North Dakota. It is situated on the banks of the Sheyenne River, approximately 20 miles west of Fargo. The city was founded in 1882 and was named after the first postmaster, William Tuttle. The population of Tuttle was estimated to be 545 in 2019.
Geography
Tuttle is located in the Red River Valley, a flat, fertile region of the Great Plains. The city is situated on the banks of the Sheyenne River, which flows through the city and provides a source of recreation for the residents. The city is surrounded by agricultural land, with the majority of the land being used for farming. The climate in Tuttle is continental, with cold winters and hot summers.
Economy
Tuttle’s economy is largely based on agriculture. The city is home to several farms, which produce a variety of crops, including wheat, corn, soybeans, and sunflowers. The city also has a number of businesses, including a grocery store, a hardware store, and a restaurant.
Demographics
Tuttle is a predominantly white city, with the majority of the population being of German and Norwegian descent. The median household income in Tuttle is $45,000, and the median home value is $125,000. The city has a low unemployment rate, and the majority of the population is employed in the agricultural sector.
History
Tuttle was founded in 1882 and was named after the first postmaster, William Tuttle. The city was originally a farming community, and the majority of the population was of German and Norwegian descent. The city was incorporated in 1887 and has remained a small, rural community ever since.
In the early 1900s, Tuttle was a thriving agricultural community, with a number of businesses and a railroad line running through the city. The city was also home to a number of churches, schools, and other organizations.
In the 1950s, Tuttle began to experience a decline in population as many of the residents moved away to larger cities. The city has since experienced a resurgence in population, and the economy has diversified to include a number of businesses and services.
Today, Tuttle is a small, rural community with a population of approximately 545. The city is home to a number of businesses, including a grocery store, a hardware store, and a restaurant. The city is also home to a number of churches, schools, and other organizations. The city is a popular destination for outdoor recreation, with the Sheyenne River providing a source of recreation for the residents.
Common Questions
What is the Total Population of Tuttle?
Total Population of Tuttle is 53.
What is the Total Male Population of Tuttle?
Total Male Population of Tuttle is 35.
What is the Total Female Population of Tuttle?
Total Female Population of Tuttle is 18.
What is the Ratio of Males per 100 Females in Tuttle?
There are 194.44 Males per 100 Females in Tuttle.
What is the Ratio of Females per 100 Males in Tuttle?
There are 51.43 Females per 100 Males in Tuttle.
What is the Median Population Age in Tuttle?
Median Population Age in Tuttle is 59.8 Years.
What is the Average Family Size in Tuttle
Average Family Size in Tuttle is 1.9 People.
What is the Average Household Size in Tuttle
Average Household Size in Tuttle is 1.6 People.
What is Per Capita Income in Tuttle?
Per Capita income in Tuttle is $42,268.
What is the Median Family Income in Tuttle?
Median Family Income in Tuttle is $43,750.
What is the Median Household income in Tuttle?
Median Household Income in Tuttle is $39,375.
What is Inequality or Gini Index in Tuttle?
Inequality or Gini Index in Tuttle is 0.53.
How Large is the Labor Force in Tuttle?
There are 27 People in the Labor Forcein in Tuttle.
What is the Percentage of People in the Labor Force in Tuttle?
50.9% of People are in the Labor Force in Tuttle.