Riverdale, ND
Riverdale Map
Riverdale Overview
182
TOTAL POPULATION
88
MALE POPULATION
94
FEMALE POPULATION
93.62
MALES / 100 FEMALES
106.82
FEMALES / 100 MALES
63.2
MEDIAN AGE
2.0
AVG FAMILY SIZE
1.8
AVG HOUSEHOLD SIZE
$58,265
PER CAPITA INCOME
$101,750
AVG FAMILY INCOME
$86,250
AVG HOUSEHOLD INCOME
31.6%
WAGE / INCOME GAP [ % ]
68.4¢/ $1
WAGE / INCOME GAP [ $ ]
0.38
INEQUALITY / GINI INDEX
96
LABOR FORCE [ PEOPLE ]
54.9%
PERCENT IN LABOR FORCE
Riverdale Zip Codes
Riverdale Area Codes
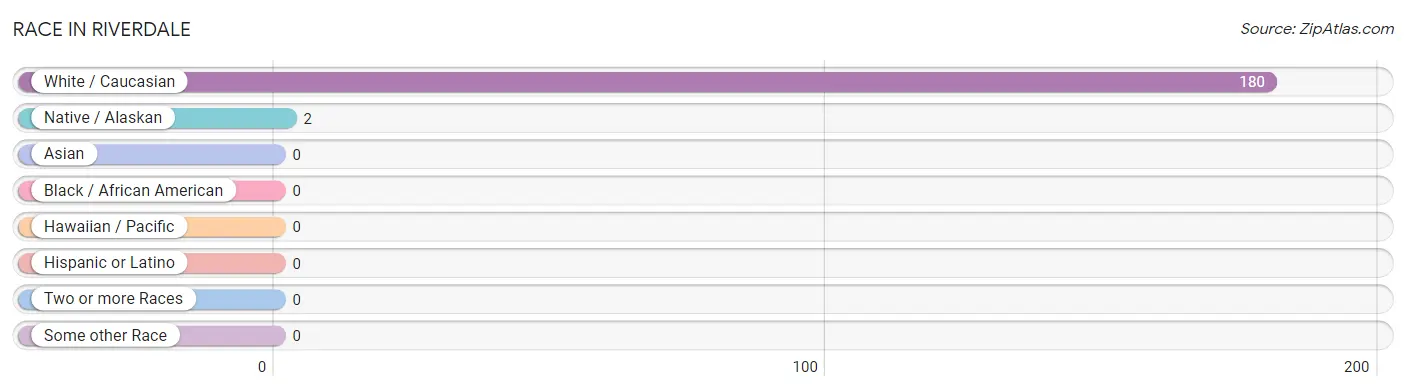
Race in Riverdale
The most populous races in Riverdale are White / Caucasian (180 | 98.9%), and Native / Alaskan (2 | 1.1%).
| Race | # Population | % Population |
| Asian | 0 | 0.0% |
| Black / African American | 0 | 0.0% |
| Hawaiian / Pacific | 0 | 0.0% |
| Hispanic or Latino | 0 | 0.0% |
| Native / Alaskan | 2 | 1.1% |
| White / Caucasian | 180 | 98.9% |
| Two or more Races | 0 | 0.0% |
| Some other Race | 0 | 0.0% |
| Total | 182 | 100.0% |
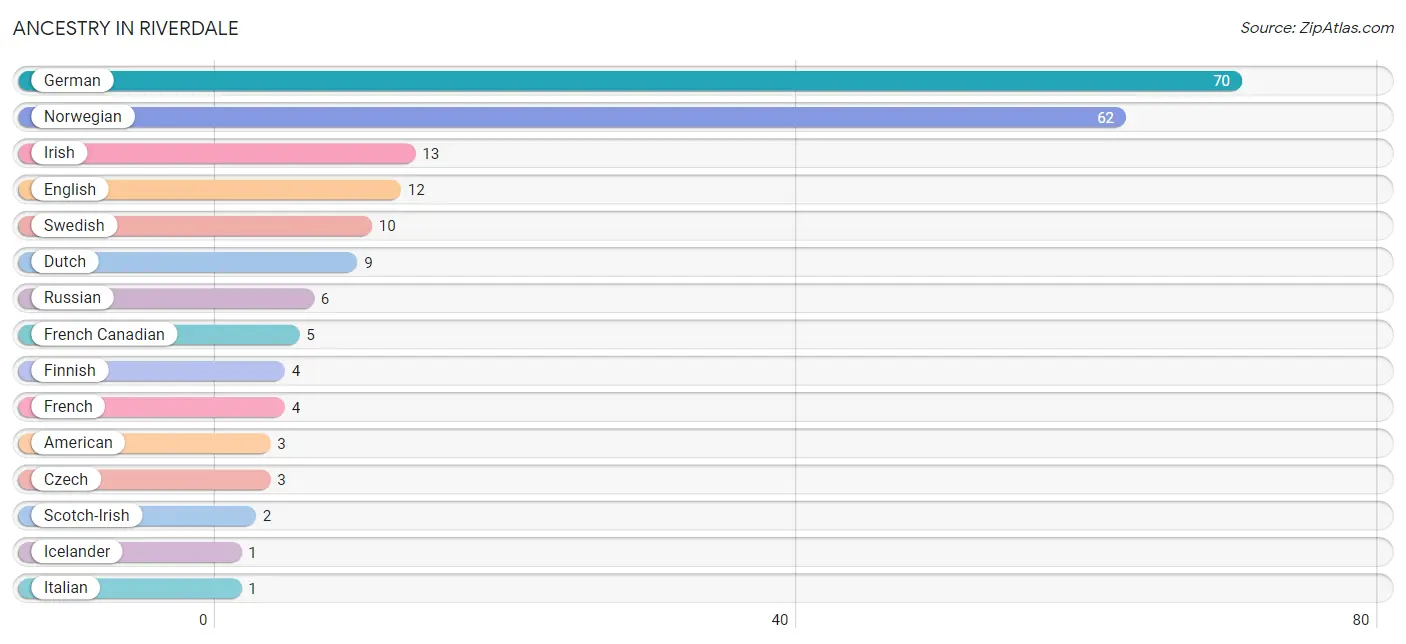
Ancestry in Riverdale
The most populous ancestries reported in Riverdale are German (70 | 38.5%), Norwegian (62 | 34.1%), Irish (13 | 7.1%), English (12 | 6.6%), and Swedish (10 | 5.5%), together accounting for 91.7% of all Riverdale residents.
| Ancestry | # Population | % Population |
| American | 3 | 1.7% |
| Czech | 3 | 1.7% |
| Dutch | 9 | 5.0% |
| English | 12 | 6.6% |
| Finnish | 4 | 2.2% |
| French | 4 | 2.2% |
| French Canadian | 5 | 2.8% |
| German | 70 | 38.5% |
| Icelander | 1 | 0.5% |
| Irish | 13 | 7.1% |
| Italian | 1 | 0.5% |
| Norwegian | 62 | 34.1% |
| Russian | 6 | 3.3% |
| Scotch-Irish | 2 | 1.1% |
| Swedish | 10 | 5.5% | View All 15 Rows |
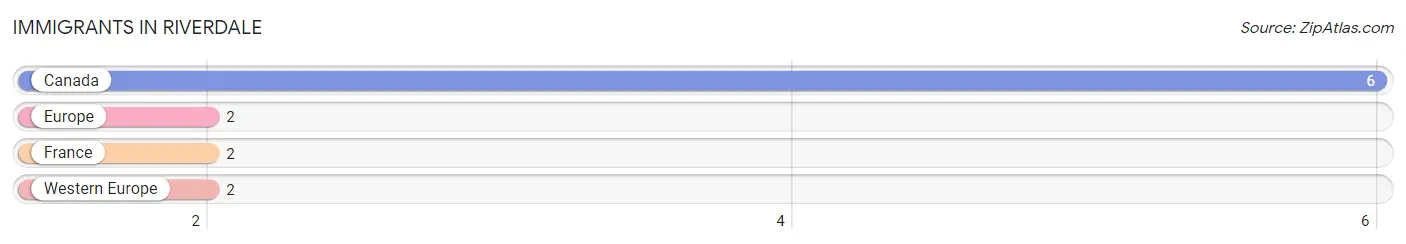
Immigrants in Riverdale
The most numerous immigrant groups reported in Riverdale came from Canada (6 | 3.3%), Europe (2 | 1.1%), France (2 | 1.1%), and Western Europe (2 | 1.1%), together accounting for 6.6% of all Riverdale residents.
| Immigration Origin | # Population | % Population |
| Canada | 6 | 3.3% |
| Europe | 2 | 1.1% |
| France | 2 | 1.1% |
| Western Europe | 2 | 1.1% | View All 4 Rows |
Sex and Age in Riverdale
Sex and Age in Riverdale
The most populous age groups in Riverdale are 60 to 64 Years (23 | 26.1%) for men and 65 to 69 Years (21 | 22.3%) for women.
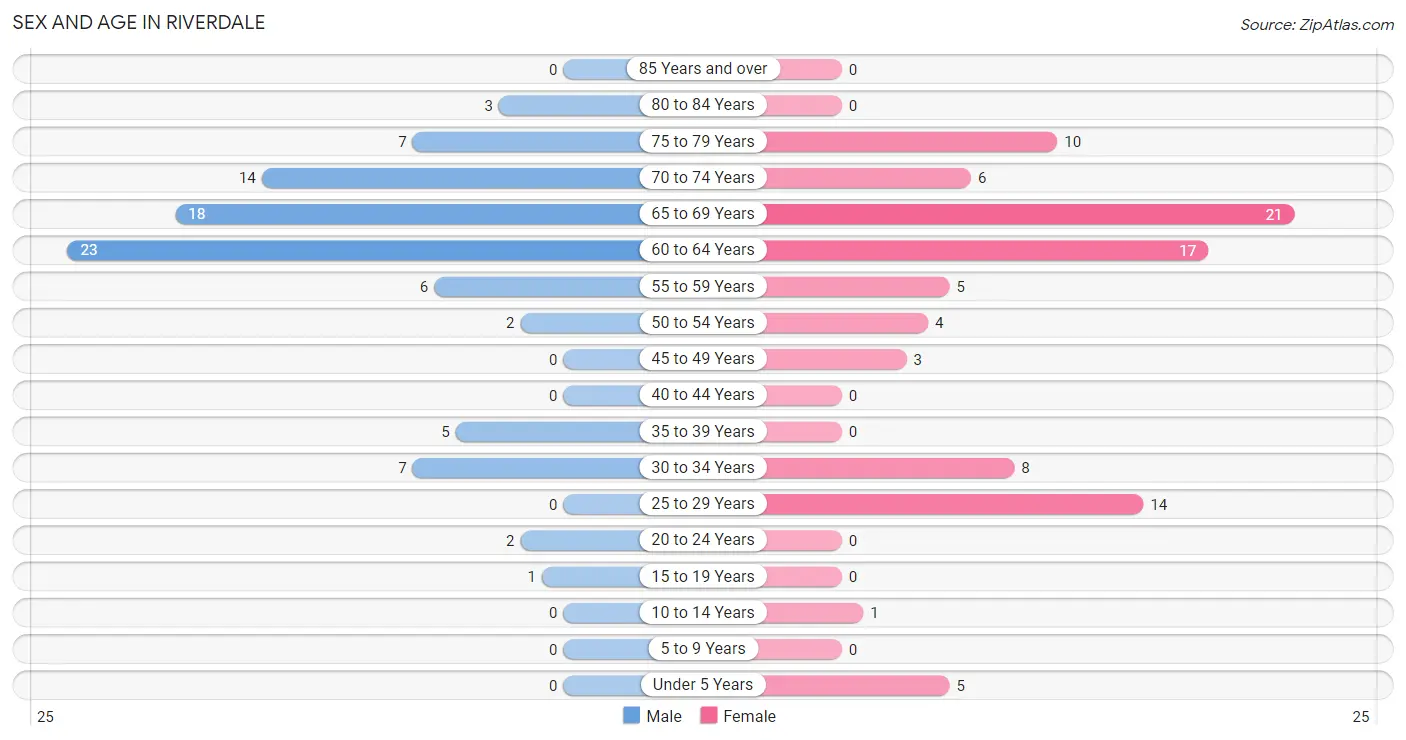
| Age Bracket | Male | Female |
| Under 5 Years | 0 (0.0%) | 5 (5.3%) |
| 5 to 9 Years | 0 (0.0%) | 0 (0.0%) |
| 10 to 14 Years | 0 (0.0%) | 1 (1.1%) |
| 15 to 19 Years | 1 (1.1%) | 0 (0.0%) |
| 20 to 24 Years | 2 (2.3%) | 0 (0.0%) |
| 25 to 29 Years | 0 (0.0%) | 14 (14.9%) |
| 30 to 34 Years | 7 (8.0%) | 8 (8.5%) |
| 35 to 39 Years | 5 (5.7%) | 0 (0.0%) |
| 40 to 44 Years | 0 (0.0%) | 0 (0.0%) |
| 45 to 49 Years | 0 (0.0%) | 3 (3.2%) |
| 50 to 54 Years | 2 (2.3%) | 4 (4.3%) |
| 55 to 59 Years | 6 (6.8%) | 5 (5.3%) |
| 60 to 64 Years | 23 (26.1%) | 17 (18.1%) |
| 65 to 69 Years | 18 (20.4%) | 21 (22.3%) |
| 70 to 74 Years | 14 (15.9%) | 6 (6.4%) |
| 75 to 79 Years | 7 (8.0%) | 10 (10.6%) |
| 80 to 84 Years | 3 (3.4%) | 0 (0.0%) |
| 85 Years and over | 0 (0.0%) | 0 (0.0%) |
| Total | 88 (100.0%) | 94 (100.0%) |
Families and Households in Riverdale
Median Family Size in Riverdale
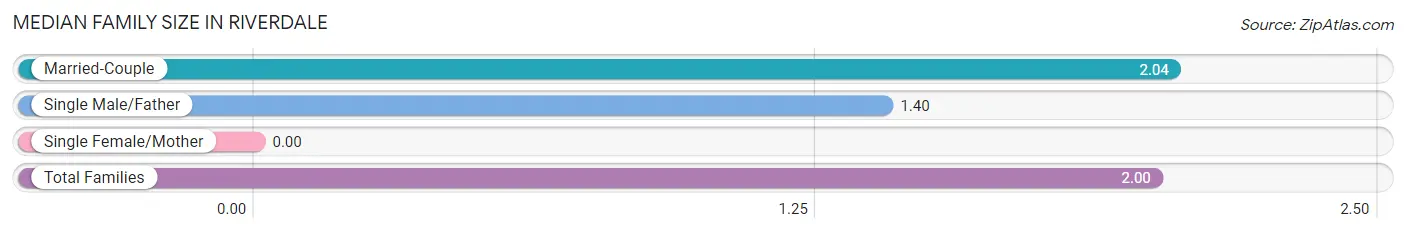
| Family Type | # Families | Family Size |
| Married-Couple | 72 (93.5%) | 2.04 |
| Single Male/Father | 5 (6.5%) | 1.40 |
| Single Female/Mother | 0 (0.0%) | - |
| Total Families | 77 (100.0%) | 2.00 |
Median Household Size in Riverdale
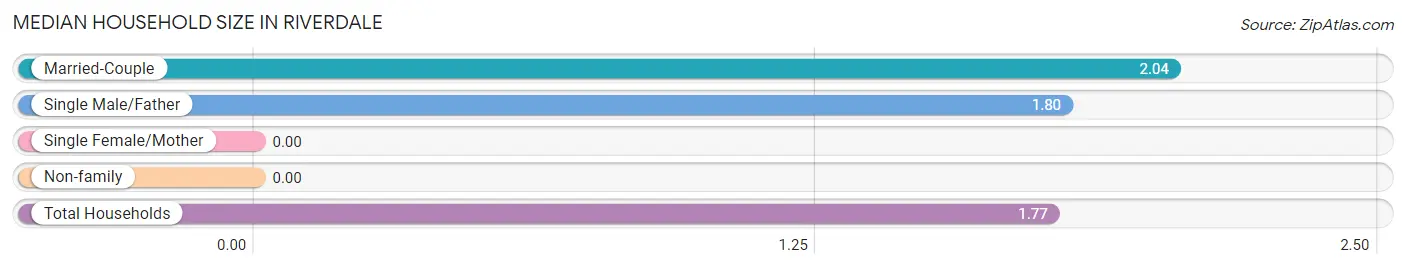
| Household Type | # Households | Household Size |
| Married-Couple | 72 (69.9%) | 2.04 |
| Single Male/Father | 5 (4.9%) | 1.80 |
| Single Female/Mother | 0 (0.0%) | - |
| Non-family | 26 (25.2%) | - |
| Total Households | 103 (100.0%) | 1.77 |
Household Size by Marriage Status in Riverdale
Out of a total of 103 households in Riverdale, 77 (74.8%) are family households, while 26 (25.2%) are nonfamily households. The most numerous type of family households are 2-person households, comprising 64, and the most common type of nonfamily households are 1-person households, comprising 26.
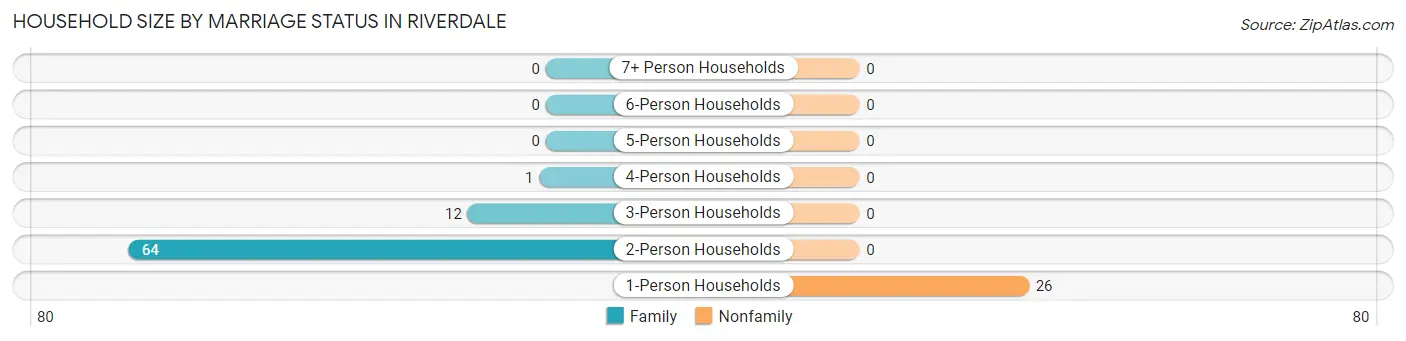
| Household Size | Family Households | Nonfamily Households |
| 1-Person Households | - | 26 (25.2%) |
| 2-Person Households | 64 (62.1%) | 0 (0.0%) |
| 3-Person Households | 12 (11.7%) | 0 (0.0%) |
| 4-Person Households | 1 (1.0%) | 0 (0.0%) |
| 5-Person Households | 0 (0.0%) | 0 (0.0%) |
| 6-Person Households | 0 (0.0%) | 0 (0.0%) |
| 7+ Person Households | 0 (0.0%) | 0 (0.0%) |
| Total | 77 (74.8%) | 26 (25.2%) |
Female Fertility in Riverdale
Fertility by Age in Riverdale
| Age Bracket | Women with Births | Births / 1,000 Women |
| 15 to 19 years | 0 (0.0%) | 0.0 |
| 20 to 34 years | 0 (0.0%) | 0.0 |
| 35 to 50 years | 0 (0.0%) | 0.0 |
| Total | 0 (0.0%) | 0.0 |
Fertility by Age by Marriage Status in Riverdale
| Age Bracket | Married | Unmarried |
| 15 to 19 years | 0 (0.0%) | 0 (0.0%) |
| 20 to 34 years | 0 (0.0%) | 0 (0.0%) |
| 35 to 50 years | 0 (0.0%) | 0 (0.0%) |
| Total | 0 (0.0%) | 0 (0.0%) |
Fertility by Education in Riverdale
| Educational Attainment | Women with Births | Births / 1,000 Women |
| Less than High School | 0 (0.0%) | 0.0 |
| High School Diploma | 0 (0.0%) | 0.0 |
| College or Associate's Degree | 0 (0.0%) | 0.0 |
| Bachelor's Degree | 0 (0.0%) | 0.0 |
| Graduate Degree | 0 (0.0%) | 0.0 |
| Total | 0 (0.0%) | 0.0 |
Fertility by Education by Marriage Status in Riverdale
| Educational Attainment | Married | Unmarried |
| Less than High School | 0 (0.0%) | 0 (0.0%) |
| High School Diploma | 0 (0.0%) | 0 (0.0%) |
| College or Associate's Degree | 0 (0.0%) | 0 (0.0%) |
| Bachelor's Degree | 0 (0.0%) | 0 (0.0%) |
| Graduate Degree | 0 (0.0%) | 0 (0.0%) |
| Total | 0 (0.0%) | 0 (0.0%) |
Income in Riverdale
Income Overview in Riverdale
Per Capita Income in Riverdale is $58,265, while median incomes of families and households are $101,750 and $86,250 respectively.
| Characteristic | Number | Measure |
| Per Capita Income | 182 | $58,265 |
| Median Family Income | 77 | $101,750 |
| Mean Family Income | 77 | $123,417 |
| Median Household Income | 103 | $86,250 |
| Mean Household Income | 103 | $106,005 |
| Income Deficit | 77 | $0 |
| Wage / Income Gap (%) | 182 | 31.58% |
| Wage / Income Gap ($) | 182 | 68.42¢ per $1 |
| Gini / Inequality Index | 182 | 0.38 |
Earnings by Sex in Riverdale
Average Earnings in Riverdale are $39,474, $56,250 for men and $38,487 for women, a difference of 31.6%.
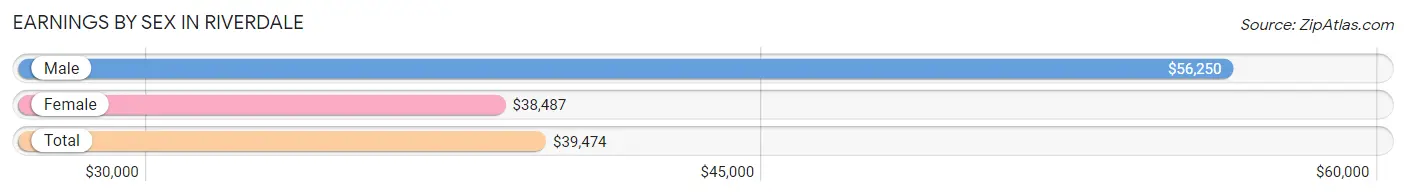
| Sex | Number | Average Earnings |
| Male | 55 (52.9%) | $56,250 |
| Female | 49 (47.1%) | $38,487 |
| Total | 104 (100.0%) | $39,474 |
Earnings by Sex by Income Bracket in Riverdale
The most common earnings brackets in Riverdale are $100,000+ for men (19 | 34.5%) and $35,000 to $39,999 for women (19 | 38.8%).
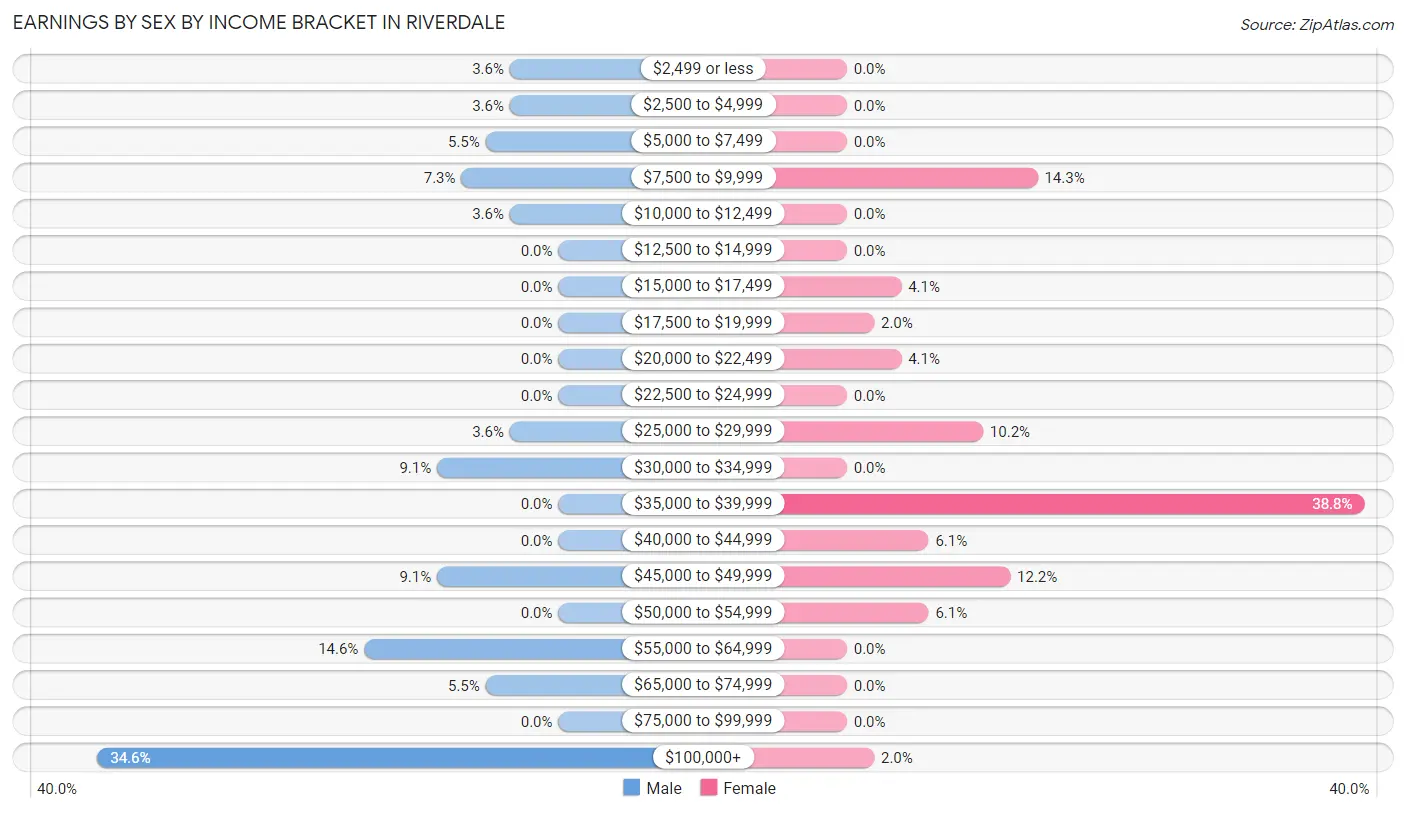
| Income | Male | Female |
| $2,499 or less | 2 (3.6%) | 0 (0.0%) |
| $2,500 to $4,999 | 2 (3.6%) | 0 (0.0%) |
| $5,000 to $7,499 | 3 (5.4%) | 0 (0.0%) |
| $7,500 to $9,999 | 4 (7.3%) | 7 (14.3%) |
| $10,000 to $12,499 | 2 (3.6%) | 0 (0.0%) |
| $12,500 to $14,999 | 0 (0.0%) | 0 (0.0%) |
| $15,000 to $17,499 | 0 (0.0%) | 2 (4.1%) |
| $17,500 to $19,999 | 0 (0.0%) | 1 (2.0%) |
| $20,000 to $22,499 | 0 (0.0%) | 2 (4.1%) |
| $22,500 to $24,999 | 0 (0.0%) | 0 (0.0%) |
| $25,000 to $29,999 | 2 (3.6%) | 5 (10.2%) |
| $30,000 to $34,999 | 5 (9.1%) | 0 (0.0%) |
| $35,000 to $39,999 | 0 (0.0%) | 19 (38.8%) |
| $40,000 to $44,999 | 0 (0.0%) | 3 (6.1%) |
| $45,000 to $49,999 | 5 (9.1%) | 6 (12.2%) |
| $50,000 to $54,999 | 0 (0.0%) | 3 (6.1%) |
| $55,000 to $64,999 | 8 (14.5%) | 0 (0.0%) |
| $65,000 to $74,999 | 3 (5.4%) | 0 (0.0%) |
| $75,000 to $99,999 | 0 (0.0%) | 0 (0.0%) |
| $100,000+ | 19 (34.5%) | 1 (2.0%) |
| Total | 55 (100.0%) | 49 (100.0%) |
Earnings by Sex by Educational Attainment in Riverdale
Average earnings in Riverdale are $56,750 for men and $38,487 for women, a difference of 32.2%. Men with an educational attainment of college or associate's degree enjoy the highest average annual earnings of $128,125, while those with graduate degree education earn the least with $31,250. Women with an educational attainment of bachelor's degree earn the most with the average annual earnings of $38,929, while those with high school diploma education have the smallest earnings of $26,500.
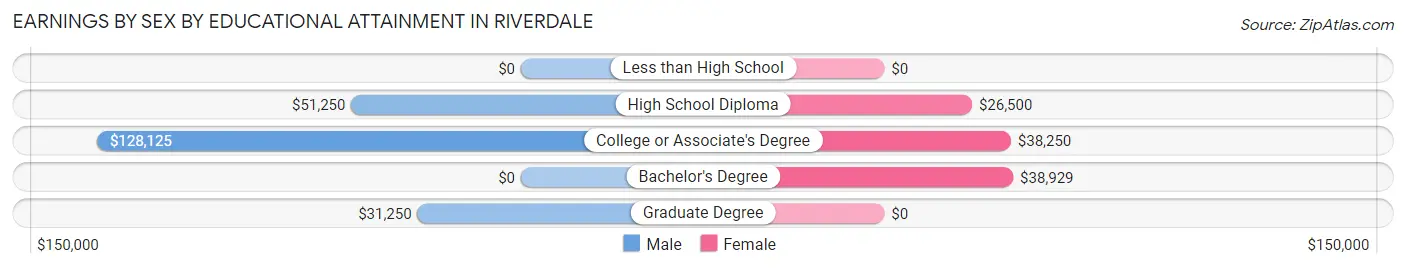
| Educational Attainment | Male Income | Female Income |
| Less than High School | - | - |
| High School Diploma | $51,250 | $26,500 |
| College or Associate's Degree | $128,125 | $38,250 |
| Bachelor's Degree | - | - |
| Graduate Degree | $31,250 | $0 |
| Total | $56,750 | $38,487 |
Family Income in Riverdale
Family Income Brackets in Riverdale
According to the Riverdale family income data, there are 23 families falling into the $100,000 to $149,999 income range, which is the most common income bracket and makes up 29.9% of all families.
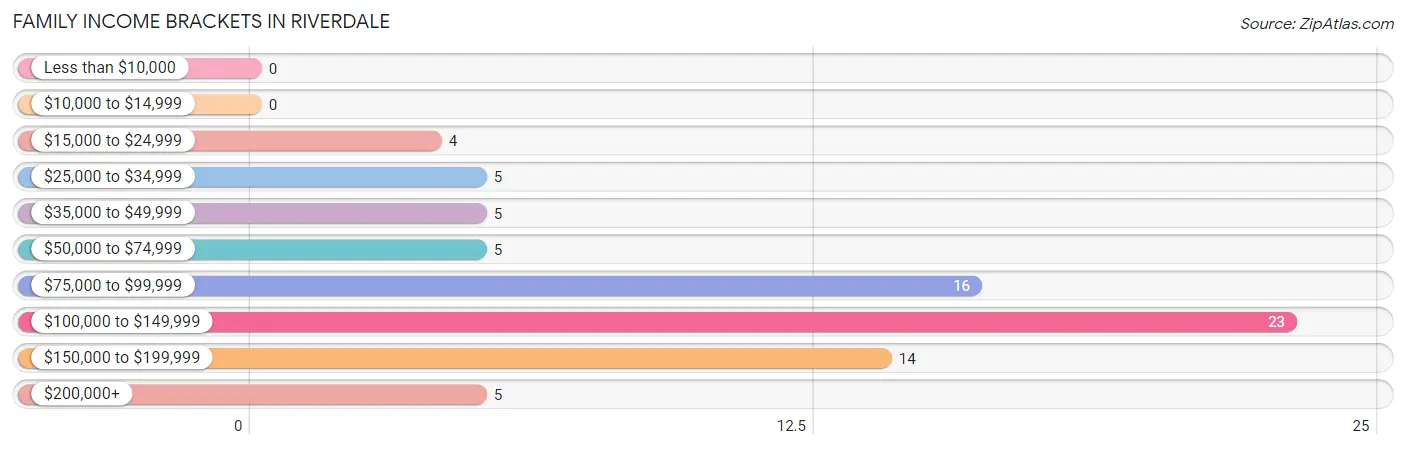
| Income Bracket | # Families | % Families |
| Less than $10,000 | 0 | 0.0% |
| $10,000 to $14,999 | 0 | 0.0% |
| $15,000 to $24,999 | 4 | 5.2% |
| $25,000 to $34,999 | 5 | 6.5% |
| $35,000 to $49,999 | 5 | 6.5% |
| $50,000 to $74,999 | 5 | 6.5% |
| $75,000 to $99,999 | 16 | 20.8% |
| $100,000 to $149,999 | 23 | 29.9% |
| $150,000 to $199,999 | 14 | 18.2% |
| $200,000+ | 5 | 6.5% |
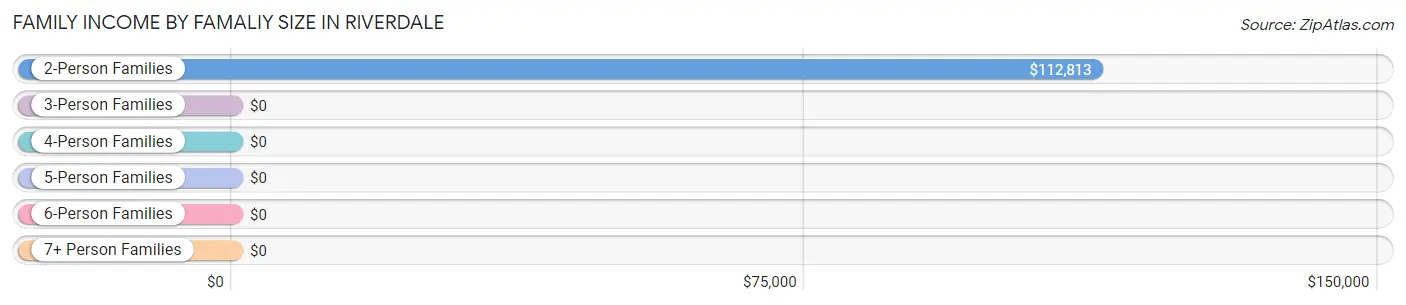
Family Income by Famaliy Size in Riverdale
2-person families (69 | 89.6%) account for the highest median family income in Riverdale with $112,813 per family, while 2-person families (69 | 89.6%) have the highest median income of $56,406 per family member.
| Income Bracket | # Families | Median Income |
| 2-Person Families | 69 (89.6%) | $112,813 |
| 3-Person Families | 7 (9.1%) | $0 |
| 4-Person Families | 1 (1.3%) | $0 |
| 5-Person Families | 0 (0.0%) | $0 |
| 6-Person Families | 0 (0.0%) | $0 |
| 7+ Person Families | 0 (0.0%) | $0 |
| Total | 77 (100.0%) | $101,750 |
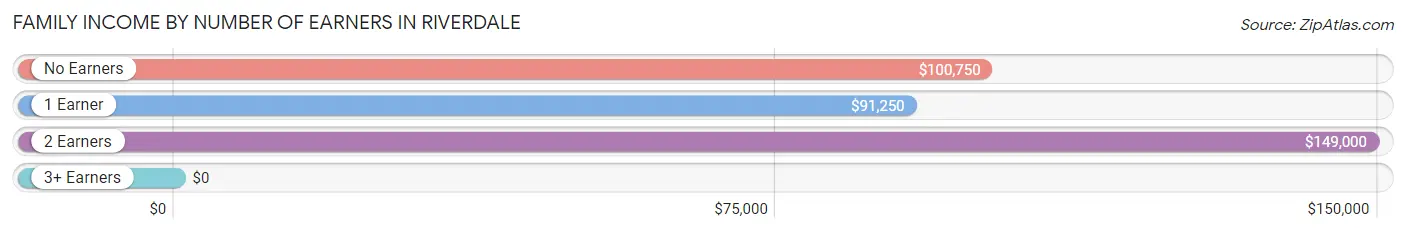
Family Income by Number of Earners in Riverdale
| Number of Earners | # Families | Median Income |
| No Earners | 25 (32.5%) | $100,750 |
| 1 Earner | 18 (23.4%) | $91,250 |
| 2 Earners | 32 (41.6%) | $149,000 |
| 3+ Earners | 2 (2.6%) | $0 |
| Total | 77 (100.0%) | $101,750 |
Household Income in Riverdale
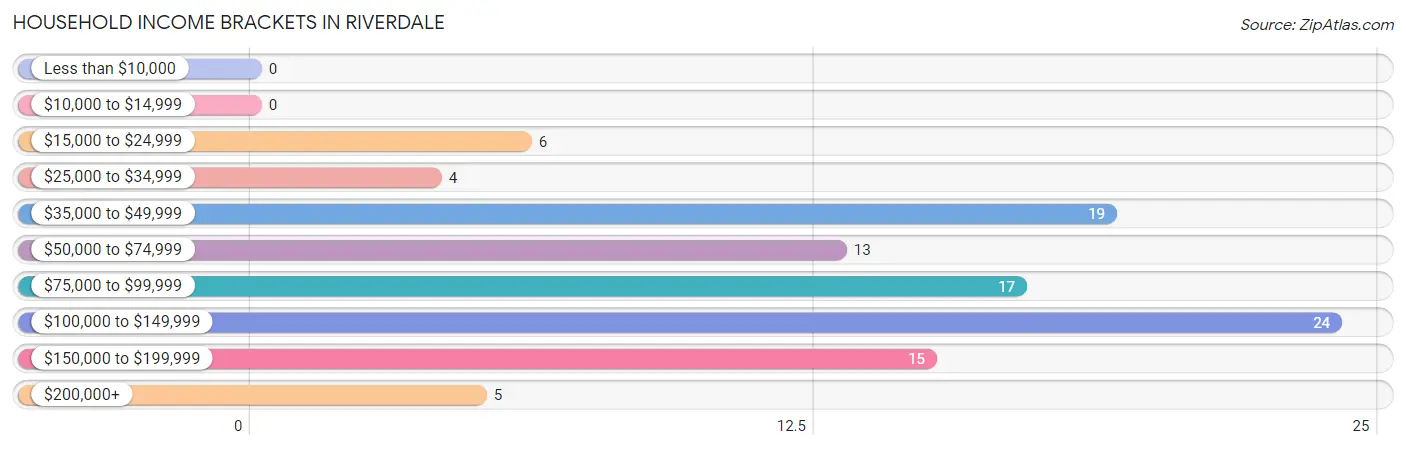
Household Income Brackets in Riverdale
With 24 households falling in the category, the $100,000 to $149,999 income range is the most frequent in Riverdale, accounting for 23.3% of all households.
| Income Bracket | # Households | % Households |
| Less than $10,000 | 0 | 0.0% |
| $10,000 to $14,999 | 0 | 0.0% |
| $15,000 to $24,999 | 6 | 5.8% |
| $25,000 to $34,999 | 4 | 3.9% |
| $35,000 to $49,999 | 19 | 18.4% |
| $50,000 to $74,999 | 13 | 12.6% |
| $75,000 to $99,999 | 17 | 16.5% |
| $100,000 to $149,999 | 24 | 23.3% |
| $150,000 to $199,999 | 15 | 14.6% |
| $200,000+ | 5 | 4.9% |
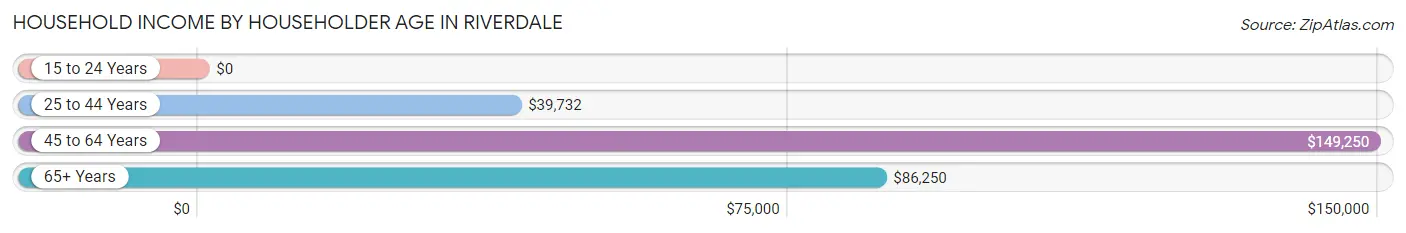
Household Income by Householder Age in Riverdale
The median household income in Riverdale is $86,250, with the highest median household income of $149,250 found in the 45 to 64 years age bracket for the primary householder. A total of 33 households (32.0%) fall into this category.
| Income Bracket | # Households | Median Income |
| 15 to 24 Years | 0 (0.0%) | $0 |
| 25 to 44 Years | 25 (24.3%) | $39,732 |
| 45 to 64 Years | 33 (32.0%) | $149,250 |
| 65+ Years | 45 (43.7%) | $86,250 |
| Total | 103 (100.0%) | $86,250 |
Poverty in Riverdale
Income Below Poverty by Sex and Age in Riverdale
With 6.8% poverty level for males and 4.3% for females among the residents of Riverdale, 18 to 24 year old males and 45 to 54 year old females are the most vulnerable to poverty, with 2 males (100.0%) and 2 females (28.6%) in their respective age groups living below the poverty level.
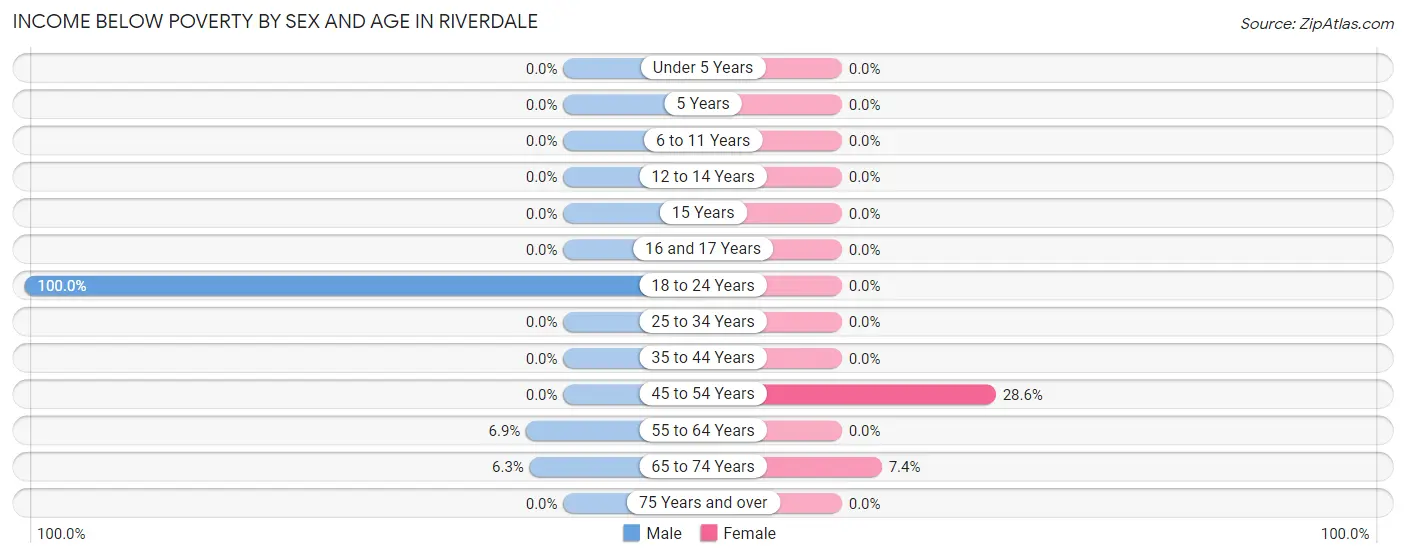
| Age Bracket | Male | Female |
| Under 5 Years | 0 (0.0%) | 0 (0.0%) |
| 5 Years | 0 (0.0%) | 0 (0.0%) |
| 6 to 11 Years | 0 (0.0%) | 0 (0.0%) |
| 12 to 14 Years | 0 (0.0%) | 0 (0.0%) |
| 15 Years | 0 (0.0%) | 0 (0.0%) |
| 16 and 17 Years | 0 (0.0%) | 0 (0.0%) |
| 18 to 24 Years | 2 (100.0%) | 0 (0.0%) |
| 25 to 34 Years | 0 (0.0%) | 0 (0.0%) |
| 35 to 44 Years | 0 (0.0%) | 0 (0.0%) |
| 45 to 54 Years | 0 (0.0%) | 2 (28.6%) |
| 55 to 64 Years | 2 (6.9%) | 0 (0.0%) |
| 65 to 74 Years | 2 (6.2%) | 2 (7.4%) |
| 75 Years and over | 0 (0.0%) | 0 (0.0%) |
| Total | 6 (6.8%) | 4 (4.3%) |
Income Above Poverty by Sex and Age in Riverdale
According to the poverty statistics in Riverdale, males aged 15 years and females aged under 5 years are the age groups that are most secure financially, with 100.0% of males and 100.0% of females in these age groups living above the poverty line.
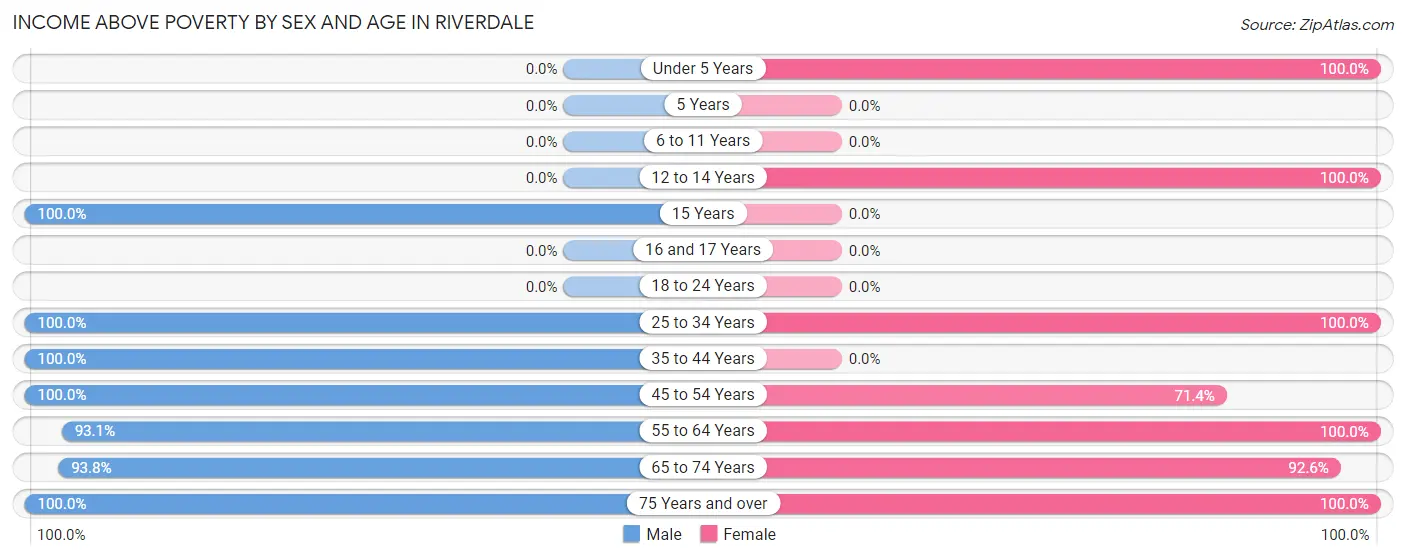
| Age Bracket | Male | Female |
| Under 5 Years | 0 (0.0%) | 5 (100.0%) |
| 5 Years | 0 (0.0%) | 0 (0.0%) |
| 6 to 11 Years | 0 (0.0%) | 0 (0.0%) |
| 12 to 14 Years | 0 (0.0%) | 1 (100.0%) |
| 15 Years | 1 (100.0%) | 0 (0.0%) |
| 16 and 17 Years | 0 (0.0%) | 0 (0.0%) |
| 18 to 24 Years | 0 (0.0%) | 0 (0.0%) |
| 25 to 34 Years | 7 (100.0%) | 22 (100.0%) |
| 35 to 44 Years | 5 (100.0%) | 0 (0.0%) |
| 45 to 54 Years | 2 (100.0%) | 5 (71.4%) |
| 55 to 64 Years | 27 (93.1%) | 22 (100.0%) |
| 65 to 74 Years | 30 (93.8%) | 25 (92.6%) |
| 75 Years and over | 10 (100.0%) | 10 (100.0%) |
| Total | 82 (93.2%) | 90 (95.7%) |
Income Below Poverty Among Married-Couple Families in Riverdale
The poverty statistics for married-couple families in Riverdale show that 5.6% or 4 of the total 72 families live below the poverty line. Families with no children have the highest poverty rate of 6.1%, comprising of 4 families. On the other hand, families with 1 or 2 children have the lowest poverty rate of 0.0%, which includes 0 families.
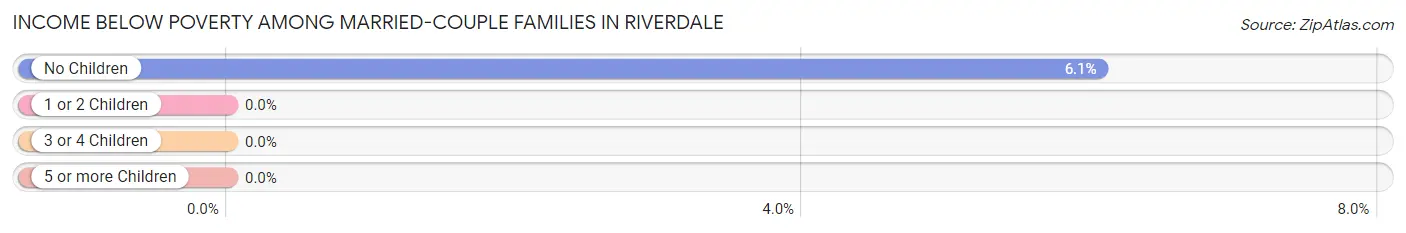
| Children | Above Poverty | Below Poverty |
| No Children | 62 (93.9%) | 4 (6.1%) |
| 1 or 2 Children | 6 (100.0%) | 0 (0.0%) |
| 3 or 4 Children | 0 (0.0%) | 0 (0.0%) |
| 5 or more Children | 0 (0.0%) | 0 (0.0%) |
| Total | 68 (94.4%) | 4 (5.6%) |
Income Below Poverty Among Single-Parent Households in Riverdale
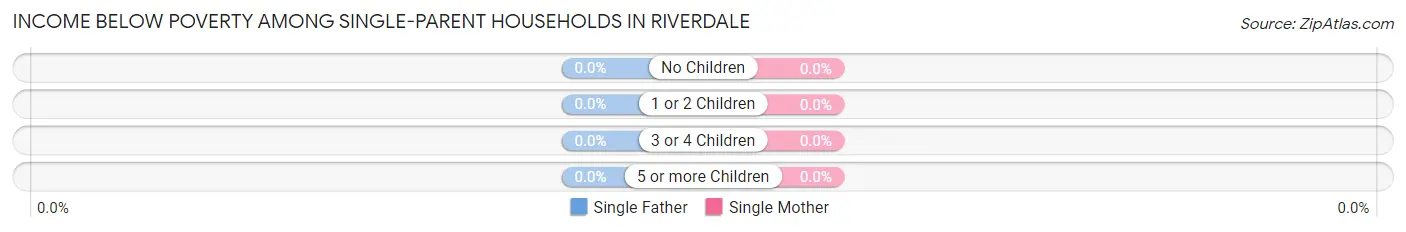
| Children | Single Father | Single Mother |
| No Children | 0 (0.0%) | 0 (0.0%) |
| 1 or 2 Children | 0 (0.0%) | 0 (0.0%) |
| 3 or 4 Children | 0 (0.0%) | 0 (0.0%) |
| 5 or more Children | 0 (0.0%) | 0 (0.0%) |
| Total | 0 (0.0%) | 0 (0.0%) |
Income Below Poverty Among Married-Couple vs Single-Parent Households in Riverdale
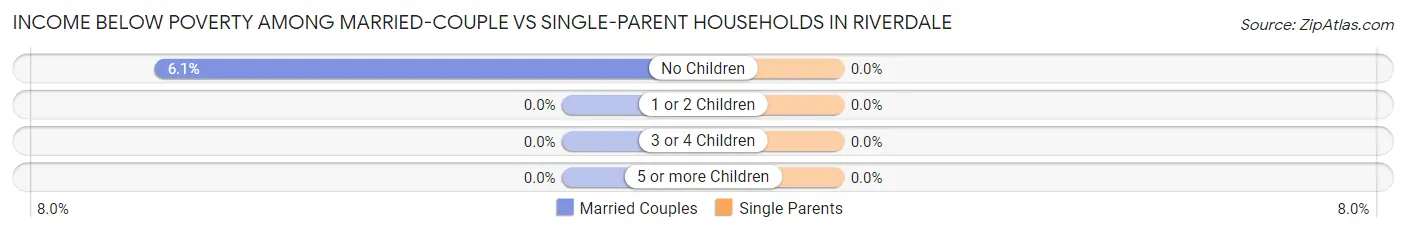
| Children | Married-Couple Families | Single-Parent Households |
| No Children | 4 (6.1%) | 0 (0.0%) |
| 1 or 2 Children | 0 (0.0%) | 0 (0.0%) |
| 3 or 4 Children | 0 (0.0%) | 0 (0.0%) |
| 5 or more Children | 0 (0.0%) | 0 (0.0%) |
| Total | 4 (5.6%) | 0 (0.0%) |
Employment Characteristics in Riverdale
Employment by Class of Employer in Riverdale
Among the 96 employed individuals in Riverdale, private company employees (55 | 57.3%), state government employees (20 | 20.8%), and local government employees (10 | 10.4%) make up the most common classes of employment.
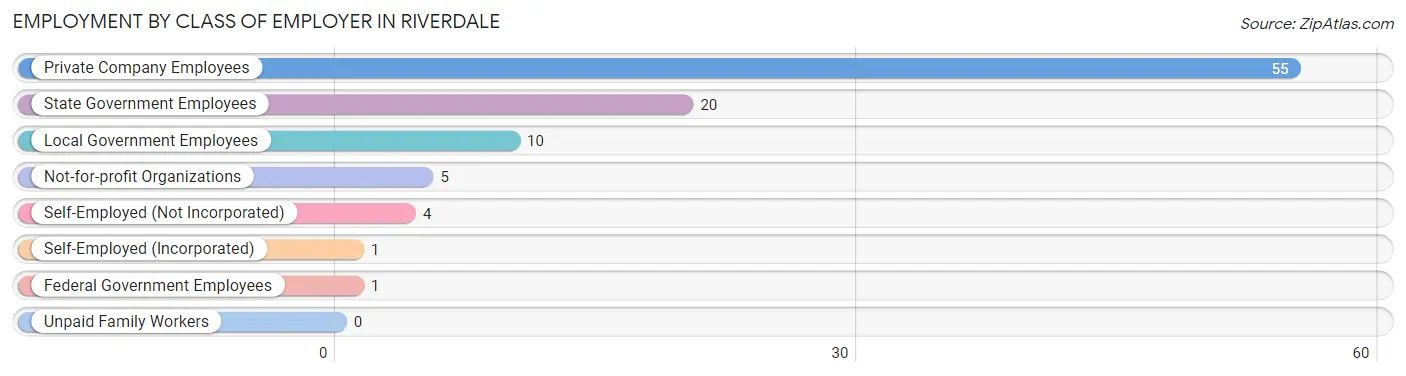
| Employer Class | # Employees | % Employees |
| Private Company Employees | 55 | 57.3% |
| Self-Employed (Incorporated) | 1 | 1.0% |
| Self-Employed (Not Incorporated) | 4 | 4.2% |
| Not-for-profit Organizations | 5 | 5.2% |
| Local Government Employees | 10 | 10.4% |
| State Government Employees | 20 | 20.8% |
| Federal Government Employees | 1 | 1.0% |
| Unpaid Family Workers | 0 | 0.0% |
| Total | 96 | 100.0% |
Employment Status by Age in Riverdale
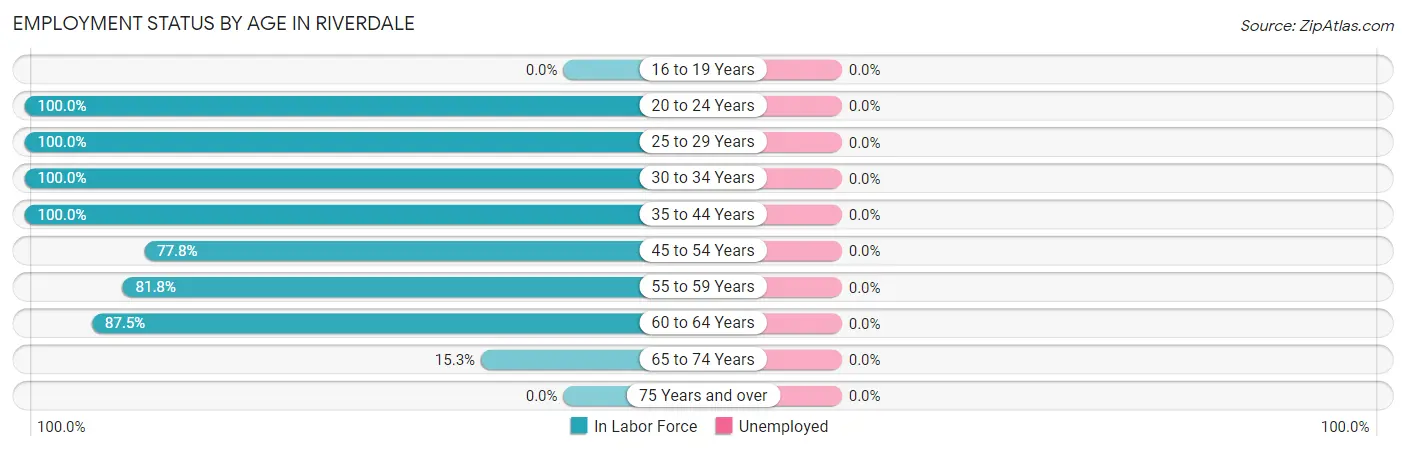
| Age Bracket | In Labor Force | Unemployed |
| 16 to 19 Years | 0 (0.0%) | 0 (0.0%) |
| 20 to 24 Years | 2 (100.0%) | 0 (0.0%) |
| 25 to 29 Years | 14 (100.0%) | 0 (0.0%) |
| 30 to 34 Years | 15 (100.0%) | 0 (0.0%) |
| 35 to 44 Years | 5 (100.0%) | 0 (0.0%) |
| 45 to 54 Years | 7 (77.8%) | 0 (0.0%) |
| 55 to 59 Years | 9 (81.8%) | 0 (0.0%) |
| 60 to 64 Years | 35 (87.5%) | 0 (0.0%) |
| 65 to 74 Years | 9 (15.3%) | 0 (0.0%) |
| 75 Years and over | 0 (0.0%) | 0 (0.0%) |
| Total | 96 (54.9%) | 0 (0.0%) |
Employment Status by Educational Attainment in Riverdale
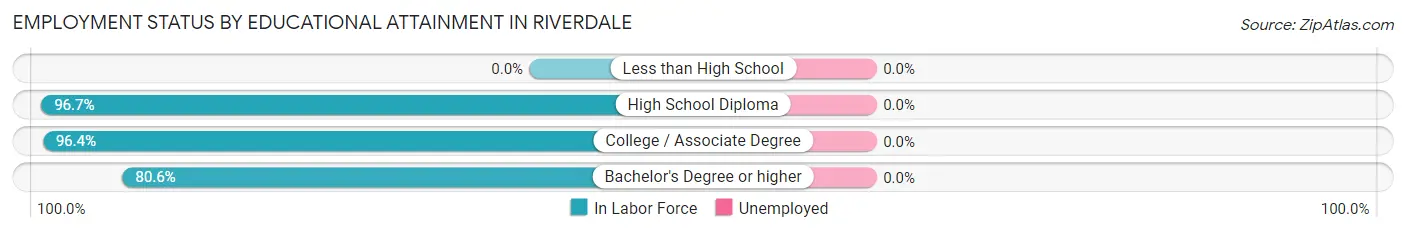
| Educational Attainment | In Labor Force | Unemployed |
| Less than High School | 0 (0.0%) | 0 (0.0%) |
| High School Diploma | 29 (96.7%) | 0 (0.0%) |
| College / Associate Degree | 27 (96.4%) | 0 (0.0%) |
| Bachelor's Degree or higher | 29 (80.6%) | 0 (0.0%) |
| Total | 85 (90.4%) | 0 (0.0%) |
Employment Occupations by Sex in Riverdale
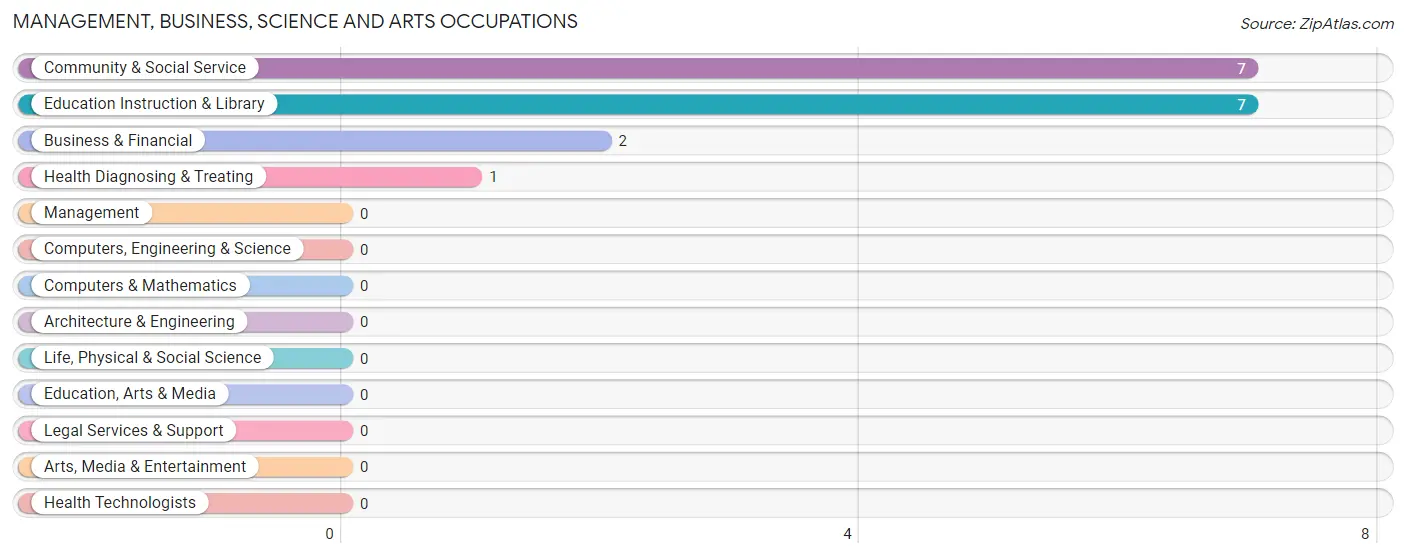
Management, Business, Science and Arts Occupations
The most common Management, Business, Science and Arts occupations in Riverdale are Community & Social Service (7 | 7.3%), Education Instruction & Library (7 | 7.3%), Business & Financial (2 | 2.1%), and Health Diagnosing & Treating (1 | 1.0%).
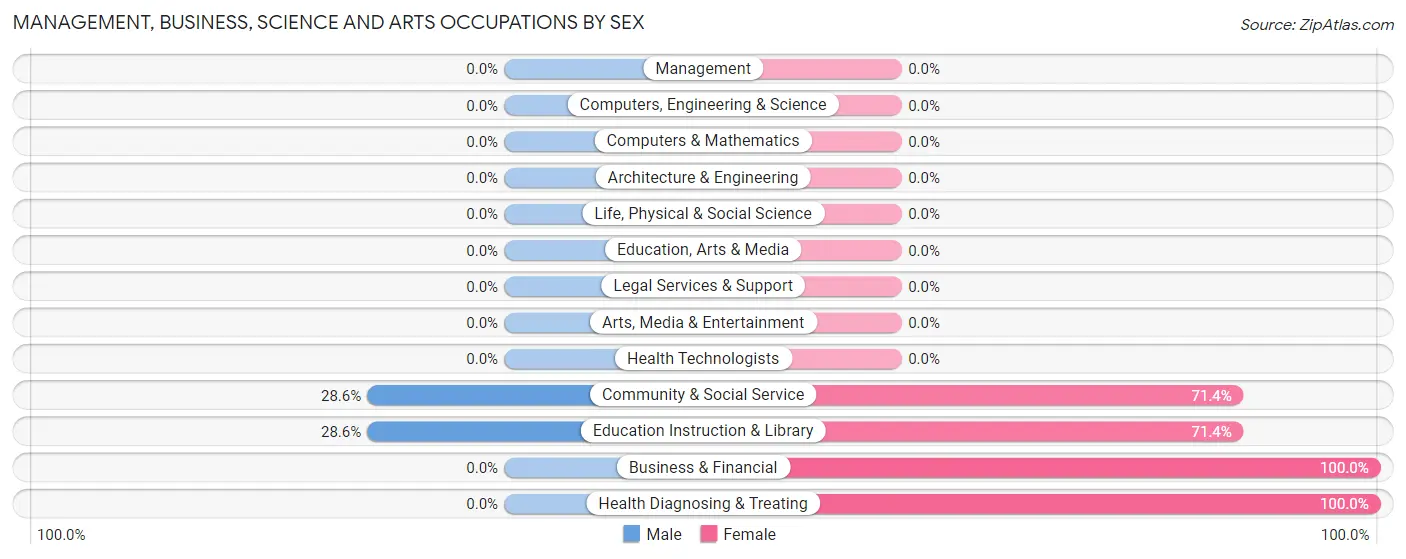
Management, Business, Science and Arts Occupations by Sex
Within the Management, Business, Science and Arts occupations in Riverdale, the most male-oriented occupations are Community & Social Service (28.6%), and Education Instruction & Library (28.6%), while the most female-oriented occupations are Business & Financial (100.0%), Health Diagnosing & Treating (100.0%), and Community & Social Service (71.4%).
| Occupation | Male | Female |
| Management | 0 (0.0%) | 0 (0.0%) |
| Business & Financial | 0 (0.0%) | 2 (100.0%) |
| Computers, Engineering & Science | 0 (0.0%) | 0 (0.0%) |
| Computers & Mathematics | 0 (0.0%) | 0 (0.0%) |
| Architecture & Engineering | 0 (0.0%) | 0 (0.0%) |
| Life, Physical & Social Science | 0 (0.0%) | 0 (0.0%) |
| Community & Social Service | 2 (28.6%) | 5 (71.4%) |
| Education, Arts & Media | 0 (0.0%) | 0 (0.0%) |
| Legal Services & Support | 0 (0.0%) | 0 (0.0%) |
| Education Instruction & Library | 2 (28.6%) | 5 (71.4%) |
| Arts, Media & Entertainment | 0 (0.0%) | 0 (0.0%) |
| Health Diagnosing & Treating | 0 (0.0%) | 1 (100.0%) |
| Health Technologists | 0 (0.0%) | 0 (0.0%) |
| Total (Category) | 2 (20.0%) | 8 (80.0%) |
| Total (Overall) | 49 (51.0%) | 47 (49.0%) |
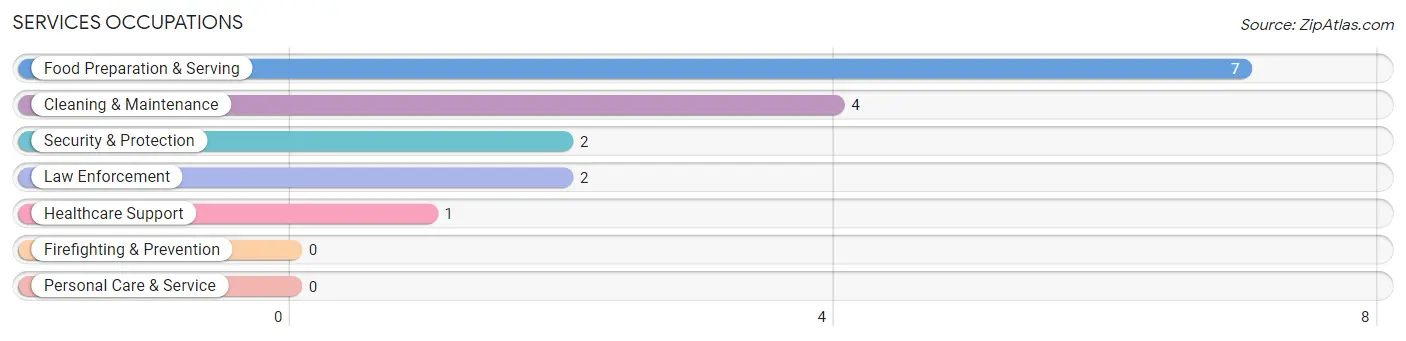
Services Occupations
The most common Services occupations in Riverdale are Food Preparation & Serving (7 | 7.3%), Cleaning & Maintenance (4 | 4.2%), Security & Protection (2 | 2.1%), Law Enforcement (2 | 2.1%), and Healthcare Support (1 | 1.0%).
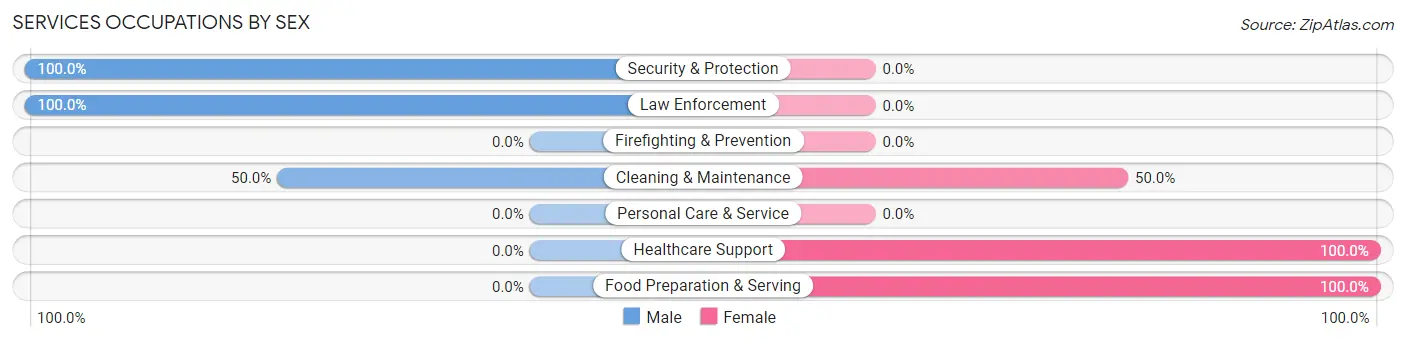
Services Occupations by Sex
Within the Services occupations in Riverdale, the most male-oriented occupations are Security & Protection (100.0%), Law Enforcement (100.0%), and Cleaning & Maintenance (50.0%), while the most female-oriented occupations are Healthcare Support (100.0%), Food Preparation & Serving (100.0%), and Cleaning & Maintenance (50.0%).
| Occupation | Male | Female |
| Healthcare Support | 0 (0.0%) | 1 (100.0%) |
| Security & Protection | 2 (100.0%) | 0 (0.0%) |
| Firefighting & Prevention | 0 (0.0%) | 0 (0.0%) |
| Law Enforcement | 2 (100.0%) | 0 (0.0%) |
| Food Preparation & Serving | 0 (0.0%) | 7 (100.0%) |
| Cleaning & Maintenance | 2 (50.0%) | 2 (50.0%) |
| Personal Care & Service | 0 (0.0%) | 0 (0.0%) |
| Total (Category) | 4 (28.6%) | 10 (71.4%) |
| Total (Overall) | 49 (51.0%) | 47 (49.0%) |
Sales and Office Occupations
The most common Sales and Office occupations in Riverdale are Office & Administration (32 | 33.3%), and Sales & Related (6 | 6.2%).
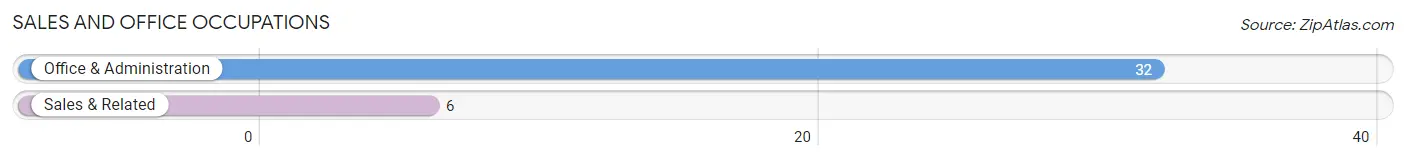
Sales and Office Occupations by Sex

| Occupation | Male | Female |
| Sales & Related | 1 (16.7%) | 5 (83.3%) |
| Office & Administration | 9 (28.1%) | 23 (71.9%) |
| Total (Category) | 10 (26.3%) | 28 (73.7%) |
| Total (Overall) | 49 (51.0%) | 47 (49.0%) |
Natural Resources, Construction and Maintenance Occupations
The most common Natural Resources, Construction and Maintenance occupations in Riverdale are Installation, Maintenance & Repair (16 | 16.7%), Construction & Extraction (8 | 8.3%), and Farming, Fishing & Forestry (2 | 2.1%).
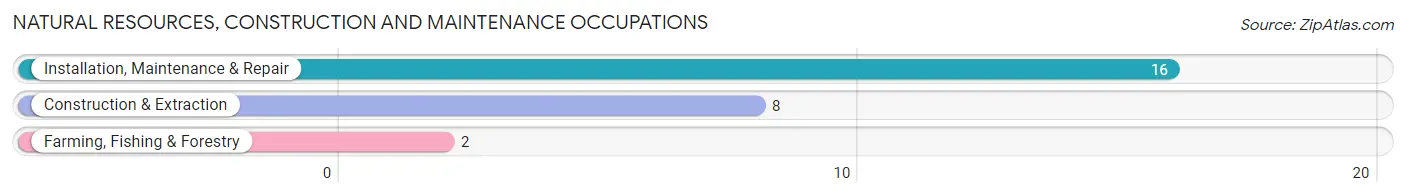
Natural Resources, Construction and Maintenance Occupations by Sex
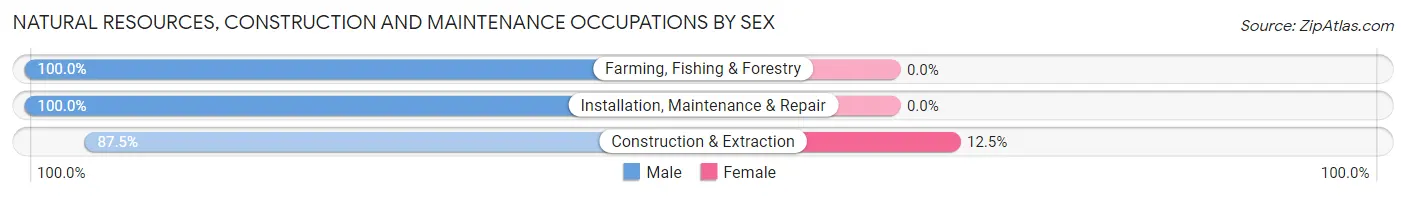
| Occupation | Male | Female |
| Farming, Fishing & Forestry | 2 (100.0%) | 0 (0.0%) |
| Construction & Extraction | 7 (87.5%) | 1 (12.5%) |
| Installation, Maintenance & Repair | 16 (100.0%) | 0 (0.0%) |
| Total (Category) | 25 (96.2%) | 1 (3.8%) |
| Total (Overall) | 49 (51.0%) | 47 (49.0%) |
Production, Transportation and Moving Occupations
The most common Production, Transportation and Moving occupations in Riverdale are Material Moving (6 | 6.2%), Production (1 | 1.0%), and Transportation (1 | 1.0%).
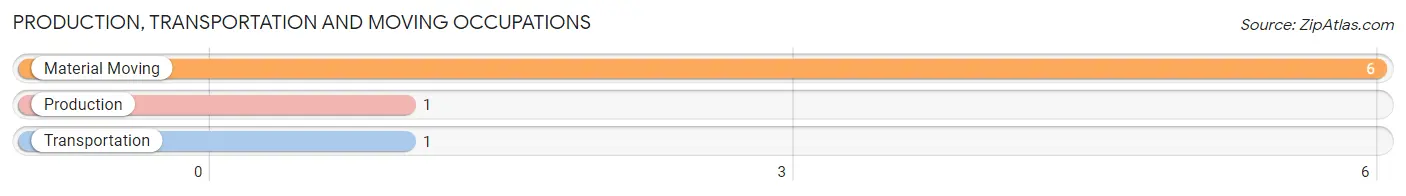
Production, Transportation and Moving Occupations by Sex
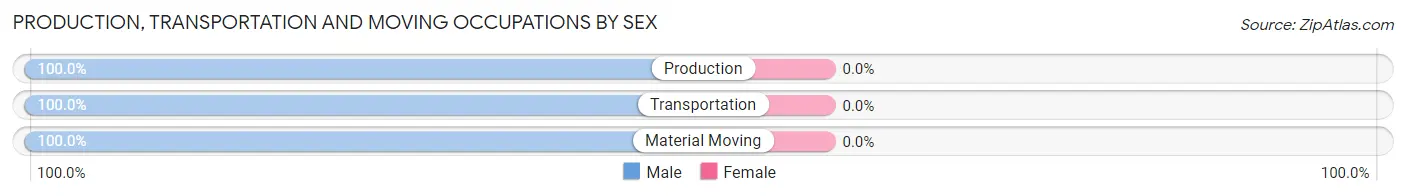
| Occupation | Male | Female |
| Production | 1 (100.0%) | 0 (0.0%) |
| Transportation | 1 (100.0%) | 0 (0.0%) |
| Material Moving | 6 (100.0%) | 0 (0.0%) |
| Total (Category) | 8 (100.0%) | 0 (0.0%) |
| Total (Overall) | 49 (51.0%) | 47 (49.0%) |
Employment Industries by Sex in Riverdale
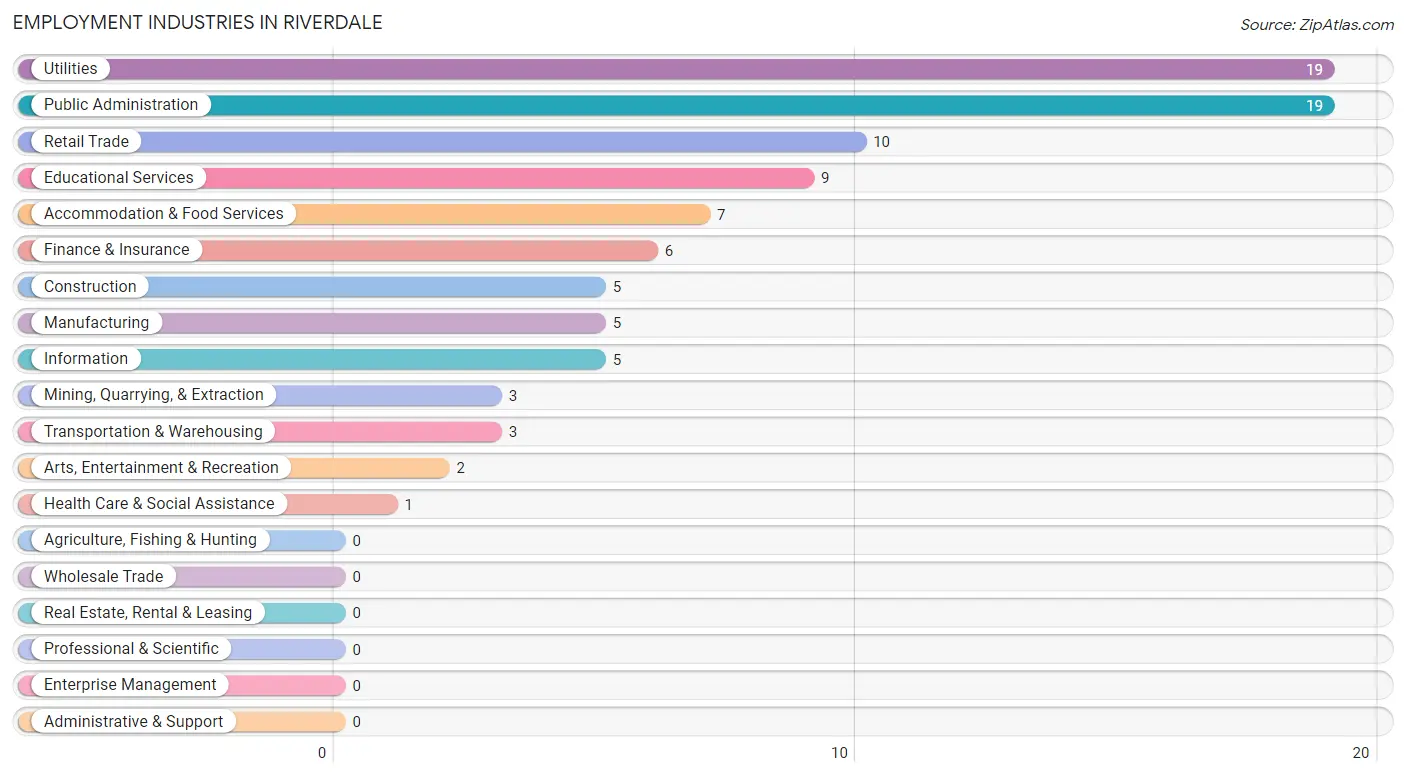
Employment Industries in Riverdale
The major employment industries in Riverdale include Utilities (19 | 19.8%), Public Administration (19 | 19.8%), Retail Trade (10 | 10.4%), Educational Services (9 | 9.4%), and Accommodation & Food Services (7 | 7.3%).
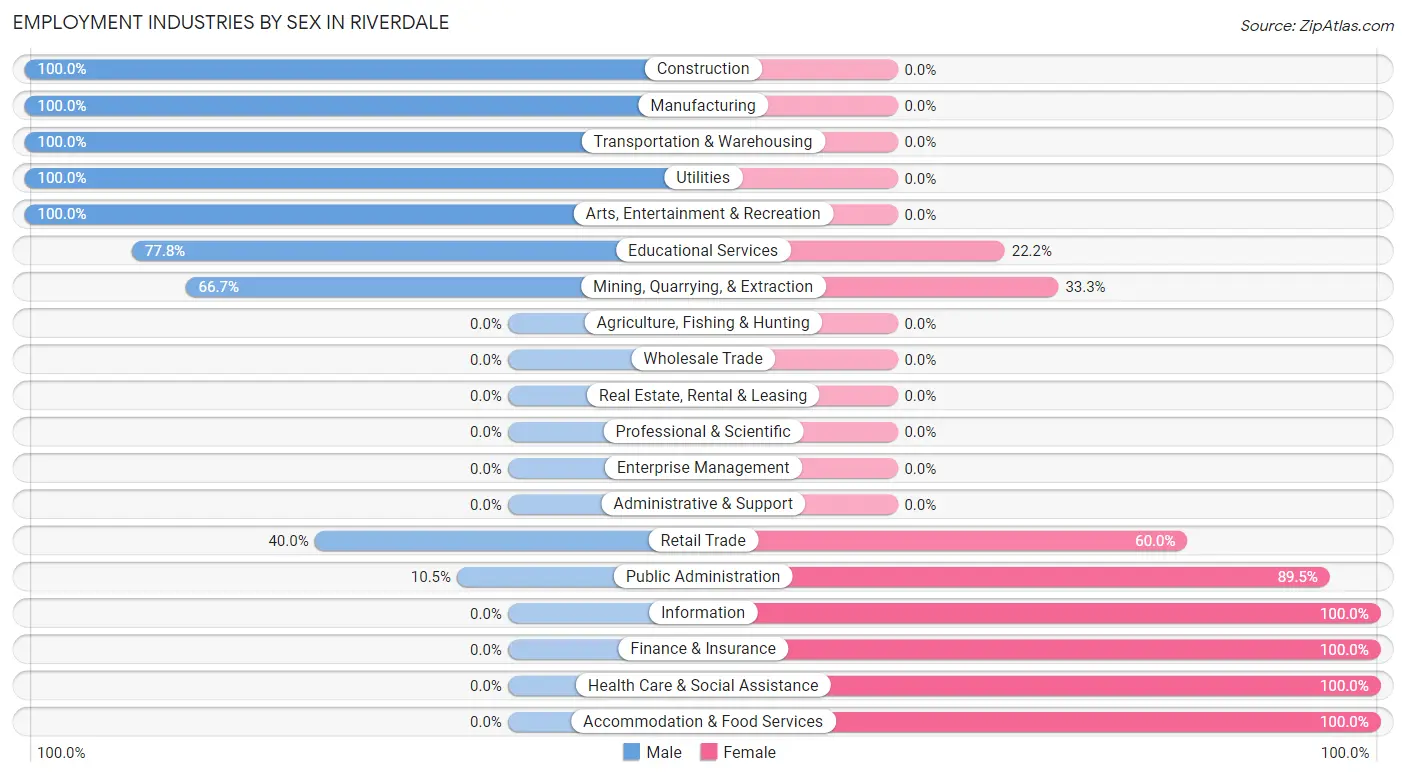
Employment Industries by Sex in Riverdale
The Riverdale industries that see more men than women are Construction (100.0%), Manufacturing (100.0%), and Transportation & Warehousing (100.0%), whereas the industries that tend to have a higher number of women are Information (100.0%), Finance & Insurance (100.0%), and Health Care & Social Assistance (100.0%).
| Industry | Male | Female |
| Agriculture, Fishing & Hunting | 0 (0.0%) | 0 (0.0%) |
| Mining, Quarrying, & Extraction | 2 (66.7%) | 1 (33.3%) |
| Construction | 5 (100.0%) | 0 (0.0%) |
| Manufacturing | 5 (100.0%) | 0 (0.0%) |
| Wholesale Trade | 0 (0.0%) | 0 (0.0%) |
| Retail Trade | 4 (40.0%) | 6 (60.0%) |
| Transportation & Warehousing | 3 (100.0%) | 0 (0.0%) |
| Utilities | 19 (100.0%) | 0 (0.0%) |
| Information | 0 (0.0%) | 5 (100.0%) |
| Finance & Insurance | 0 (0.0%) | 6 (100.0%) |
| Real Estate, Rental & Leasing | 0 (0.0%) | 0 (0.0%) |
| Professional & Scientific | 0 (0.0%) | 0 (0.0%) |
| Enterprise Management | 0 (0.0%) | 0 (0.0%) |
| Administrative & Support | 0 (0.0%) | 0 (0.0%) |
| Educational Services | 7 (77.8%) | 2 (22.2%) |
| Health Care & Social Assistance | 0 (0.0%) | 1 (100.0%) |
| Arts, Entertainment & Recreation | 2 (100.0%) | 0 (0.0%) |
| Accommodation & Food Services | 0 (0.0%) | 7 (100.0%) |
| Public Administration | 2 (10.5%) | 17 (89.5%) |
| Total | 49 (51.0%) | 47 (49.0%) |
Education in Riverdale
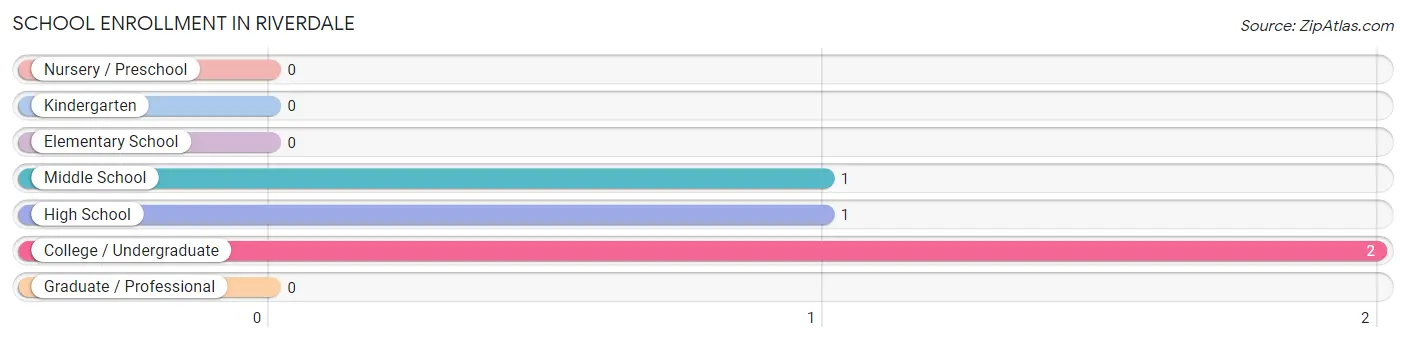
School Enrollment in Riverdale
The most common levels of schooling among the 4 students in Riverdale are college / undergraduate (2 | 50.0%), middle school (1 | 25.0%), and high school (1 | 25.0%).
| School Level | # Students | % Students |
| Nursery / Preschool | 0 | 0.0% |
| Kindergarten | 0 | 0.0% |
| Elementary School | 0 | 0.0% |
| Middle School | 1 | 25.0% |
| High School | 1 | 25.0% |
| College / Undergraduate | 2 | 50.0% |
| Graduate / Professional | 0 | 0.0% |
| Total | 4 | 100.0% |
School Enrollment by Age by Funding Source in Riverdale
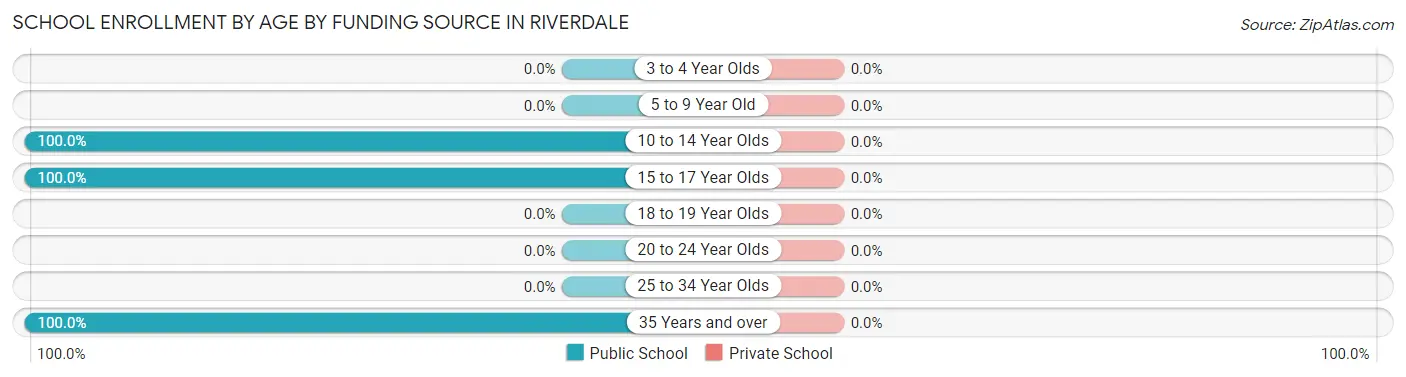
| Age Bracket | Public School | Private School |
| 3 to 4 Year Olds | 0 (0.0%) | 0 (0.0%) |
| 5 to 9 Year Old | 0 (0.0%) | 0 (0.0%) |
| 10 to 14 Year Olds | 1 (100.0%) | 0 (0.0%) |
| 15 to 17 Year Olds | 1 (100.0%) | 0 (0.0%) |
| 18 to 19 Year Olds | 0 (0.0%) | 0 (0.0%) |
| 20 to 24 Year Olds | 0 (0.0%) | 0 (0.0%) |
| 25 to 34 Year Olds | 0 (0.0%) | 0 (0.0%) |
| 35 Years and over | 2 (100.0%) | 0 (0.0%) |
| Total | 4 (100.0%) | 0 (0.0%) |
Educational Attainment by Field of Study in Riverdale
Bio, nature & agricultural (23 | 36.5%), education (10 | 15.9%), computers & mathematics (9 | 14.3%), science & technology (8 | 12.7%), and liberal arts & history (5 | 7.9%) are the most common fields of study among 63 individuals in Riverdale who have obtained a bachelor's degree or higher.
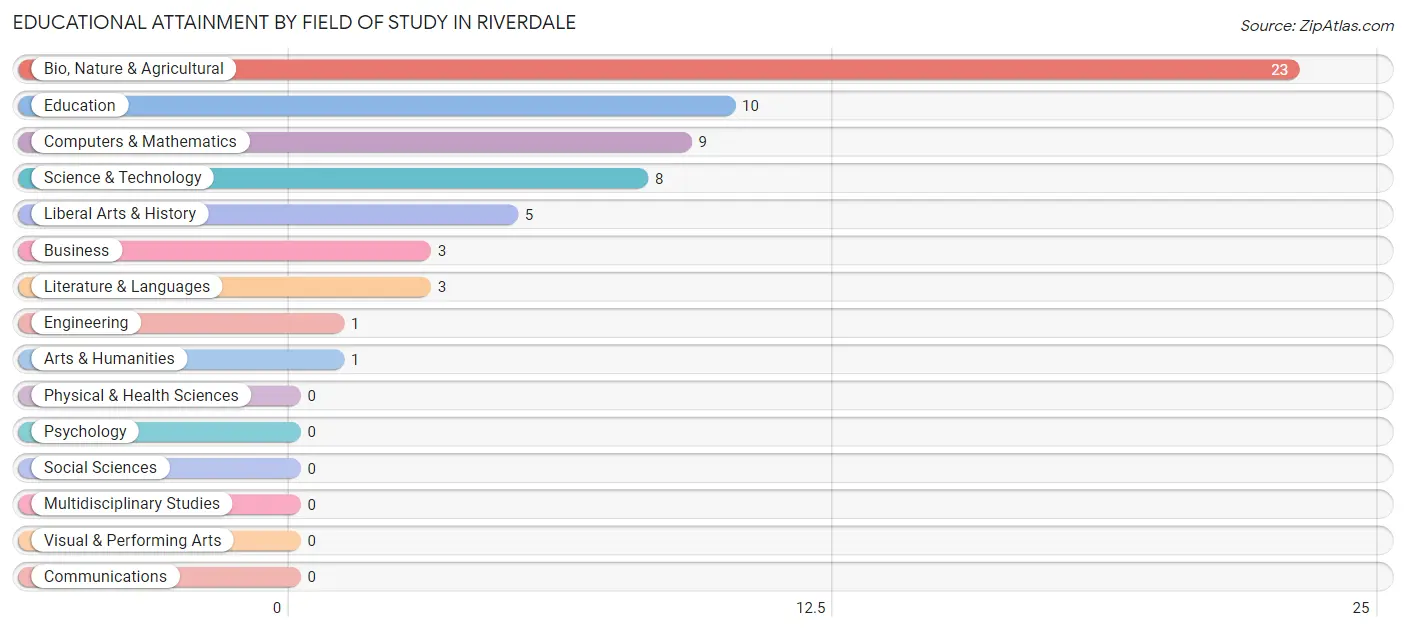
| Field of Study | # Graduates | % Graduates |
| Computers & Mathematics | 9 | 14.3% |
| Bio, Nature & Agricultural | 23 | 36.5% |
| Physical & Health Sciences | 0 | 0.0% |
| Psychology | 0 | 0.0% |
| Social Sciences | 0 | 0.0% |
| Engineering | 1 | 1.6% |
| Multidisciplinary Studies | 0 | 0.0% |
| Science & Technology | 8 | 12.7% |
| Business | 3 | 4.8% |
| Education | 10 | 15.9% |
| Literature & Languages | 3 | 4.8% |
| Liberal Arts & History | 5 | 7.9% |
| Visual & Performing Arts | 0 | 0.0% |
| Communications | 0 | 0.0% |
| Arts & Humanities | 1 | 1.6% |
| Total | 63 | 100.0% |
Transportation & Commute in Riverdale
Vehicle Availability by Sex in Riverdale
The most prevalent vehicle ownership categories in Riverdale are males with 3 vehicles (22, accounting for 44.9%) and females with 3 vehicles (13, making up 46.8%).
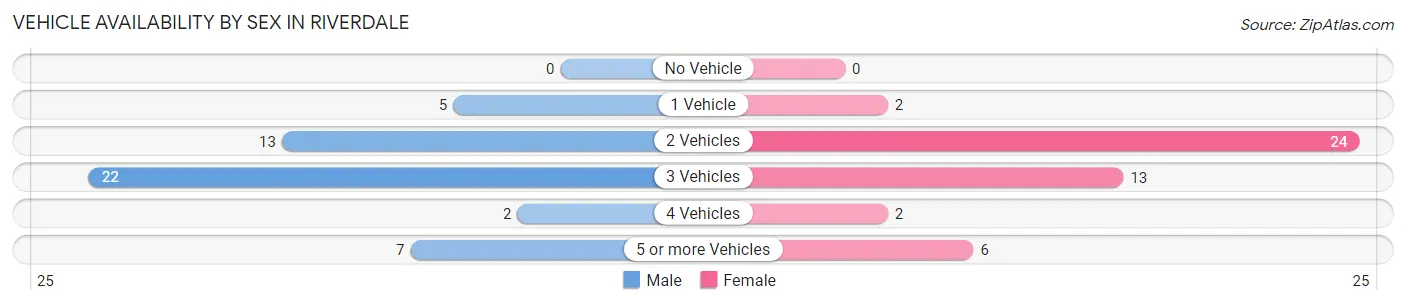
| Vehicles Available | Male | Female |
| No Vehicle | 0 (0.0%) | 0 (0.0%) |
| 1 Vehicle | 5 (10.2%) | 2 (4.3%) |
| 2 Vehicles | 13 (26.5%) | 24 (51.1%) |
| 3 Vehicles | 22 (44.9%) | 13 (27.7%) |
| 4 Vehicles | 2 (4.1%) | 2 (4.3%) |
| 5 or more Vehicles | 7 (14.3%) | 6 (12.8%) |
| Total | 49 (100.0%) | 47 (100.0%) |
Commute Time in Riverdale
The most frequently occuring commute durations in Riverdale are less than 5 minutes (31 commuters, 35.2%), 45 to 59 minutes (16 commuters, 18.2%), and 5 to 9 minutes (8 commuters, 9.1%).
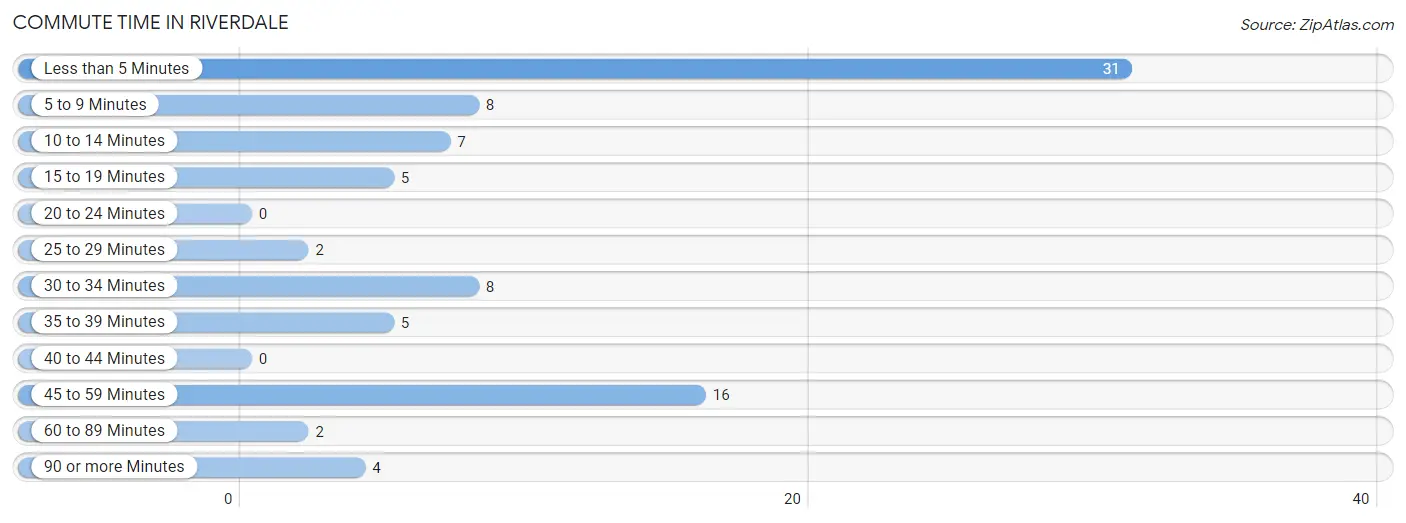
| Commute Time | # Commuters | % Commuters |
| Less than 5 Minutes | 31 | 35.2% |
| 5 to 9 Minutes | 8 | 9.1% |
| 10 to 14 Minutes | 7 | 8.0% |
| 15 to 19 Minutes | 5 | 5.7% |
| 20 to 24 Minutes | 0 | 0.0% |
| 25 to 29 Minutes | 2 | 2.3% |
| 30 to 34 Minutes | 8 | 9.1% |
| 35 to 39 Minutes | 5 | 5.7% |
| 40 to 44 Minutes | 0 | 0.0% |
| 45 to 59 Minutes | 16 | 18.2% |
| 60 to 89 Minutes | 2 | 2.3% |
| 90 or more Minutes | 4 | 4.5% |
Commute Time by Sex in Riverdale
The most common commute times in Riverdale are 45 to 59 minutes (14 commuters, 29.8%) for males and less than 5 minutes (19 commuters, 46.3%) for females.
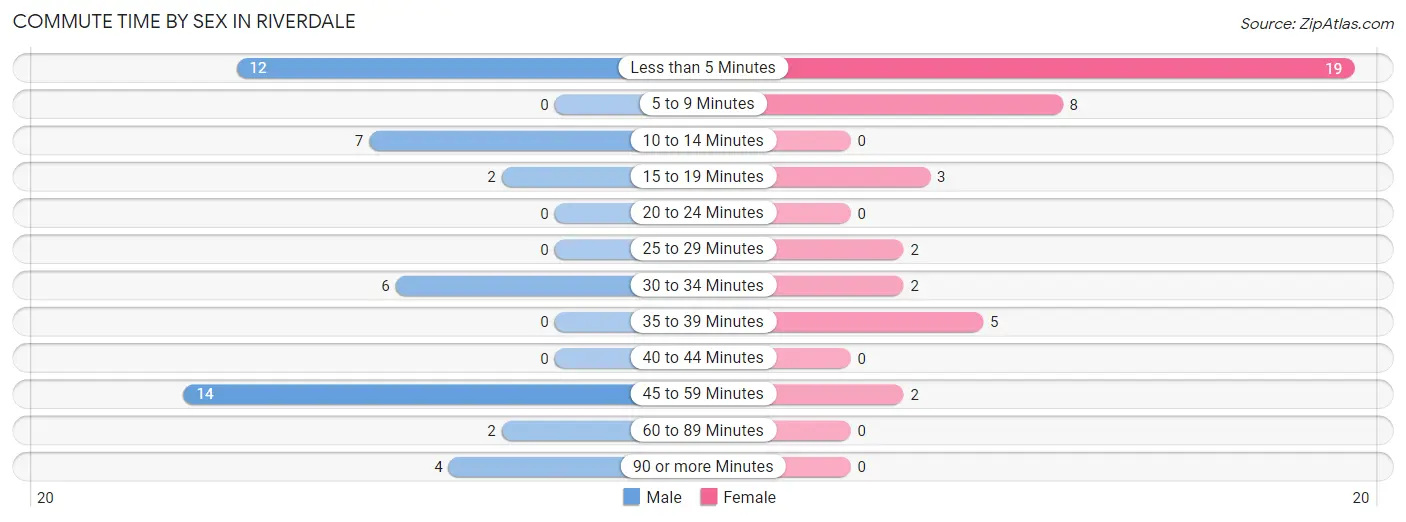
| Commute Time | Male | Female |
| Less than 5 Minutes | 12 (25.5%) | 19 (46.3%) |
| 5 to 9 Minutes | 0 (0.0%) | 8 (19.5%) |
| 10 to 14 Minutes | 7 (14.9%) | 0 (0.0%) |
| 15 to 19 Minutes | 2 (4.3%) | 3 (7.3%) |
| 20 to 24 Minutes | 0 (0.0%) | 0 (0.0%) |
| 25 to 29 Minutes | 0 (0.0%) | 2 (4.9%) |
| 30 to 34 Minutes | 6 (12.8%) | 2 (4.9%) |
| 35 to 39 Minutes | 0 (0.0%) | 5 (12.2%) |
| 40 to 44 Minutes | 0 (0.0%) | 0 (0.0%) |
| 45 to 59 Minutes | 14 (29.8%) | 2 (4.9%) |
| 60 to 89 Minutes | 2 (4.3%) | 0 (0.0%) |
| 90 or more Minutes | 4 (8.5%) | 0 (0.0%) |
Time of Departure to Work by Sex in Riverdale
The most frequent times of departure to work in Riverdale are 5:00 AM to 5:29 AM (17, 36.2%) for males and 7:30 AM to 7:59 AM (20, 48.8%) for females.
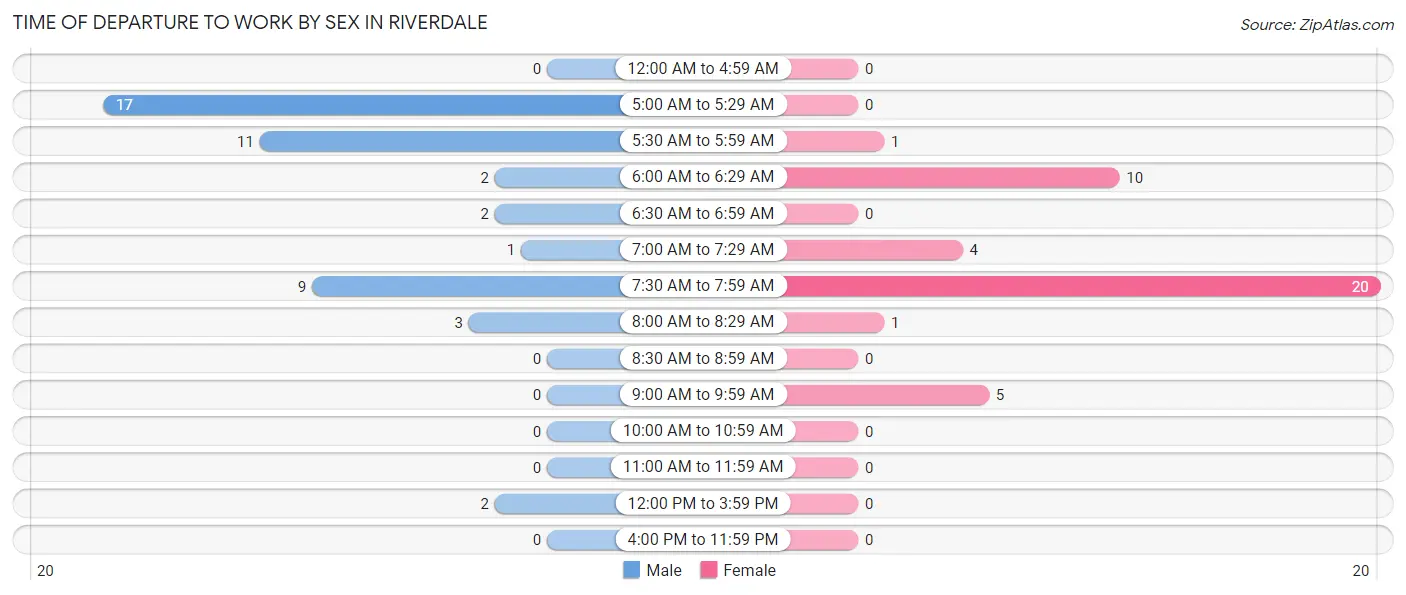
| Time of Departure | Male | Female |
| 12:00 AM to 4:59 AM | 0 (0.0%) | 0 (0.0%) |
| 5:00 AM to 5:29 AM | 17 (36.2%) | 0 (0.0%) |
| 5:30 AM to 5:59 AM | 11 (23.4%) | 1 (2.4%) |
| 6:00 AM to 6:29 AM | 2 (4.3%) | 10 (24.4%) |
| 6:30 AM to 6:59 AM | 2 (4.3%) | 0 (0.0%) |
| 7:00 AM to 7:29 AM | 1 (2.1%) | 4 (9.8%) |
| 7:30 AM to 7:59 AM | 9 (19.2%) | 20 (48.8%) |
| 8:00 AM to 8:29 AM | 3 (6.4%) | 1 (2.4%) |
| 8:30 AM to 8:59 AM | 0 (0.0%) | 0 (0.0%) |
| 9:00 AM to 9:59 AM | 0 (0.0%) | 5 (12.2%) |
| 10:00 AM to 10:59 AM | 0 (0.0%) | 0 (0.0%) |
| 11:00 AM to 11:59 AM | 0 (0.0%) | 0 (0.0%) |
| 12:00 PM to 3:59 PM | 2 (4.3%) | 0 (0.0%) |
| 4:00 PM to 11:59 PM | 0 (0.0%) | 0 (0.0%) |
| Total | 47 (100.0%) | 41 (100.0%) |
Housing Occupancy in Riverdale
Occupancy by Ownership in Riverdale
Of the total 103 dwellings in Riverdale, owner-occupied units account for 82 (79.6%), while renter-occupied units make up 21 (20.4%).
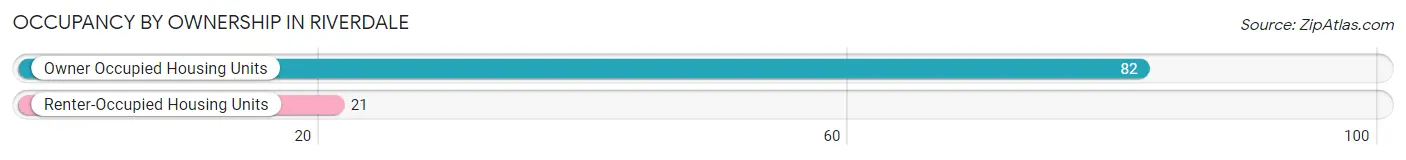
| Occupancy | # Housing Units | % Housing Units |
| Owner Occupied Housing Units | 82 | 79.6% |
| Renter-Occupied Housing Units | 21 | 20.4% |
| Total Occupied Housing Units | 103 | 100.0% |
Occupancy by Household Size in Riverdale
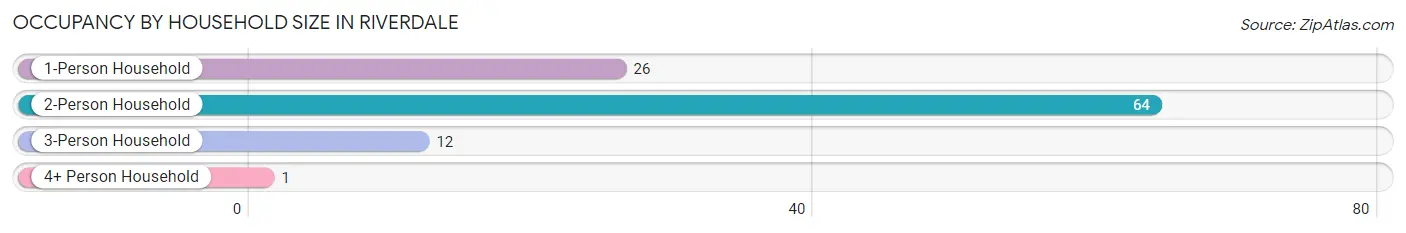
| Household Size | # Housing Units | % Housing Units |
| 1-Person Household | 26 | 25.2% |
| 2-Person Household | 64 | 62.1% |
| 3-Person Household | 12 | 11.7% |
| 4+ Person Household | 1 | 1.0% |
| Total Housing Units | 103 | 100.0% |
Occupancy by Ownership by Household Size in Riverdale
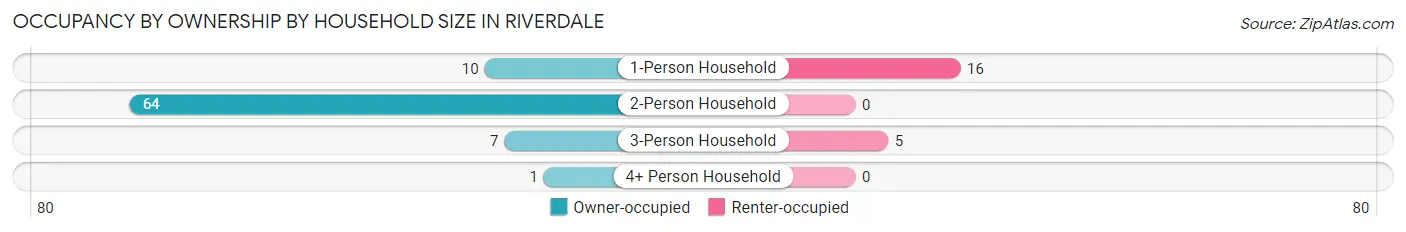
| Household Size | Owner-occupied | Renter-occupied |
| 1-Person Household | 10 (38.5%) | 16 (61.5%) |
| 2-Person Household | 64 (100.0%) | 0 (0.0%) |
| 3-Person Household | 7 (58.3%) | 5 (41.7%) |
| 4+ Person Household | 1 (100.0%) | 0 (0.0%) |
| Total Housing Units | 82 (79.6%) | 21 (20.4%) |
Occupancy by Educational Attainment in Riverdale
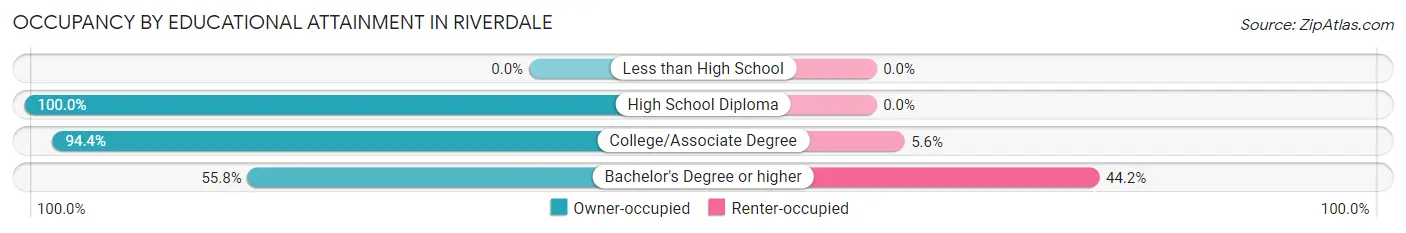
| Household Size | Owner-occupied | Renter-occupied |
| Less than High School | 0 (0.0%) | 0 (0.0%) |
| High School Diploma | 24 (100.0%) | 0 (0.0%) |
| College/Associate Degree | 34 (94.4%) | 2 (5.6%) |
| Bachelor's Degree or higher | 24 (55.8%) | 19 (44.2%) |
Occupancy by Age of Householder in Riverdale
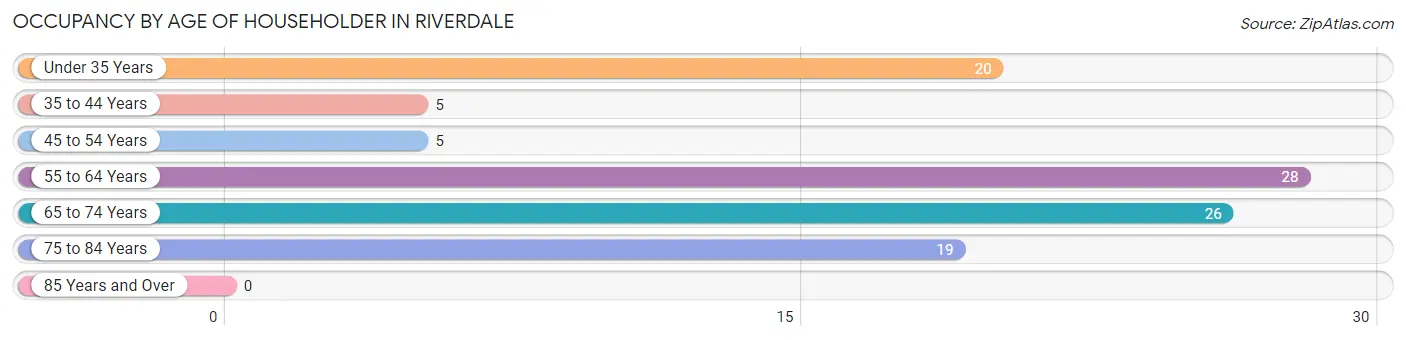
| Age Bracket | # Households | % Households |
| Under 35 Years | 20 | 19.4% |
| 35 to 44 Years | 5 | 4.9% |
| 45 to 54 Years | 5 | 4.9% |
| 55 to 64 Years | 28 | 27.2% |
| 65 to 74 Years | 26 | 25.2% |
| 75 to 84 Years | 19 | 18.4% |
| 85 Years and Over | 0 | 0.0% |
| Total | 103 | 100.0% |
Housing Finances in Riverdale
Median Income by Occupancy in Riverdale
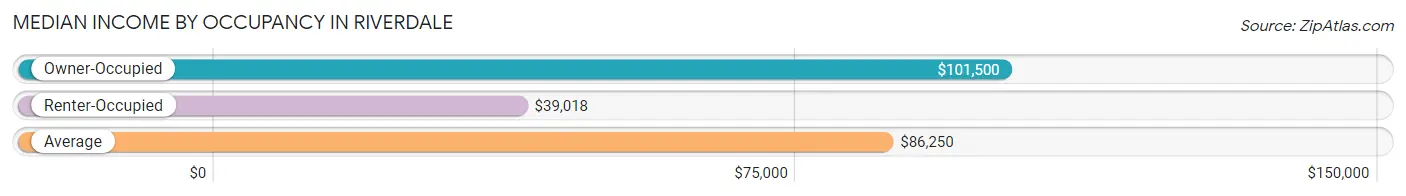
| Occupancy Type | # Households | Median Income |
| Owner-Occupied | 82 (79.6%) | $101,500 |
| Renter-Occupied | 21 (20.4%) | $39,018 |
| Average | 103 (100.0%) | $86,250 |
Occupancy by Householder Income Bracket in Riverdale
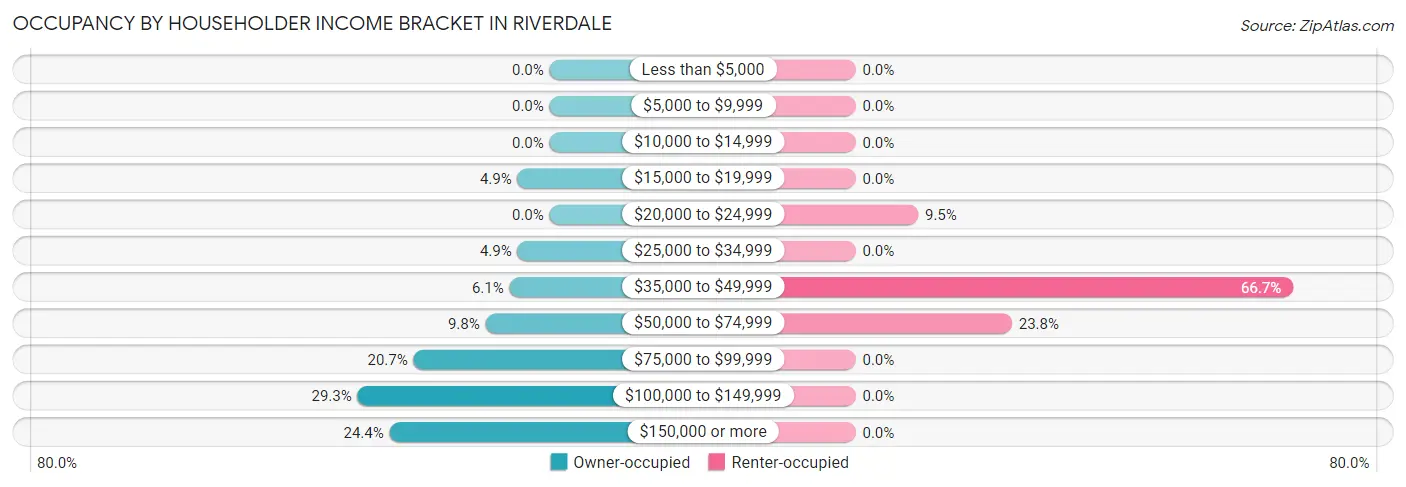
| Income Bracket | Owner-occupied | Renter-occupied |
| Less than $5,000 | 0 (0.0%) | 0 (0.0%) |
| $5,000 to $9,999 | 0 (0.0%) | 0 (0.0%) |
| $10,000 to $14,999 | 0 (0.0%) | 0 (0.0%) |
| $15,000 to $19,999 | 4 (4.9%) | 0 (0.0%) |
| $20,000 to $24,999 | 0 (0.0%) | 2 (9.5%) |
| $25,000 to $34,999 | 4 (4.9%) | 0 (0.0%) |
| $35,000 to $49,999 | 5 (6.1%) | 14 (66.7%) |
| $50,000 to $74,999 | 8 (9.8%) | 5 (23.8%) |
| $75,000 to $99,999 | 17 (20.7%) | 0 (0.0%) |
| $100,000 to $149,999 | 24 (29.3%) | 0 (0.0%) |
| $150,000 or more | 20 (24.4%) | 0 (0.0%) |
| Total | 82 (100.0%) | 21 (100.0%) |
Monthly Housing Cost Tiers in Riverdale
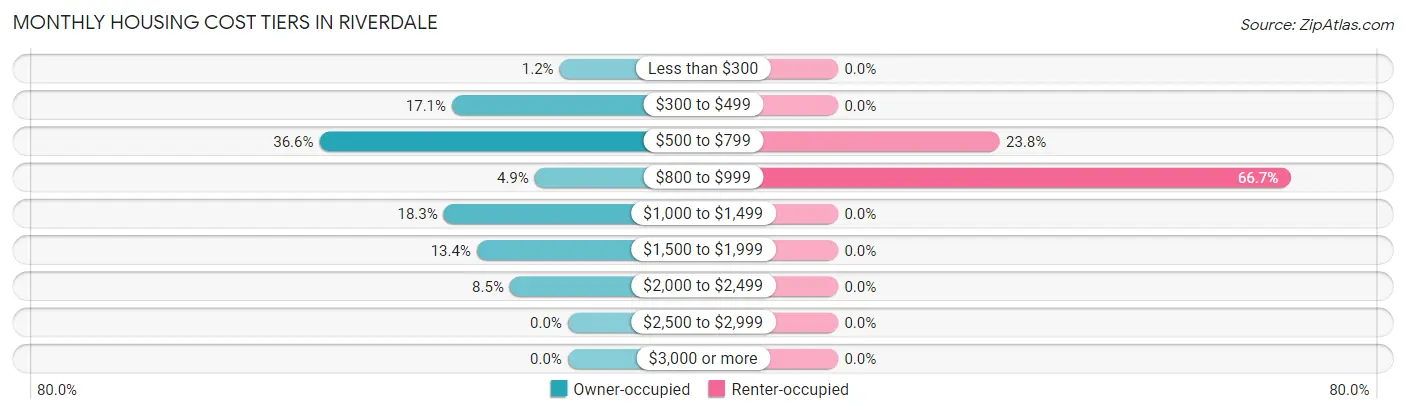
| Monthly Cost | Owner-occupied | Renter-occupied |
| Less than $300 | 1 (1.2%) | 0 (0.0%) |
| $300 to $499 | 14 (17.1%) | 0 (0.0%) |
| $500 to $799 | 30 (36.6%) | 5 (23.8%) |
| $800 to $999 | 4 (4.9%) | 14 (66.7%) |
| $1,000 to $1,499 | 15 (18.3%) | 0 (0.0%) |
| $1,500 to $1,999 | 11 (13.4%) | 0 (0.0%) |
| $2,000 to $2,499 | 7 (8.5%) | 0 (0.0%) |
| $2,500 to $2,999 | 0 (0.0%) | 0 (0.0%) |
| $3,000 or more | 0 (0.0%) | 0 (0.0%) |
| Total | 82 (100.0%) | 21 (100.0%) |
Physical Housing Characteristics in Riverdale
Housing Structures in Riverdale
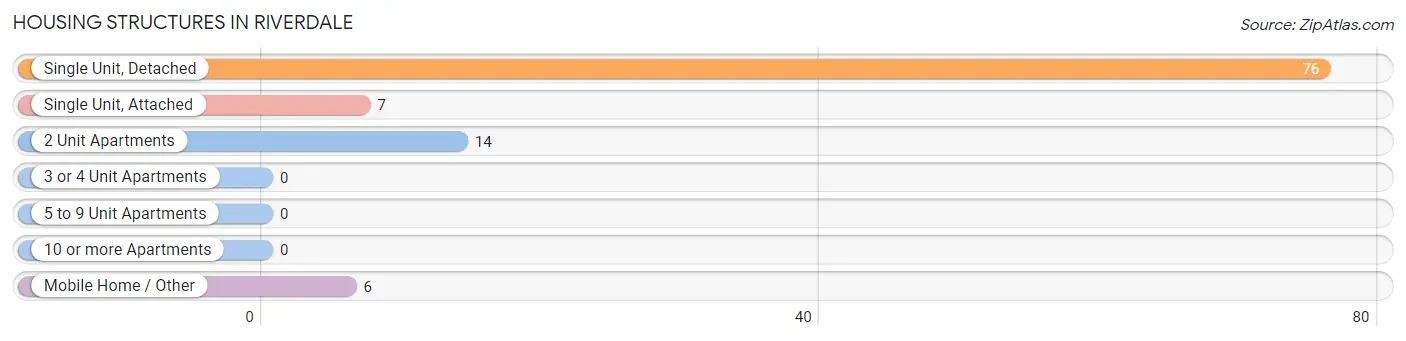
| Structure Type | # Housing Units | % Housing Units |
| Single Unit, Detached | 76 | 73.8% |
| Single Unit, Attached | 7 | 6.8% |
| 2 Unit Apartments | 14 | 13.6% |
| 3 or 4 Unit Apartments | 0 | 0.0% |
| 5 to 9 Unit Apartments | 0 | 0.0% |
| 10 or more Apartments | 0 | 0.0% |
| Mobile Home / Other | 6 | 5.8% |
| Total | 103 | 100.0% |
Housing Structures by Occupancy in Riverdale
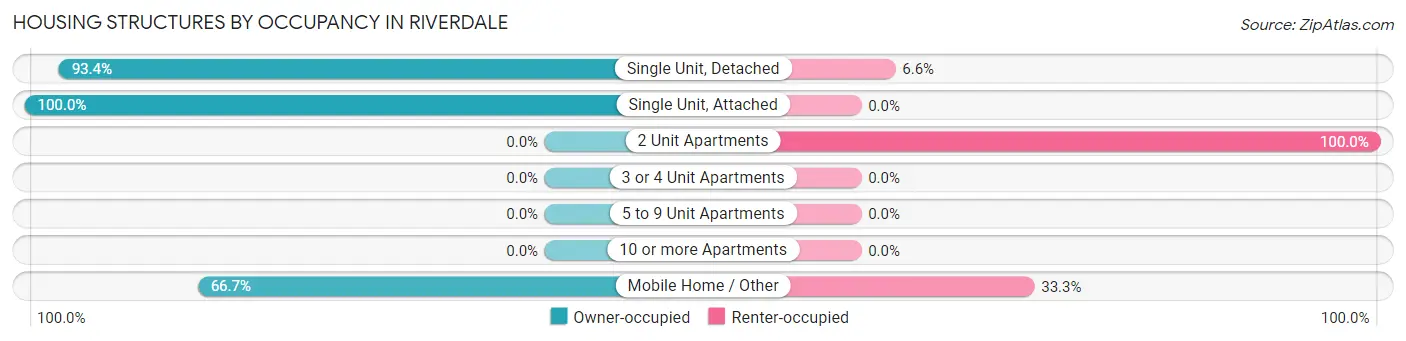
| Structure Type | Owner-occupied | Renter-occupied |
| Single Unit, Detached | 71 (93.4%) | 5 (6.6%) |
| Single Unit, Attached | 7 (100.0%) | 0 (0.0%) |
| 2 Unit Apartments | 0 (0.0%) | 14 (100.0%) |
| 3 or 4 Unit Apartments | 0 (0.0%) | 0 (0.0%) |
| 5 to 9 Unit Apartments | 0 (0.0%) | 0 (0.0%) |
| 10 or more Apartments | 0 (0.0%) | 0 (0.0%) |
| Mobile Home / Other | 4 (66.7%) | 2 (33.3%) |
| Total | 82 (79.6%) | 21 (20.4%) |
Housing Structures by Number of Rooms in Riverdale
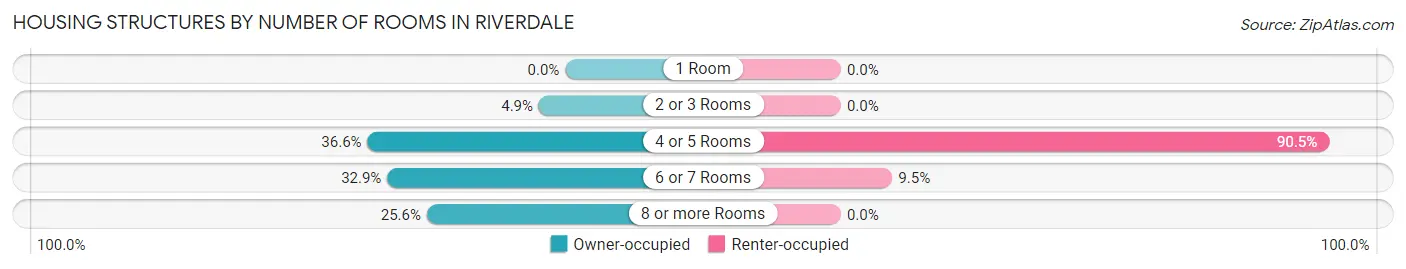
| Number of Rooms | Owner-occupied | Renter-occupied |
| 1 Room | 0 (0.0%) | 0 (0.0%) |
| 2 or 3 Rooms | 4 (4.9%) | 0 (0.0%) |
| 4 or 5 Rooms | 30 (36.6%) | 19 (90.5%) |
| 6 or 7 Rooms | 27 (32.9%) | 2 (9.5%) |
| 8 or more Rooms | 21 (25.6%) | 0 (0.0%) |
| Total | 82 (100.0%) | 21 (100.0%) |
Housing Structure by Heating Type in Riverdale
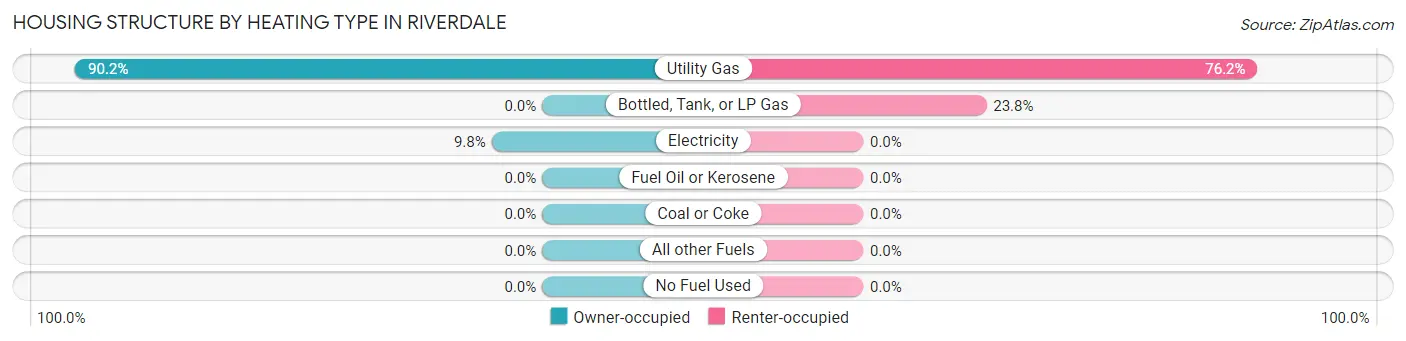
| Heating Type | Owner-occupied | Renter-occupied |
| Utility Gas | 74 (90.2%) | 16 (76.2%) |
| Bottled, Tank, or LP Gas | 0 (0.0%) | 5 (23.8%) |
| Electricity | 8 (9.8%) | 0 (0.0%) |
| Fuel Oil or Kerosene | 0 (0.0%) | 0 (0.0%) |
| Coal or Coke | 0 (0.0%) | 0 (0.0%) |
| All other Fuels | 0 (0.0%) | 0 (0.0%) |
| No Fuel Used | 0 (0.0%) | 0 (0.0%) |
| Total | 82 (100.0%) | 21 (100.0%) |
Household Vehicle Usage in Riverdale
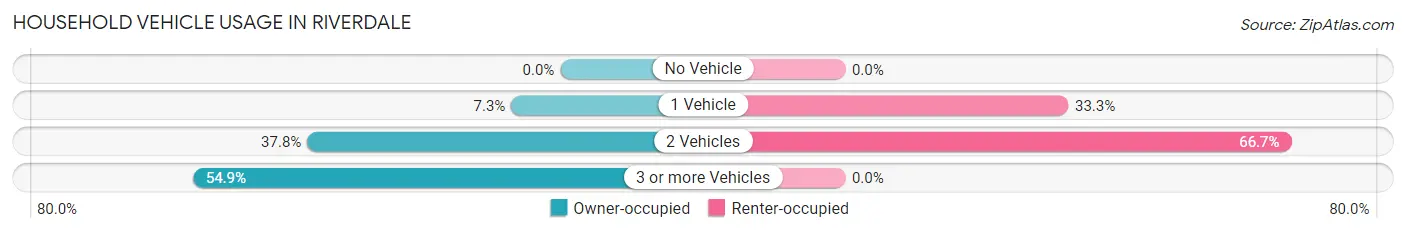
| Vehicles per Household | Owner-occupied | Renter-occupied |
| No Vehicle | 0 (0.0%) | 0 (0.0%) |
| 1 Vehicle | 6 (7.3%) | 7 (33.3%) |
| 2 Vehicles | 31 (37.8%) | 14 (66.7%) |
| 3 or more Vehicles | 45 (54.9%) | 0 (0.0%) |
| Total | 82 (100.0%) | 21 (100.0%) |
Real Estate & Mortgages in Riverdale
Real Estate and Mortgage Overview in Riverdale
| Characteristic | Without Mortgage | With Mortgage |
| Housing Units | 48 | 34 |
| Median Property Value | $209,400 | $250,000 |
| Median Household Income | - | - |
| Monthly Housing Costs | $550 | $0 |
| Real Estate Taxes | $1,975 | $0 |
Property Value by Mortgage Status in Riverdale
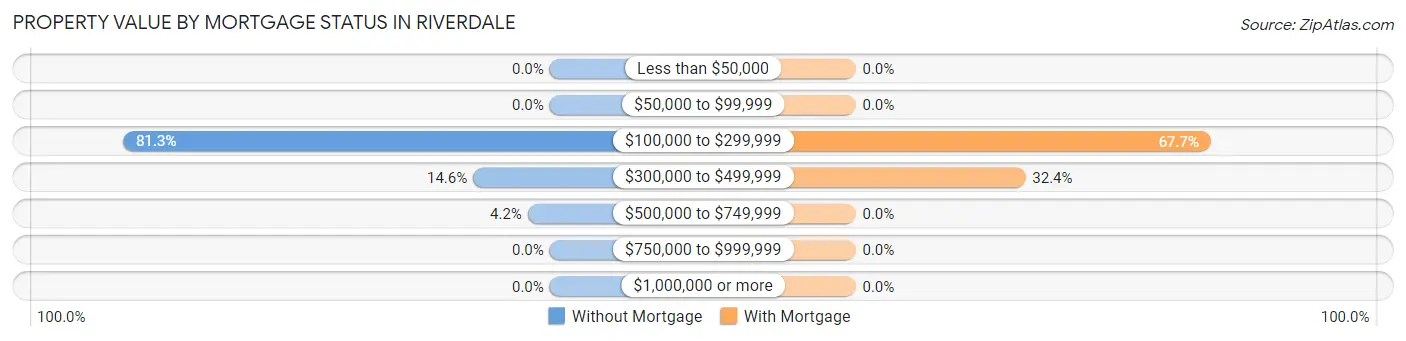
| Property Value | Without Mortgage | With Mortgage |
| Less than $50,000 | 0 (0.0%) | 0 (0.0%) |
| $50,000 to $99,999 | 0 (0.0%) | 0 (0.0%) |
| $100,000 to $299,999 | 39 (81.2%) | 23 (67.6%) |
| $300,000 to $499,999 | 7 (14.6%) | 11 (32.4%) |
| $500,000 to $749,999 | 2 (4.2%) | 0 (0.0%) |
| $750,000 to $999,999 | 0 (0.0%) | 0 (0.0%) |
| $1,000,000 or more | 0 (0.0%) | 0 (0.0%) |
| Total | 48 (100.0%) | 34 (100.0%) |
Household Income by Mortgage Status in Riverdale
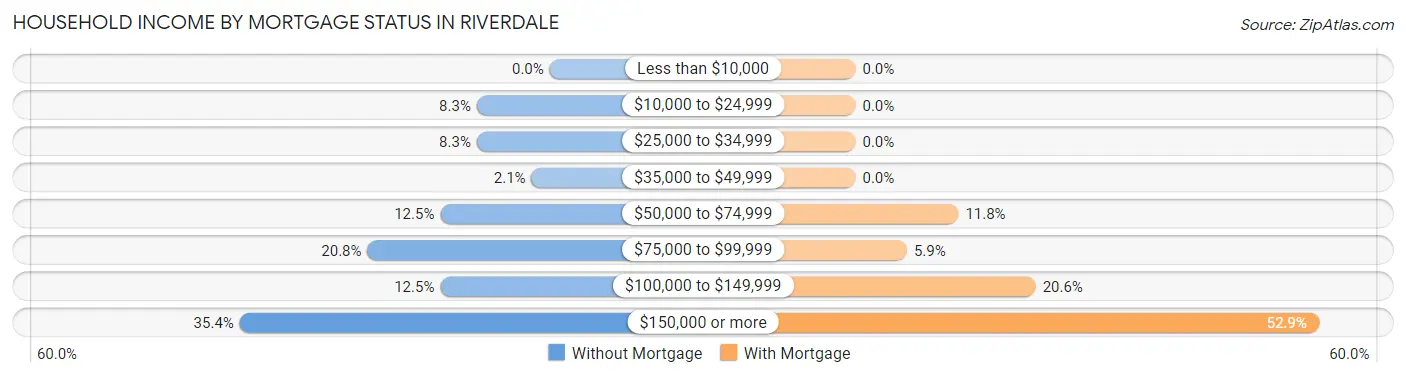
| Household Income | Without Mortgage | With Mortgage |
| Less than $10,000 | 0 (0.0%) | 0 (0.0%) |
| $10,000 to $24,999 | 4 (8.3%) | 0 (0.0%) |
| $25,000 to $34,999 | 4 (8.3%) | 0 (0.0%) |
| $35,000 to $49,999 | 1 (2.1%) | 0 (0.0%) |
| $50,000 to $74,999 | 6 (12.5%) | 4 (11.8%) |
| $75,000 to $99,999 | 10 (20.8%) | 2 (5.9%) |
| $100,000 to $149,999 | 6 (12.5%) | 7 (20.6%) |
| $150,000 or more | 17 (35.4%) | 18 (52.9%) |
| Total | 48 (100.0%) | 34 (100.0%) |
Property Value to Household Income Ratio in Riverdale
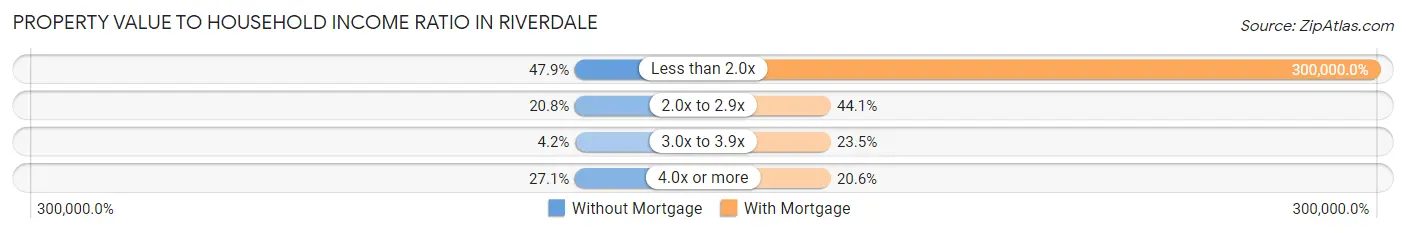
| Value-to-Income Ratio | Without Mortgage | With Mortgage |
| Less than 2.0x | 23 (47.9%) | 102,000 (300,000.0%) |
| 2.0x to 2.9x | 10 (20.8%) | 15 (44.1%) |
| 3.0x to 3.9x | 2 (4.2%) | 8 (23.5%) |
| 4.0x or more | 13 (27.1%) | 7 (20.6%) |
| Total | 48 (100.0%) | 34 (100.0%) |
Real Estate Taxes by Mortgage Status in Riverdale
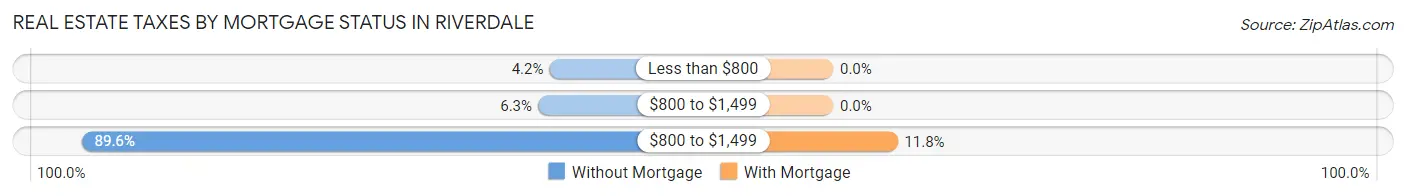
| Property Taxes | Without Mortgage | With Mortgage |
| Less than $800 | 2 (4.2%) | 0 (0.0%) |
| $800 to $1,499 | 3 (6.2%) | 0 (0.0%) |
| $800 to $1,499 | 43 (89.6%) | 4 (11.8%) |
| Total | 48 (100.0%) | 34 (100.0%) |
Health & Disability in Riverdale
Health Insurance Coverage by Age in Riverdale
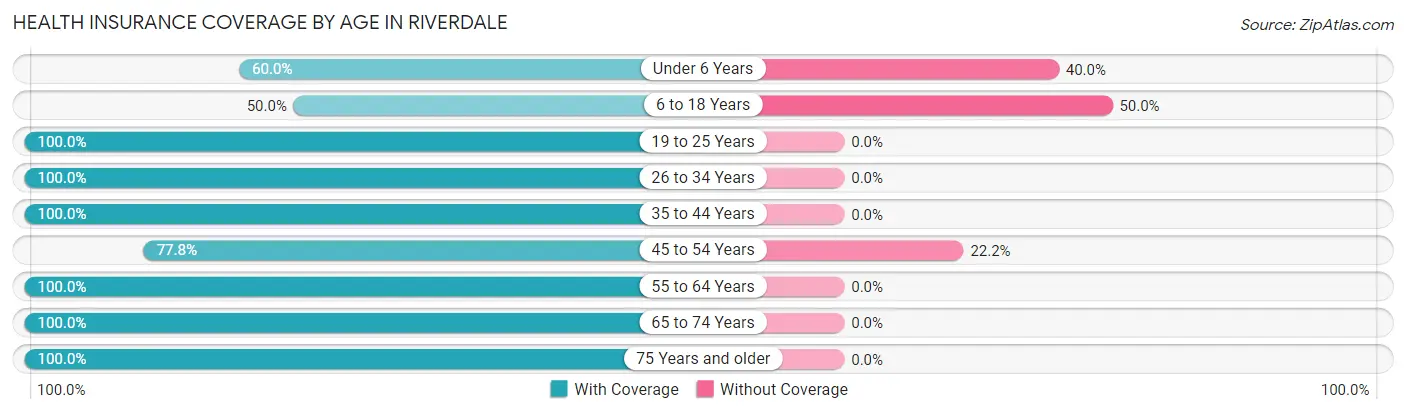
| Age Bracket | With Coverage | Without Coverage |
| Under 6 Years | 3 (60.0%) | 2 (40.0%) |
| 6 to 18 Years | 1 (50.0%) | 1 (50.0%) |
| 19 to 25 Years | 16 (100.0%) | 0 (0.0%) |
| 26 to 34 Years | 15 (100.0%) | 0 (0.0%) |
| 35 to 44 Years | 5 (100.0%) | 0 (0.0%) |
| 45 to 54 Years | 7 (77.8%) | 2 (22.2%) |
| 55 to 64 Years | 51 (100.0%) | 0 (0.0%) |
| 65 to 74 Years | 59 (100.0%) | 0 (0.0%) |
| 75 Years and older | 20 (100.0%) | 0 (0.0%) |
| Total | 177 (97.3%) | 5 (2.8%) |
Health Insurance Coverage by Citizenship Status in Riverdale
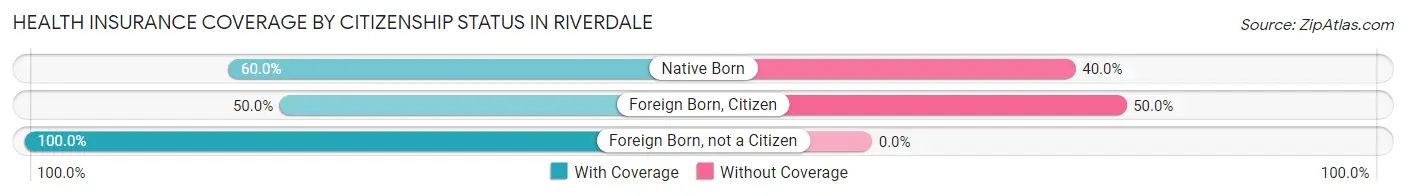
| Citizenship Status | With Coverage | Without Coverage |
| Native Born | 3 (60.0%) | 2 (40.0%) |
| Foreign Born, Citizen | 1 (50.0%) | 1 (50.0%) |
| Foreign Born, not a Citizen | 16 (100.0%) | 0 (0.0%) |
Health Insurance Coverage by Household Income in Riverdale
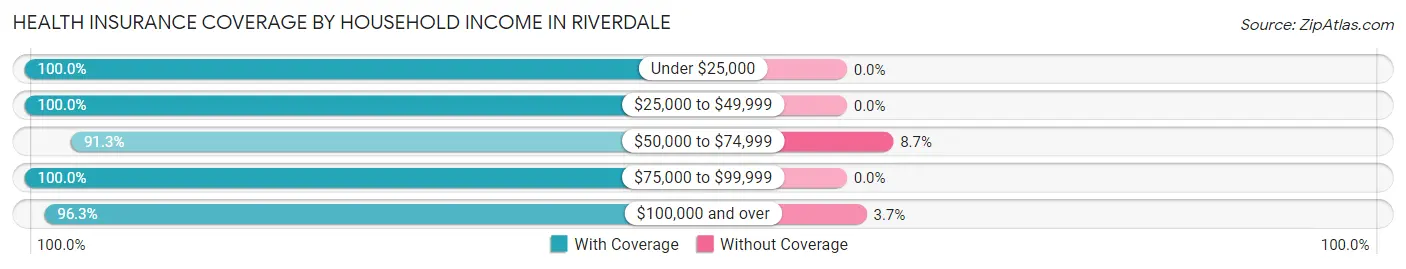
| Household Income | With Coverage | Without Coverage |
| Under $25,000 | 12 (100.0%) | 0 (0.0%) |
| $25,000 to $49,999 | 29 (100.0%) | 0 (0.0%) |
| $50,000 to $74,999 | 21 (91.3%) | 2 (8.7%) |
| $75,000 to $99,999 | 37 (100.0%) | 0 (0.0%) |
| $100,000 and over | 78 (96.3%) | 3 (3.7%) |
Public vs Private Health Insurance Coverage by Age in Riverdale
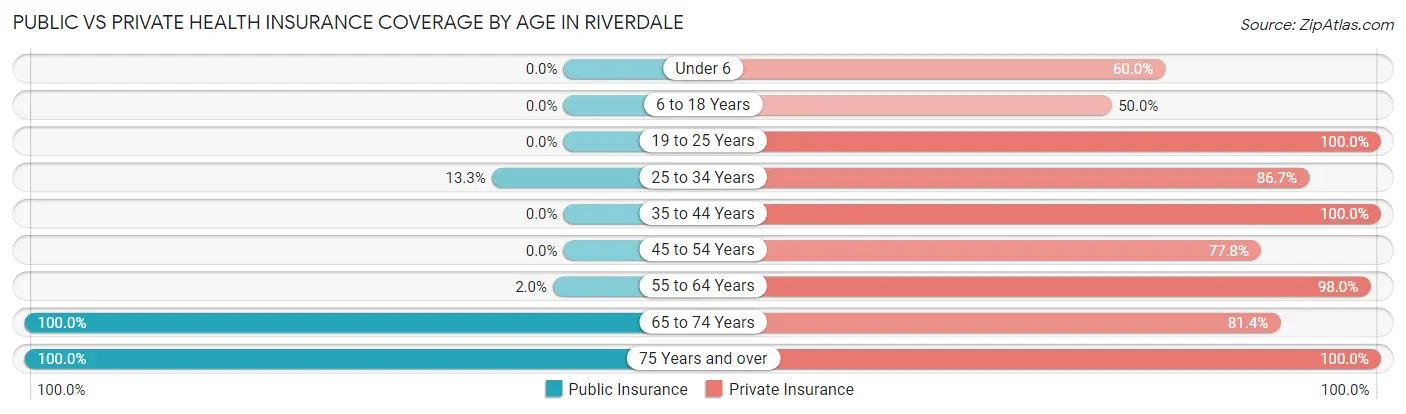
| Age Bracket | Public Insurance | Private Insurance |
| Under 6 | 0 (0.0%) | 3 (60.0%) |
| 6 to 18 Years | 0 (0.0%) | 1 (50.0%) |
| 19 to 25 Years | 0 (0.0%) | 16 (100.0%) |
| 25 to 34 Years | 2 (13.3%) | 13 (86.7%) |
| 35 to 44 Years | 0 (0.0%) | 5 (100.0%) |
| 45 to 54 Years | 0 (0.0%) | 7 (77.8%) |
| 55 to 64 Years | 1 (2.0%) | 50 (98.0%) |
| 65 to 74 Years | 59 (100.0%) | 48 (81.4%) |
| 75 Years and over | 20 (100.0%) | 20 (100.0%) |
| Total | 82 (45.1%) | 163 (89.6%) |
Disability Status by Sex by Age in Riverdale
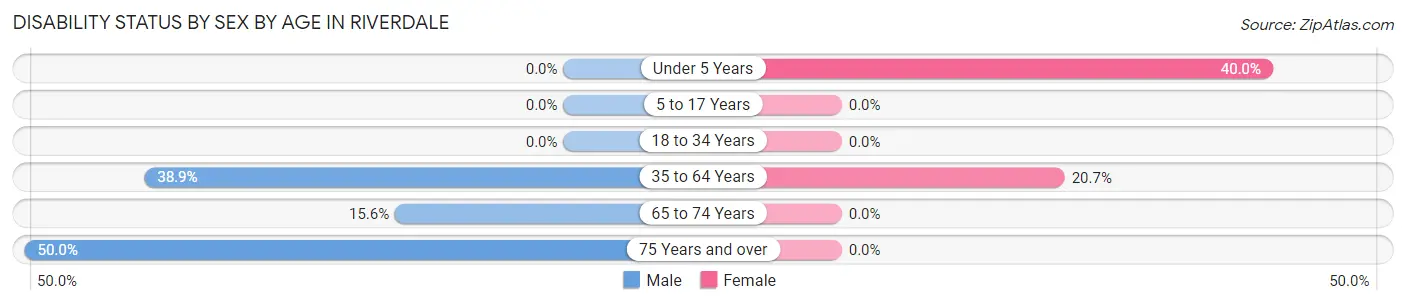
| Age Bracket | Male | Female |
| Under 5 Years | 0 (0.0%) | 2 (40.0%) |
| 5 to 17 Years | 0 (0.0%) | 0 (0.0%) |
| 18 to 34 Years | 0 (0.0%) | 0 (0.0%) |
| 35 to 64 Years | 14 (38.9%) | 6 (20.7%) |
| 65 to 74 Years | 5 (15.6%) | 0 (0.0%) |
| 75 Years and over | 5 (50.0%) | 0 (0.0%) |
Disability Class by Sex by Age in Riverdale
Disability Class: Hearing Difficulty
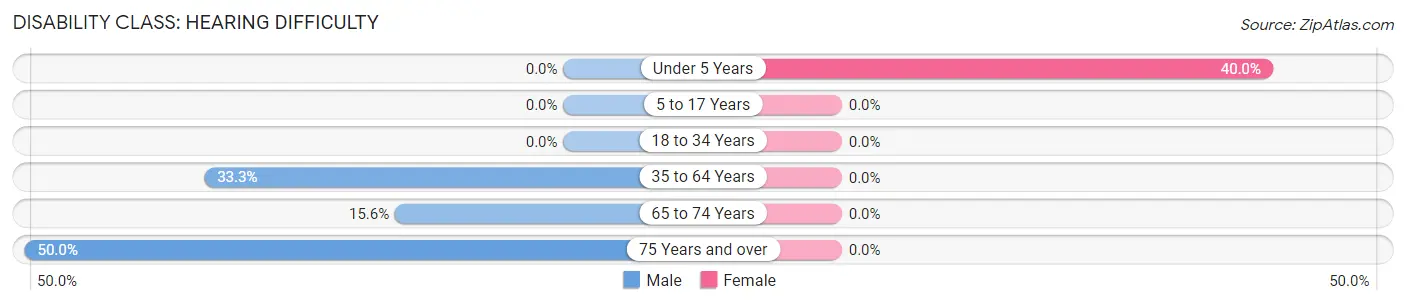
| Age Bracket | Male | Female |
| Under 5 Years | 0 (0.0%) | 2 (40.0%) |
| 5 to 17 Years | 0 (0.0%) | 0 (0.0%) |
| 18 to 34 Years | 0 (0.0%) | 0 (0.0%) |
| 35 to 64 Years | 12 (33.3%) | 0 (0.0%) |
| 65 to 74 Years | 5 (15.6%) | 0 (0.0%) |
| 75 Years and over | 5 (50.0%) | 0 (0.0%) |
Disability Class: Vision Difficulty
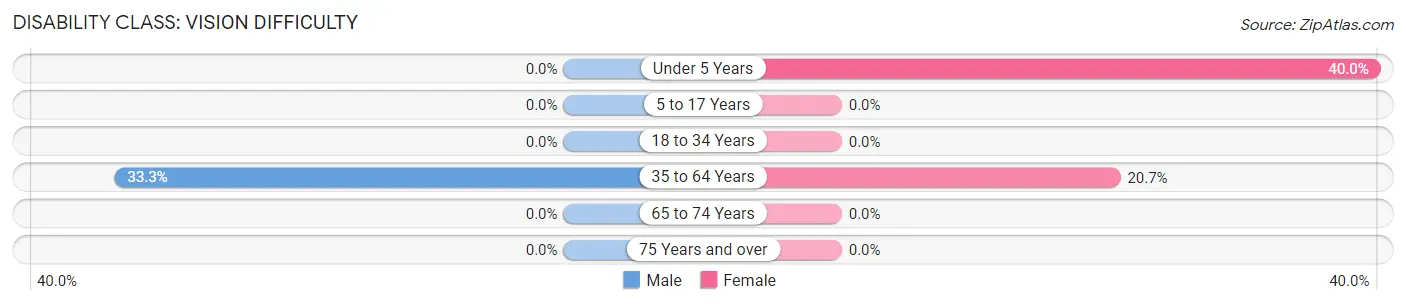
| Age Bracket | Male | Female |
| Under 5 Years | 0 (0.0%) | 2 (40.0%) |
| 5 to 17 Years | 0 (0.0%) | 0 (0.0%) |
| 18 to 34 Years | 0 (0.0%) | 0 (0.0%) |
| 35 to 64 Years | 12 (33.3%) | 6 (20.7%) |
| 65 to 74 Years | 0 (0.0%) | 0 (0.0%) |
| 75 Years and over | 0 (0.0%) | 0 (0.0%) |
Disability Class: Cognitive Difficulty
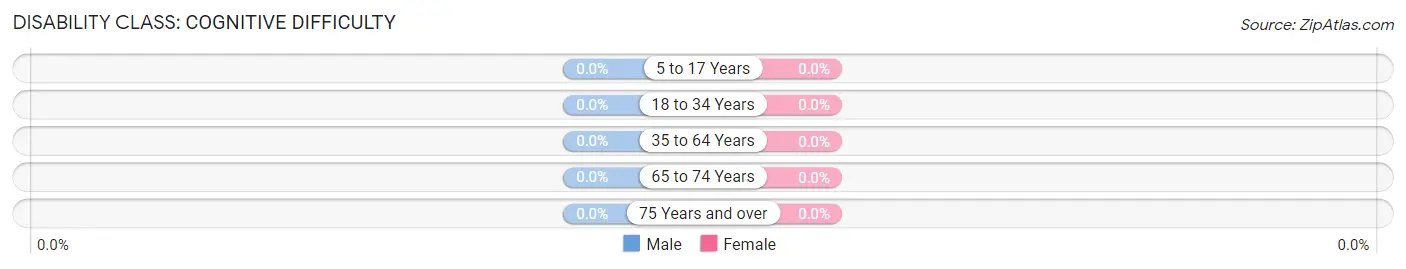
| Age Bracket | Male | Female |
| 5 to 17 Years | 0 (0.0%) | 0 (0.0%) |
| 18 to 34 Years | 0 (0.0%) | 0 (0.0%) |
| 35 to 64 Years | 0 (0.0%) | 0 (0.0%) |
| 65 to 74 Years | 0 (0.0%) | 0 (0.0%) |
| 75 Years and over | 0 (0.0%) | 0 (0.0%) |
Disability Class: Ambulatory Difficulty
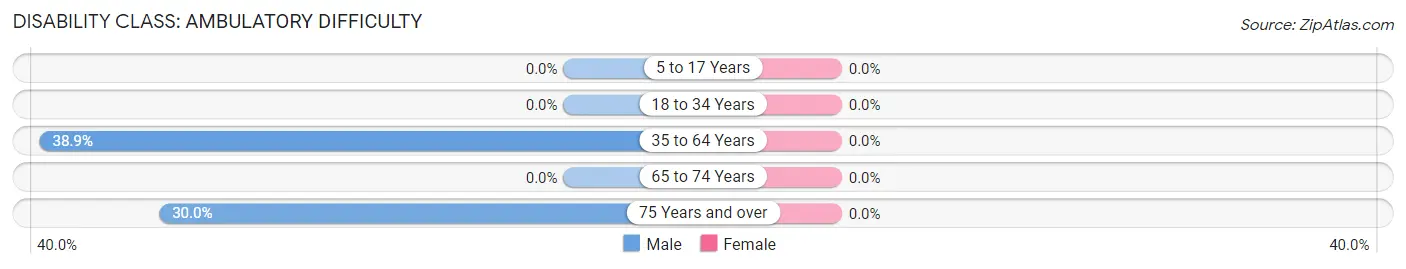
| Age Bracket | Male | Female |
| 5 to 17 Years | 0 (0.0%) | 0 (0.0%) |
| 18 to 34 Years | 0 (0.0%) | 0 (0.0%) |
| 35 to 64 Years | 14 (38.9%) | 0 (0.0%) |
| 65 to 74 Years | 0 (0.0%) | 0 (0.0%) |
| 75 Years and over | 3 (30.0%) | 0 (0.0%) |
Disability Class: Self-Care Difficulty
| Age Bracket | Male | Female |
| 5 to 17 Years | 0 (0.0%) | 0 (0.0%) |
| 18 to 34 Years | 0 (0.0%) | 0 (0.0%) |
| 35 to 64 Years | 0 (0.0%) | 0 (0.0%) |
| 65 to 74 Years | 0 (0.0%) | 0 (0.0%) |
| 75 Years and over | 0 (0.0%) | 0 (0.0%) |
Technology Access in Riverdale
Computing Device Access in Riverdale
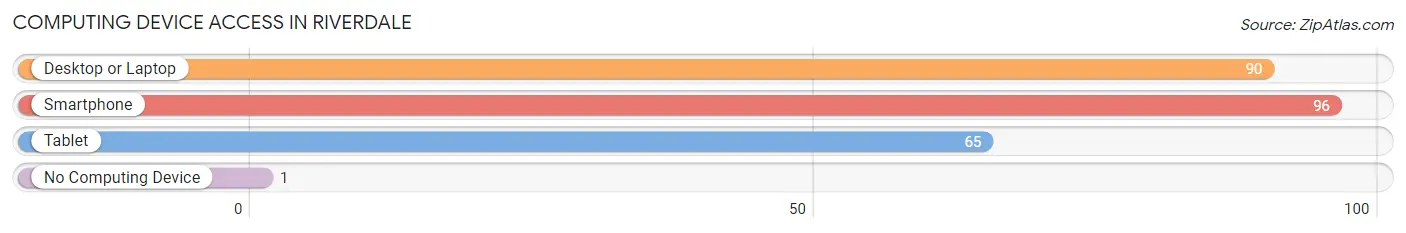
| Device Type | # Households | % Households |
| Desktop or Laptop | 90 | 87.4% |
| Smartphone | 96 | 93.2% |
| Tablet | 65 | 63.1% |
| No Computing Device | 1 | 1.0% |
| Total | 103 | 100.0% |
Internet Access in Riverdale
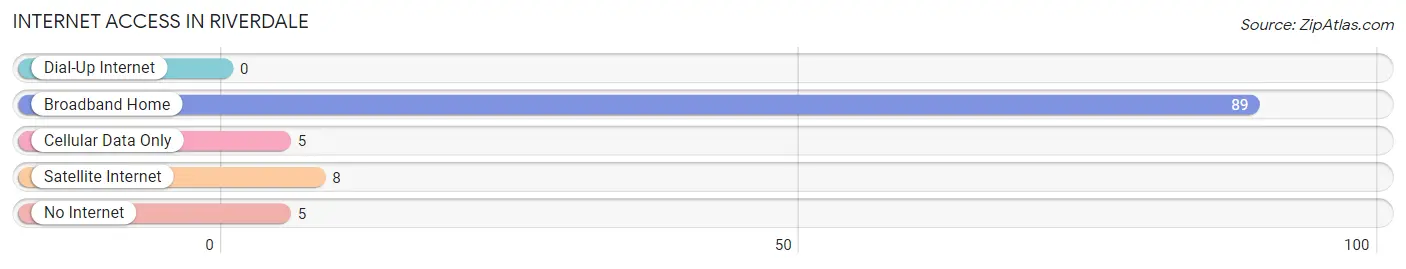
| Internet Type | # Households | % Households |
| Dial-Up Internet | 0 | 0.0% |
| Broadband Home | 89 | 86.4% |
| Cellular Data Only | 5 | 4.9% |
| Satellite Internet | 8 | 7.8% |
| No Internet | 5 | 4.9% |
| Total | 103 | 100.0% |
Riverdale Summary
Riverdale is a small city located in the state of North Dakota, United States. It is situated in the southeastern corner of the state, in the Red River Valley. The city has a population of approximately 1,000 people and is part of the Grand Forks metropolitan area.
History
The area that is now Riverdale was first settled in the late 1800s by Norwegian immigrants. The city was officially incorporated in 1902 and was named after the nearby Red River. The city was originally a farming community, but in the early 1900s, the city began to develop into a small industrial center. The city was home to a number of factories, including a flour mill, a creamery, and a brickyard.
In the 1950s, the city began to experience a population decline as many of the factories closed. However, in the late 1970s, the city began to experience a resurgence as new businesses moved into the area. Today, Riverdale is a small but vibrant city with a variety of businesses and services.
Geography
Riverdale is located in the southeastern corner of North Dakota, in the Red River Valley. The city is situated on the banks of the Red River, which forms the border between North Dakota and Minnesota. The city is surrounded by rolling hills and farmland. The city is located approximately 30 miles south of Grand Forks and is part of the Grand Forks metropolitan area.
Economy
Riverdale is a small but vibrant city with a variety of businesses and services. The city is home to a number of small businesses, including restaurants, retail stores, and professional services. The city is also home to a number of manufacturing companies, including a furniture manufacturer and a plastics manufacturer. The city is also home to a number of agricultural businesses, including a dairy farm and a grain elevator.
Demographics
As of the 2010 census, the population of Riverdale was 1,000 people. The population is predominantly white, with a small minority population. The median household income is $41,000 and the median home value is $90,000. The city has a low unemployment rate and a high rate of homeownership.
Riverdale is a small but vibrant city with a rich history and a bright future. The city is home to a variety of businesses and services, and is a great place to live and work. The city is also home to a number of cultural and recreational activities, making it a great place to visit and explore.
Common Questions
What is the Total Population of Riverdale?
Total Population of Riverdale is 182.
What is the Total Male Population of Riverdale?
Total Male Population of Riverdale is 88.
What is the Total Female Population of Riverdale?
Total Female Population of Riverdale is 94.
What is the Ratio of Males per 100 Females in Riverdale?
There are 93.62 Males per 100 Females in Riverdale.
What is the Ratio of Females per 100 Males in Riverdale?
There are 106.82 Females per 100 Males in Riverdale.
What is the Median Population Age in Riverdale?
Median Population Age in Riverdale is 63.2 Years.
What is the Average Family Size in Riverdale
Average Family Size in Riverdale is 2.0 People.
What is the Average Household Size in Riverdale
Average Household Size in Riverdale is 1.8 People.
What is Per Capita Income in Riverdale?
Per Capita income in Riverdale is $58,265.
What is the Median Family Income in Riverdale?
Median Family Income in Riverdale is $101,750.
What is the Median Household income in Riverdale?
Median Household Income in Riverdale is $86,250.
What is Income or Wage Gap in Riverdale?
Income or Wage Gap in Riverdale is 31.6%.
Women in Riverdale earn 68.4 cents for every dollar earned by a man.
What is Inequality or Gini Index in Riverdale?
Inequality or Gini Index in Riverdale is 0.38.
How Large is the Labor Force in Riverdale?
There are 96 People in the Labor Forcein in Riverdale.
What is the Percentage of People in the Labor Force in Riverdale?
54.9% of People are in the Labor Force in Riverdale.